IBM Nears Historically Strong Sep 12-Apr 2 Trading Window
IBM is heading toward a historically strong Sep 12–Apr 2 trading window just as investors weigh weak mainframe sales against software and quantum growth.
Price as of Aug 20, 2026: $233.69 (last close).

What is the seasonal pattern for IBM (IBM)?
IBM has risen in 13 of 15 years during this Sep 12–Apr 2 midterm-year window, with an average gain of 23.01% in winning years.
- 13 wins and 2 losses in this window, with winning years averaging 23.01% gains and a 19% average across all years.
- The upcoming seasonal window starts on Sep 12 and runs 203 days through Apr 2, covering the late midterm year into the start of the year before the presidential election.
- Percent Profitable stands at 87%, with 13 winners and 2 losers across the last 15 midterm election years.
- Avg Profit reflects winners only at 23.01%, while Avg Profit - All, which includes losing years, is still a strong 19%.
- Historical intraperiod swings have been meaningful, with some years showing double-digit drawdowns even when the window finished higher.
- The pattern is long-biased, with a TradeWave Ratio of 1.6 and a Sharpe ratio of 0.97, pointing to historically favorable but volatile upside.
According to historical data from TradeWave.ai, this specific midterm-year stretch has behaved very differently from an average calendar period for IBM. The next section looks at how that election-cycle pattern lines up with today’s setup.
How has IBM (IBM) traded in the Sep 12–Apr 2 midterm-year window?
IBM has closed higher in 13 of the last 15 midterm election years during the Sep 12–Apr 2 window, with a 23.01% average gain in winning seasons and a 19% average across all years. Today the stock trades at 233.69 after a 1.5% drop in the prior session, sitting well below its 52-week high of about 327.74 and above its 52-week low near 196.36, a range that leaves room on both sides of this historical pattern.
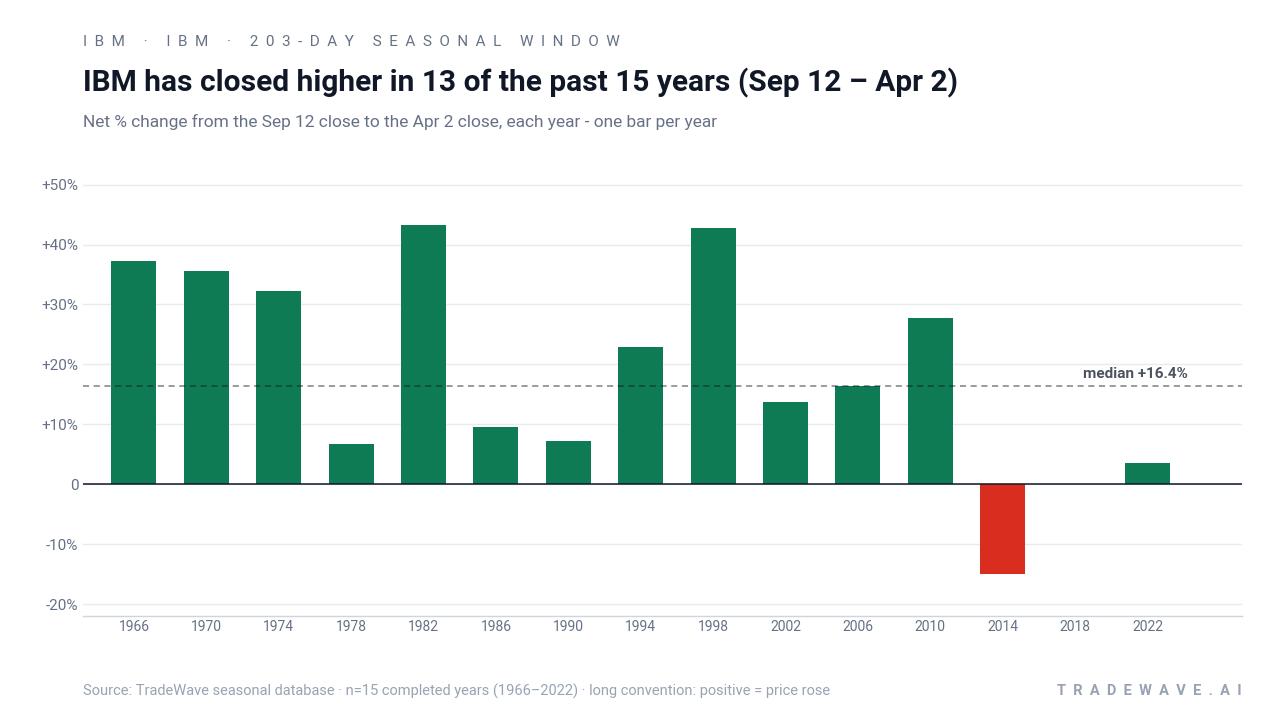
The presidential election cycle matters here because this pattern is built only from midterm election years, which often feature policy uncertainty, tighter financial conditions and choppy index-level trading before a stronger pre-election year tone. For IBM, that backdrop has historically lined up with a long, 203-day stretch where the stock has tended to grind higher from early autumn through early spring, even as the broader tape has sometimes been volatile.
Across the 15-year sample, the trade direction is explicitly long. Percent Profitable is 87%, with 13 winners and just 2 losers, so the IBM seasonal trend in this midterm-year window has been clearly bullish rather than mixed. Average gains in the winning years come in at 23.01%, while including the two down seasons still leaves Avg Profit - All at 19%, which is unusually strong for a window that spans more than half a year.
The per-year breakdown shows how that plays out in practice. Strong seasons such as 1998 and 2010 delivered net returns of 42.85% and 27.79% respectively, with maximum favorable moves inside the window of 54.54% and 30.49%. On the weaker side, 2014 finished down 14.95% and 2018 was essentially flat at -0.04%, reminding traders that even a high win-rate IBM trading window can produce disappointing outcomes in individual years.
Intraperiod risk has been real. In 2002, IBM ultimately finished the window up 13.77%, but at one point it was down 24.85% from the entry level before recovering. In 2018, the worst drawdown reached 26.8% even though the final result was close to unchanged, showing how maximum adverse excursions can be large even when the closing print does not look dramatic.
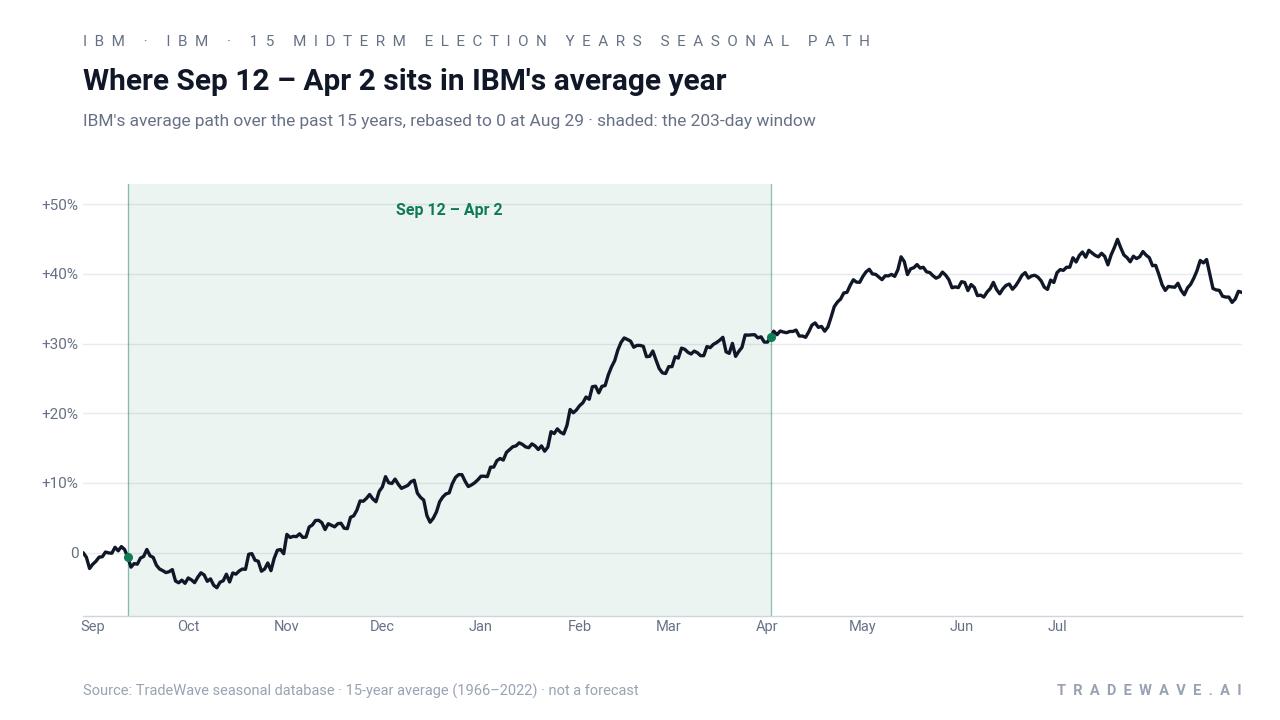
The historical seasonal average chart shows IBM typically starting this window with a modest consolidation, then building a steadier uptrend into the winter months before flattening out toward the end. The shape is not a straight line, but the clustering of gains in the middle of the window stands out compared with the rest of the average year.
A second view combines yearly net results with the full intraperiod range to show how upside and downside have coexisted.
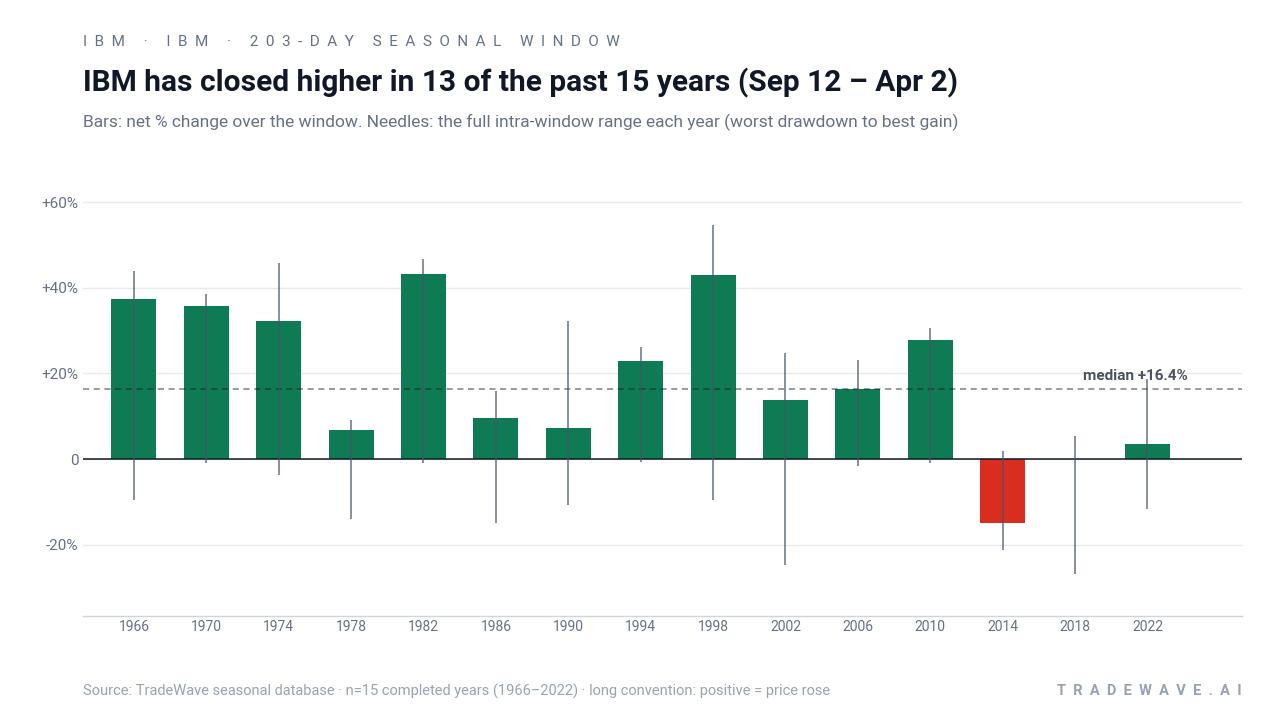
The combined net / range chart makes the trade-off clear: many years show sizeable maximum favorable moves alongside double-digit maximum adverse moves, consistent with a TradeWave Ratio of 1.6 and a Sharpe ratio of 0.97. Add it up and the cumulative return from repeatedly holding this 203-day IBM trading window across the 15 midterm election years reaches 1,056%, which is why this slice of the calendar stands out on a long-term stock pattern analysis.
History does not guarantee future results; adverse excursions can be large even in winning windows, and IBM’s intraperiod drawdowns have at times exceeded 20% before recovering.
Why does IBM (IBM) follow this seasonal pattern?
One likely driver is the way IBM’s earnings calendar and enterprise IT budgets line up with the political cycle. Midterm-year autumn often coincides with large corporate and government contract decisions, while the following winter and early spring capture fiscal-year rollovers and renewed tech spending. Analysts have also pointed to sector rotation into more defensive, cash-generative names like IBM late in midterm election years as investors position ahead of the historically stronger year before the presidential election.
What is driving IBM (IBM) today?
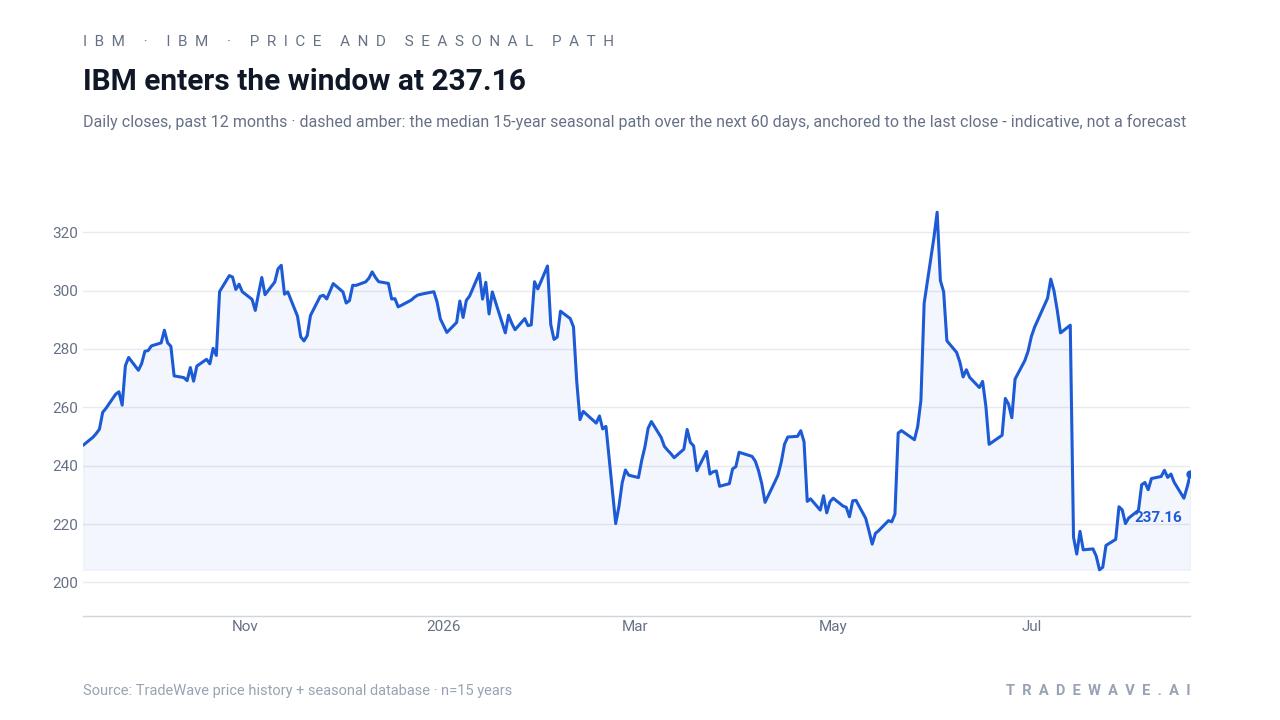
IBM shares closed at 233.69 in the prior session, down 1.5% on the day, after a volatile stretch that has left the stock about 28.7% below its 52-week high of roughly 327.74 and about 19.0% above its 52-week low near 196.36. The latest leg of weakness followed Q2 2026 results on Aug 18, when a 42% collapse in mainframe sales rattled investors even as management highlighted software tailwinds and recurring revenue strength.[1] At the same time, IBM has been leaning into growth narratives, including FedRAMP Moderate authorization for its Maximo Government SaaS platform that opens more federal cloud opportunities[3] and a quantum computing milestone in which engineers successfully joined and cooled two cryogenic modules, a step toward more scalable quantum systems.[2]
The chart below shows how that mix of hardware headwinds and software and quantum catalysts has played out in IBM’s price over the past year, alongside a 60-day seasonal projection.
Macro conditions add another layer. Broader markets are digesting a roughly 35% implied chance of a 25 bp rate hike at the September FOMC meeting, a backdrop that has kept volatility elevated across large-cap tech and software names. Within that environment, IBM sits at the intersection of defensive cash flow, cyclical hardware exposure and long-duration AI and quantum projects, which can all react differently to shifting rate expectations and risk appetite.
What should traders watch as IBM approaches this seasonal window?
First, the calendar. The 203-day IBM seasonal window tied to the last 15 midterm election years begins on Sep 12 and runs through Apr 2, overlapping the transition from the midterm election year into the historically stronger year before the presidential election. Traders watching IBM’s seasonal trend will be focused on whether the stock can stabilize above the recent low near 233 and start to build higher lows into that date, which would be more consistent with prior strong windows.
Second, earnings and guidance. Any follow-up commentary on mainframe demand after the 42% Q2 collapse, and how quickly IBM can offset that with software and consulting growth, will shape how comfortable investors feel leaning into a historically bullish IBM trading window.[1] Signs that mainframe weakness is bottoming while software and AI-related revenue accelerates would rhyme with prior winning years in the pattern, where cyclical headwinds faded as the window progressed.
Third, policy and public-sector demand. The FedRAMP Moderate authorization for Maximo Government SaaS gives IBM a clearer path into federal cloud deals,[3] and the year before the presidential election often brings a pickup in government IT spending as agencies lock in projects ahead of potential leadership changes. If contract wins and backlog commentary start to reflect that, it would support the idea that this midterm-year seasonal window is again aligning with a friendlier demand backdrop.
Finally, innovation milestones. The recent quantum computing advance, in which IBM joined and cooled two cryogenic modules, is not an immediate earnings driver but it reinforces the company’s positioning in high-end compute and AI infrastructure.[2] Traders will be watching whether such milestones continue and whether management can tie them more directly to commercial roadmaps during the upcoming seasonal window, which in prior cycles has often rewarded credible long-term growth stories with sustained multiple support.
Put together, the setup is straightforward: IBM is entering late summer with a bruised but not broken share price, a historically strong Sep–Apr seasonal pattern in midterm election years, and a mixed fundamental tape that includes both mainframe risk and software, cloud and quantum opportunity. How the stock behaves into and through this window, especially around earnings updates and policy headlines, will show whether this cycle tracks the 13 prior winners or one of the two outlier years that broke the pattern.
Sources
About this seasonal analysis
Seasonal pattern data is sourced from TradeWave.ai, which analyzes historical price behavior across annual calendar windows going back up to 30 years. Read the full data methodology or the book The 100-Year Pattern by Afshin Moshrefi (2026 edition). Past performance of seasonal patterns does not guarantee future results. This article is for informational purposes only and does not constitute investment advice.