Thermo Fisher Scientific (TMO) Near Highs as a 306-Day, 100%-Win Midterm Run Opens
Thermo Fisher Scientific is trading near record highs as it approaches a 306-day midterm-year window that has never been negative in the past decade of cycles.
Price as of Aug 20, 2026: $627.55 (last close).
What is the seasonal pattern for Thermo Fisher Scientific (TMO)?
Thermo Fisher Scientific has risen in 10 of 10 midterm-election-year Sep 20–Jul 22 windows, with an average gain of 29.25% in winning years.
- 10 for 10 in this window, with average gains of 29.25% across all winning years.
- Percent Profitable is 100%, with 10 winners and 0 losers in the last 10 midterm-election-year cycles.
- The upcoming window starts on Sep 20, 2026 and runs 306 days into the pre-election year, aligning with a historically strong TMO seasonal trend.
- Average winner gains of roughly 30% have come with meaningful swings inside the window, including double-digit drawdowns in some years.
- The TradeWave Ratio of 2.01 and Sharpe ratio of 1.82 point to strong, historically consistent upside for long trades in this stretch.
- Stacking this specific Thermo Fisher Scientific trading window across the 10-sample history would have compounded to about 1,131% cumulative return.
According to historical data from TradeWave.ai, this midterm-to-pre-election stretch has behaved very differently from an average year for Thermo Fisher Scientific, and the next iteration is about to open again.
How has Thermo Fisher Scientific (TMO) traded in this midterm-year window?
Thermo Fisher Scientific has posted gains in every one of the last 10 midterm-election-year windows running from Sep 20 through late July, averaging 29.25% returns for long positions. The stock heads toward the 2026 version of that window at $627.55, up 2.3% on Friday and sitting about 2.2% below its 52-week high of $641.43. With that backdrop, the upcoming 306-day stretch looks less like a quirky calendar stat and more like a recurring regime that has mattered for a large-cap healthcare leader.
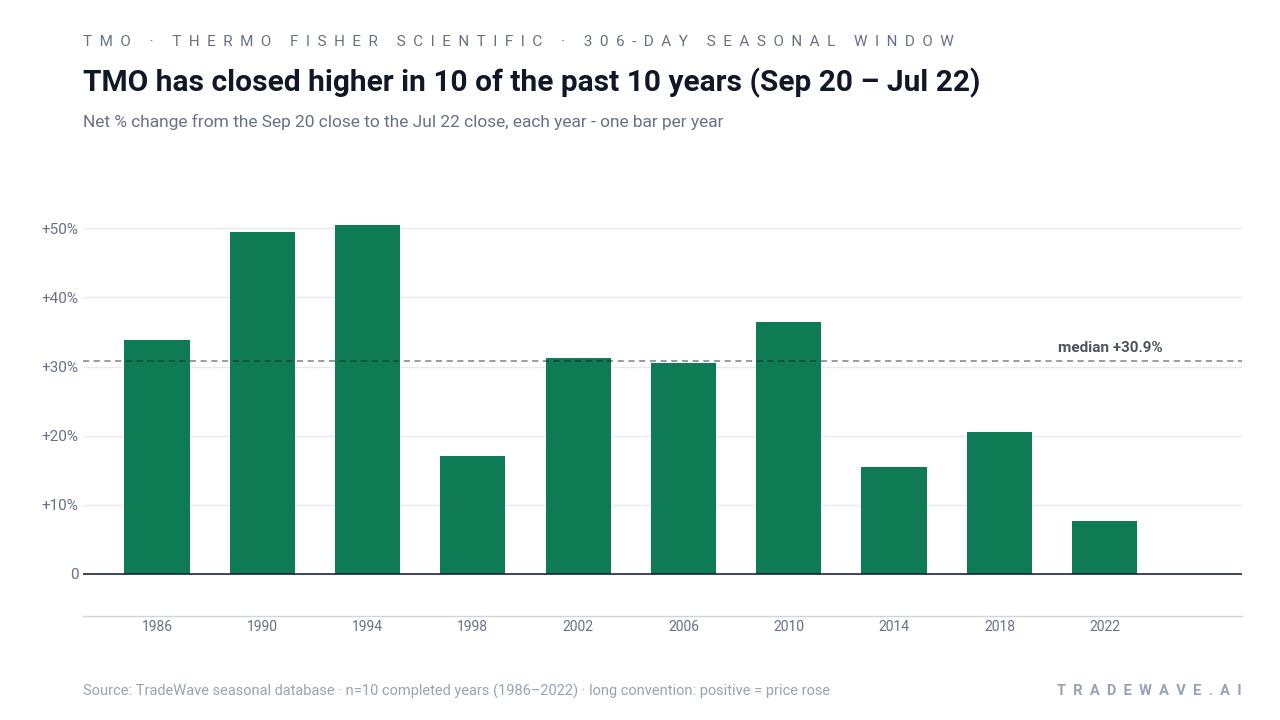
Because this pattern is grouped by the presidential election cycle, it reflects how Thermo Fisher has behaved specifically in the last 10 midterm-election years as markets transition into the year before the presidential election. That matters for a healthcare and life-sciences heavyweight that often trades with policy expectations around reimbursement, regulation and research funding.
A second view shows how much TMO has typically swung inside each of those winning windows.
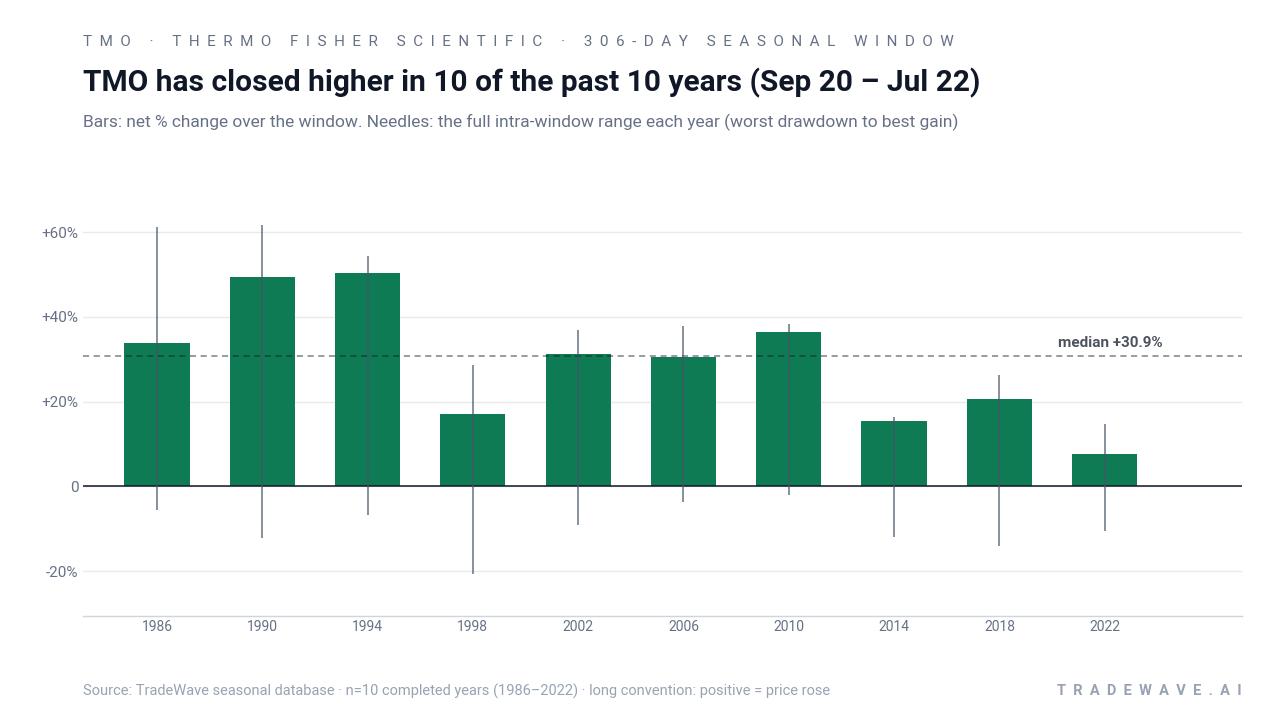
Across the 10-sample history, average gains of 29.25% for long trades came with a median profit of 30.87%, suggesting the typical year has delivered a roughly 30% climb rather than being skewed by a single outlier. The strongest year in this Thermo Fisher Scientific trading window was 1994, when the stock gained 50.43% between the Sep 20 entry and the late-July exit, while the weakest was 2022 with a still-positive 7.59% net return. Maximum favorable moves inside the window have often been larger than the final result, with peak run-ups above 60% in 1986 and 1990, while maximum adverse moves have ranged from shallow pullbacks of about 1.9% in 2010 to drawdowns of more than 20% in 1998.
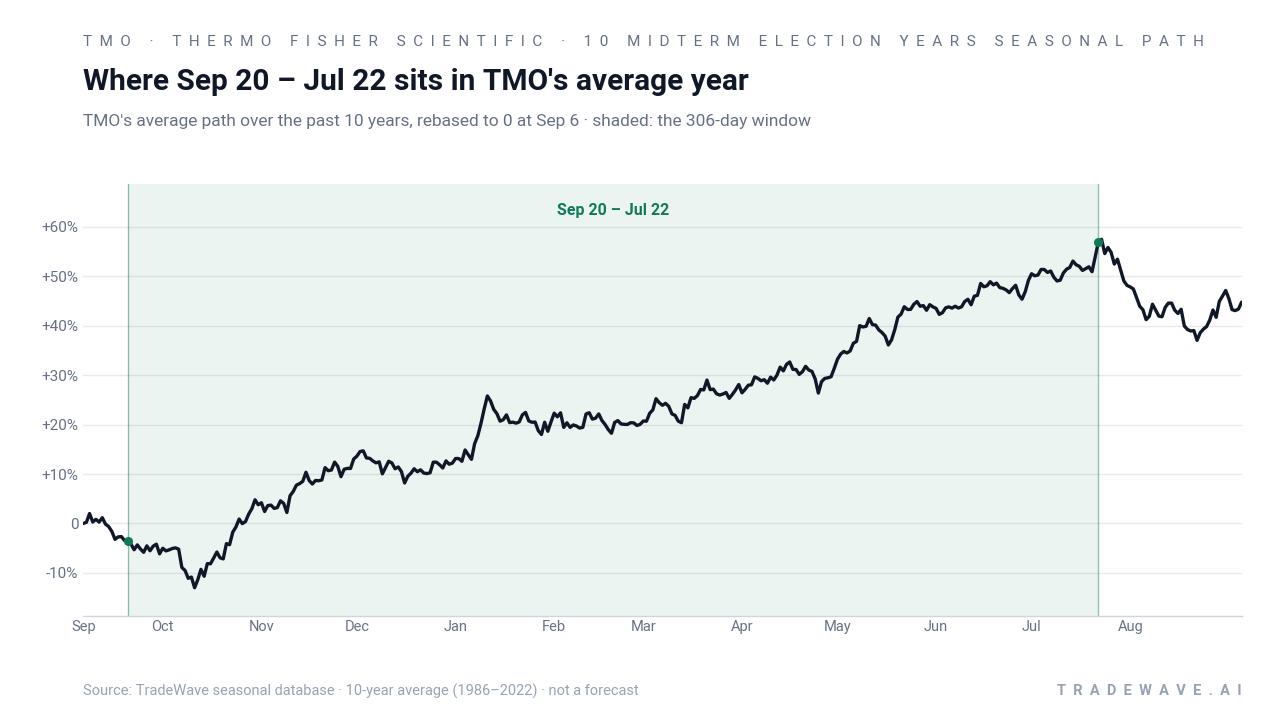
The historical seasonal average path shows TMO tending to grind higher through much of the 306-day span, with relatively few periods where the average line flattens out. That fits the election-cycle story: midterm years have often been choppy for the broader market early on, but the late-year into pre-election stretch has historically been one of the strongest parts of the four-year cycle for risk assets, and TMO’s pattern lines up with that regime. The cumulative-return chart for this window compounds those yearly gains into roughly 1,131% across the 10 completed cycles, which is what you get when a stock goes 10 for 10 with average returns near 30%.
At the same time, the bars with full-range needles make clear that this has not been a straight line. In 1998, for example, TMO finished the window up 17.06% but experienced an intraperiod drawdown of 20.63% from the entry before recovering, while 2018 saw a 20.55% gain with a 14.03% worst drawdown. That mix of strong maximum favorable excursions and sometimes deep maximum adverse excursions is what the TradeWave Ratio of 2.01 is capturing: price has typically traveled meaningfully in the long direction within the window, but it has not done so without volatility.
History does not guarantee future results; even in a 10-for-10 window, adverse excursions can be large before the trade direction ultimately wins.
Why does Thermo Fisher Scientific (TMO) follow this seasonal pattern?
One likely driver is the way Thermo Fisher’s earnings calendar and capital spending cycles line up with the policy-heavy midterm-to-pre-election stretch. Large research and clinical customers often finalize budgets and ramp orders into year-end and early in the following year, which can support revenue and sentiment across this window.[4] Analysts have also pointed to steady demand for diagnostics and life-science tools as healthcare spending grows, which can make TMO a beneficiary when risk appetite improves in the year before a presidential election.[1]
What is driving Thermo Fisher Scientific (TMO) today?
TMO closed Friday at $627.55, up 2.3% on the day, leaving the stock about 2.2% below its 52-week high of $641.43 and well above its 52-week low of $434.40. The move extends a strong run that has seen Thermo Fisher outpace many individual healthcare names even as the Healthcare Select Sector SPDR ETF has outperformed TMO over the past year, underscoring how stock-specific drivers are starting to matter more than broad sector flows.[1]
The fundamental backdrop has improved through 2026. On Jul 23, 2026, management reported 5% organic revenue growth and 13% adjusted EPS growth for the second quarter, and raised full-year adjusted EPS guidance to a range of $24.93 to $25.33, implying roughly 9% to 11% growth over 2025.[4] Earlier in the year, TMO beat Q1 adjusted EPS expectations as well, even though the stock sold off in pre-market trading after that release, a reminder that expectations and positioning can matter as much as the headline numbers.[3] The company has also been reshaping its portfolio, including an agreement to sell its microbiology business to Astorg for about $1.075 billion, which fits a longer-running strategy of focusing on higher-growth, higher-margin platforms.[2]
On the positioning side, recent filings show a mix of institutional adjustments and modest insider activity. MarketBeat reported that COO Gianluca Pettiti sold 400 shares on Jul 27, 2026 at an average price of $565, leaving him with 24,651 shares, a relatively small trim in the context of his overall stake.[6] GuruFocus and other trackers have highlighted ongoing institutional rebalancing in the name, but not the kind of concentrated buying or selling that would signal a wholesale shift in conviction.[7] Analyst coverage remains constructive, with Barchart’s aggregation showing a Strong Buy consensus rating and a blended price target around $635.08, only slightly above where the stock trades today.[1]
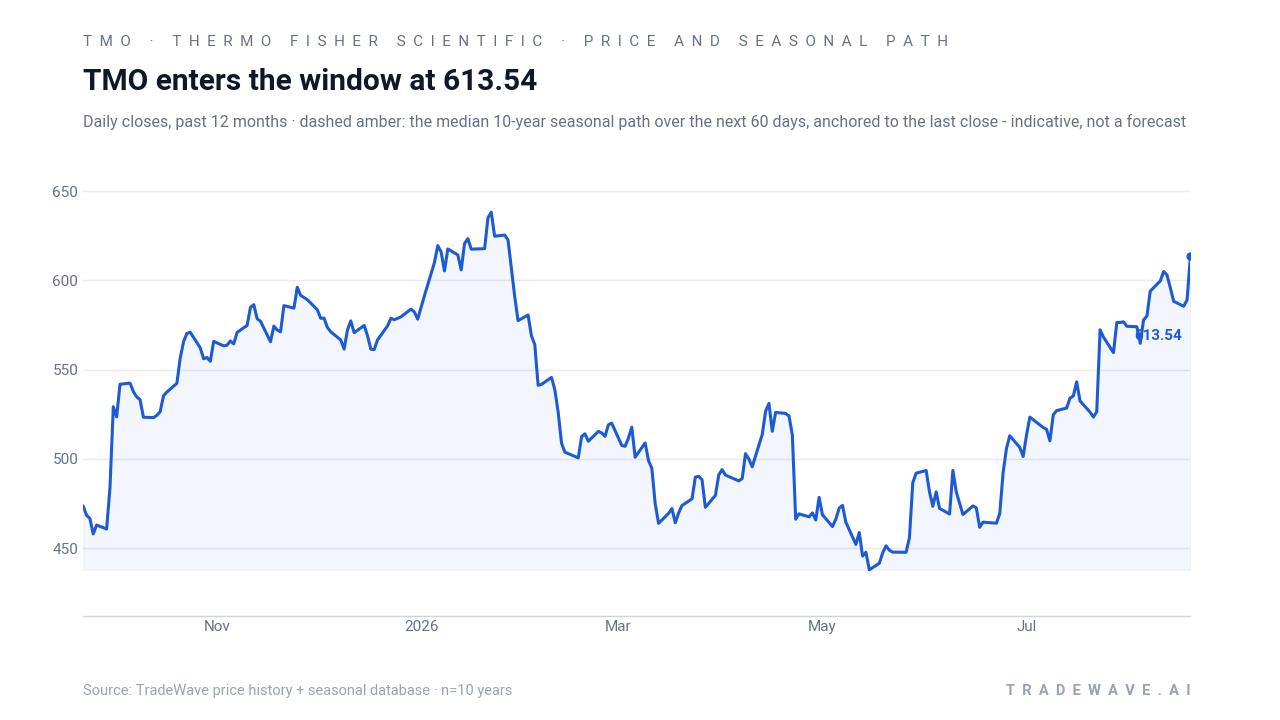
The chart below situates the latest move in its recent multi-month context alongside the median 60-day seasonal path.
What should traders watch as this Thermo Fisher Scientific (TMO) window opens?
First, the calendar: the 306-day window begins on Sep 20, 2026 and runs into late July of the pre-election year, so any sharp move around that date will be occurring inside a slice of history that has been 10 for 10 on the upside. Second, levels: with TMO only a couple of percentage points below its 52-week high, how the stock behaves around the $640 area will help show whether this cycle starts with a breakout or another consolidation. Third, earnings and guidance: the next set of results and any updates to the 2026 outlook will land inside this historically strong regime, and confirmation of mid-single-digit organic growth and high-single to low-double-digit EPS growth would align with the prior pattern of fundamental support.[4]
Finally, watch the behavior of institutional and insider flows. The recent small sale by the COO did not change the big picture, but a shift toward larger insider selling or a wave of institutional trimming would be a sign that some investors are using strength in this window to lock in gains rather than press exposure.[6] If, instead, ownership data and analyst commentary continue to lean constructive while the stock respects prior support during any drawdowns, that would be more consistent with how this midterm-year seasonal window has played out for Thermo Fisher Scientific in the past.
Sources
- Barchart - Thermo Fisher Scientific Stock: Analyst Estimates & Ratings
- Morningstar - TMO Stock Price Quote | Morningstar
- ChartMill - Thermo Fisher Scientific (NYSE:TMO) Beats Q1 Estimates But Stock Drops in Pre-Market
- The Motley Fool - TMO Q2 2026 Earnings Call Transcript | The Motley Fool
- The Motley Fool - Thermo Fisher (TMO) Q4 2024 Earnings Transcript
- MarketBeat - Groupe la Francaise Trims Stock Holdings in Thermo Fisher Scientific Inc. $TMO
- GuruFocus - Thermo Fisher Scientific Inc (TMO) Stock Up 4.9% and Still Undervalued -- GF Score: 82/100
- MarketBeat - Various institutional filings mentioning TMO (Empowered Funds, QRG Capital, Brown Shipley, SeaBridge)
- Seeking Alpha - Thermo Fisher Scientific Inc. (TMO) - Seeking Alpha
- MarketBeat (options page) - Thermo Fisher: Options Chain & Prices 2026
About this seasonal analysis
Seasonal pattern data is sourced from TradeWave.ai, which analyzes historical price behavior across annual calendar windows going back up to 30 years. Read the full data methodology or the book The 100-Year Pattern by Afshin Moshrefi (2026 edition). Past performance of seasonal patterns does not guarantee future results. This article is for informational purposes only and does not constitute investment advice.