Lennar (LEN) Faces High Mortgage Rates but Nears a Historically Bullish Oct-Jan Run
Lennar is approaching an Oct 5 seasonal window that has been unusually strong in past midterm election years, even as the stock trades near its 52-week low in a pressured housing market.
Price as of Sep 18, 2026: $76.43 (last close).

What is the seasonal pattern for Lennar (LEN)?
Lennar has risen in 9 of 10 midterm-election-year Oct 5 to Jan 8 windows, with an average gain of 18.35% in winning years.
- 9 for 10 in this window, with winning years averaging 18.35% gains and only one losing year across the sample.
- The upcoming Lennar trading window runs from Oct 5 to Jan 8, spanning 96 days in the concluding midterm election year.
- Percent Profitable is 90.0%, with 9 winners and 1 loser across the last 10 midterm election years.
- Avg Profit - All, which includes the lone losing year, is still a strong 16.1%, pointing to a robust LEN seasonal trend.
- The worst losing year saw a -4.13% decline, while several winning years posted double-digit gains, highlighting a favorable skew.
- A TradeWave Ratio of 1.93 and a Sharpe ratio of 1.37 indicate historically strong upside moves relative to volatility in this window.
According to historical data from TradeWave.ai, this upcoming stretch has behaved very differently from an average quarter for Lennar in prior midterm election years.
How has Lennar (LEN) traded in the Oct 5 to Jan 8 window?
Lennar has closed higher in 9 of the last 10 midterm-election-year windows running from Oct 5 to Jan 8, making this one of its most reliable bullish stretches on the calendar. Shares finished the prior session at 76.43, down 4.1% on the day and sitting just above a 52-week low of 75.70 while roughly 41.0% below the 52-week high of 129.63. That combination of a beaten-up starting point and a historically strong LEN seasonal pattern is why this specific fall-to-winter window stands out on traders’ screens.
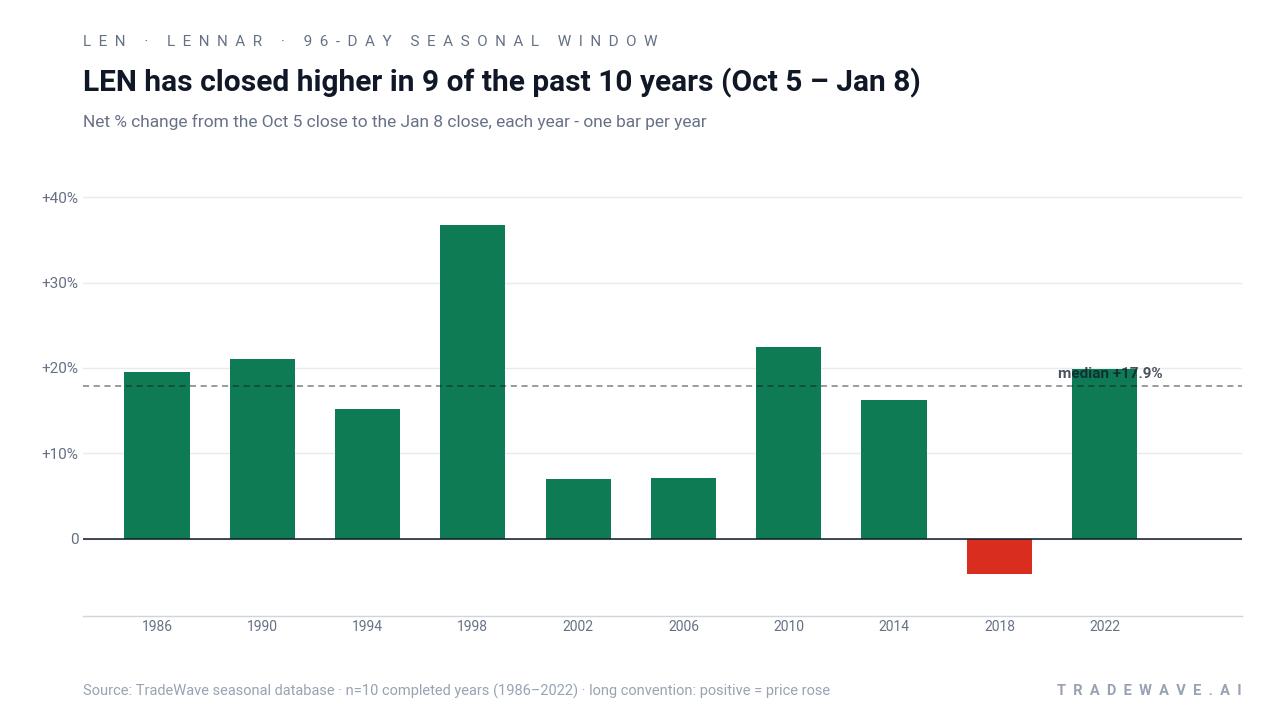
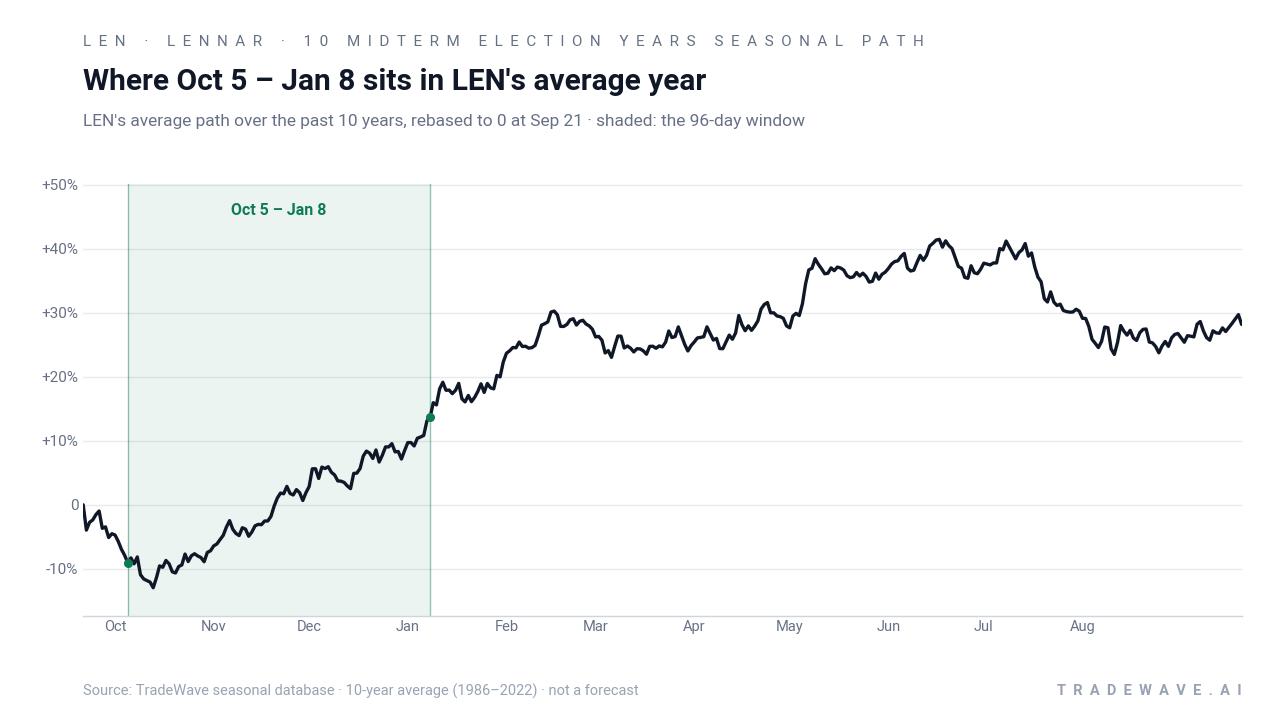
The pattern is built on the last 10 midterm election years, a phase where policy uncertainty, rate debates and fiscal wrangling often weigh on cyclicals early in the year but give way to more constructive risk appetite into the turn toward the year before the presidential election. In that context, Lennar’s Oct 5 to Jan 8 window has historically lined up with a shift from macro anxiety to clearer visibility on growth, a backdrop that has tended to favor homebuilders when mortgage and housing headlines stabilize.
Across those 10 midterm-year samples, the trade direction is explicitly long. Percent Profitable sits at 90.0%, with 9 winners and just 1 loser, so the LEN seasonal trend in this slice of the calendar has been decisively positive rather than mixed. Average profit in the winning years is 18.35%, while the all-years average, which includes the single down year, is still 16.1%, showing that the lone loss has not meaningfully diluted the overall profile.
The per-year table shows how that plays out in practice. Strong years like 1998 delivered a 36.7% net return in the window, with a maximum favorable move of 41.78% from the entry price before settling back, while 2010 and 2022 also posted gains above 19% with sizable intraperiod rallies. The weakest outcome came in 2018, when Lennar fell 4.13% over the window and at one point was down 16.65% from the entry before recovering part of the loss by Jan 8.
That intraperiod behavior is captured in the maximum favorable excursion and maximum adverse excursion statistics. In several years, the best point-to-peak move inside the window ran into the low-20% range, while the worst drawdowns from entry often sat in the high single digits to mid-teens. In other words, even in winning years, Lennar has typically experienced meaningful downside swings before finishing higher, which matters for anyone sizing risk around this homebuilder seasonal outlook.
Yearly net and intraperiod swings show how upside and drawdowns have coexisted in this window.
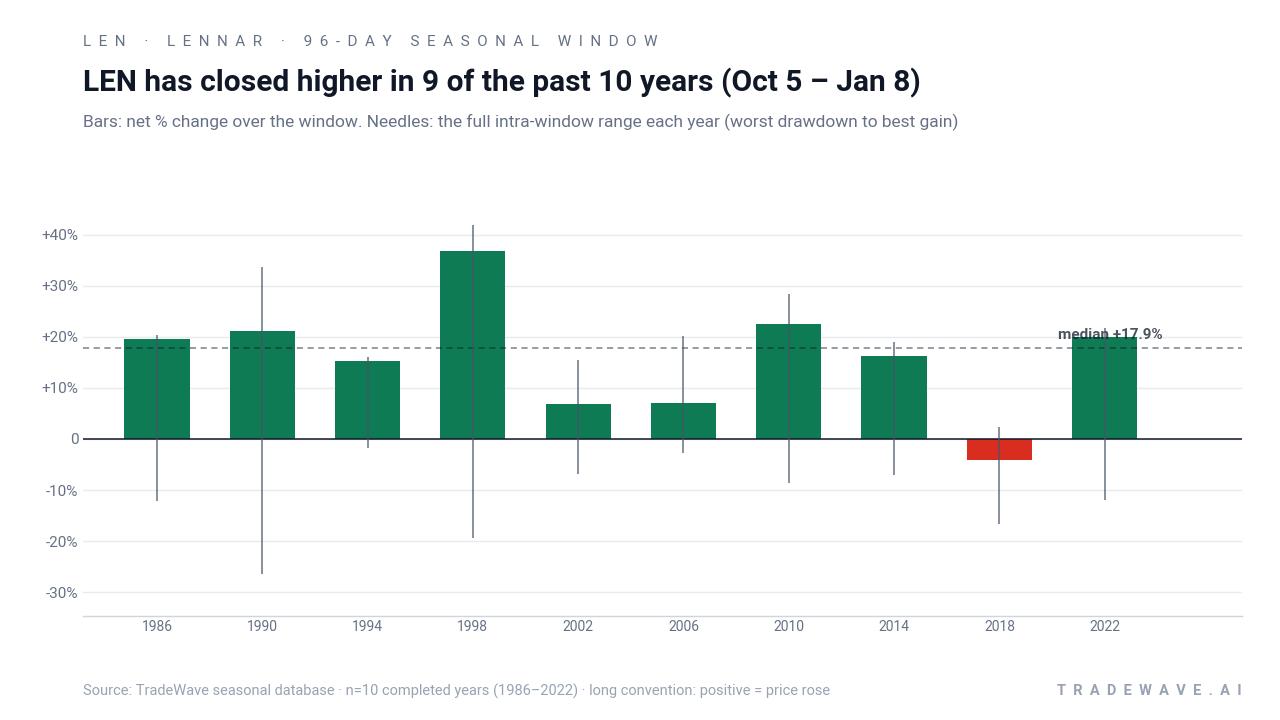
The stacked net, best-case and worst-case bars underline the point. In most years, the bar itself is positive, but the lower needle often extends well below zero, showing that Lennar has frequently dipped meaningfully before finishing the window higher. The upper needles, by contrast, cluster in the mid-teens to low-30% range, consistent with a TradeWave Ratio of 1.93 that signals substantial travel in the trade direction during this 96-day stretch.
The cumulative chart for this pattern compounds those windows into a 327.15% total return across the 10 midterm-election-year samples. Add it up and this is not a marginal edge: stacking the same Oct 5 to Jan 8 slice has historically produced a powerful contribution to long-term returns for Lennar, even though the broader homebuilding sector has seen its share of rate-driven volatility in other parts of the cycle.
History does not guarantee future results; adverse excursions can be large even in winning windows, and Lennar has previously seen double-digit drawdowns inside this pattern before recovering.
Why does Lennar (LEN) follow this seasonal pattern?
One likely driver is the way Lennar’s earnings calendar and order commentary line up with the policy and rate narrative late in midterm election years. Analysts have pointed to year-end portfolio repositioning and sector rotation into cyclicals as investors look ahead to the historically stronger year before the presidential election, which can favor homebuilders when rate expectations stabilize.[2] This pattern may also reflect consumer behavior, as fall and early winter often bring clearer visibility on next-year housing demand and incentives, giving investors more confidence to lean into beaten-up names.
What is driving Lennar (LEN) today?
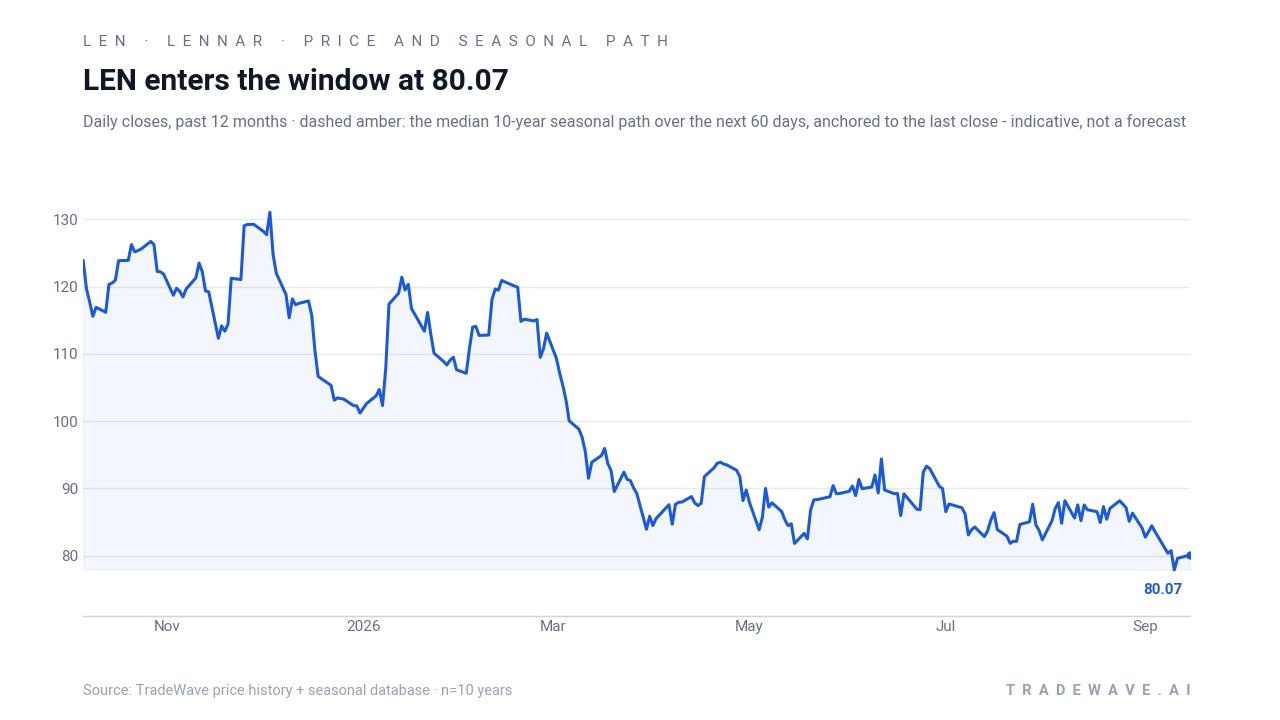
Lennar closed the latest session at 76.43, down 4.1% on the day, leaving the stock about 1.0% above its 52-week low of 75.70 and roughly 41.0% below its 52-week high of 129.63. That slide extends a one-month loss of 10.52% and comes with volume of 11.8 million shares, well above the 20-day average of about 3.9 million, as traders reassess the homebuilding sector’s outlook against a backdrop of elevated mortgage rates and affordability pressure that have been squeezing margins and demand.[2]
In Sep 2025, Lennar reported Q3 FY2025 revenue of $8.81 billion, down about 6% year over year, with net earnings per diluted share falling roughly 46% and adjusted EPS landing near $2.00, below analyst expectations, which weighed on investor confidence and highlighted how sensitive the business is to rate-driven slowdowns.[2] In Dec 2025, the company’s quarterly profit was reported at $490.2 million, or $1.93 per share, down from $1.1 billion, or $4.06 per share, a year earlier, underscoring how a stagnant housing market and higher incentives had already compressed profitability heading into this cycle.[1] Those older results still frame today’s debate: whether Lennar’s earnings power can recover as the macro backdrop evolves into the year before the presidential election.
The chart below situates the latest move in its recent multi-month context and overlays the median historical seasonal path for the next 60 days.
What should traders watch as this Lennar seasonal window approaches?
First, the calendar: the 96-day window opens on Oct 5, so any stabilization or reversal from current levels into early October will shape how much “room” Lennar has to track its historical pattern. Second, macro catalysts matter, especially mortgage-rate moves and any signs that affordability is improving or incentives are peaking for large builders like Lennar, given how prior earnings reports tied weaker profits to a stagnant housing market and higher rates.[1][2] Third, price behavior inside the window will be key: a familiar script would involve early volatility and drawdowns followed by a stronger finish, while a sustained break below the recent 52-week low that fails to recover would mark a clear departure from the historical LEN seasonal trend.
Sources
About this seasonal analysis
Seasonal pattern data is sourced from TradeWave.ai, which analyzes historical price behavior across annual calendar windows going back up to 30 years. Read the full data methodology or the book The 100-Year Pattern by Afshin Moshrefi (2026 edition). Past performance of seasonal patterns does not guarantee future results. This article is for informational purposes only and does not constitute investment advice.