Omnicom Group (OMC) Has Risen in 10 Straight Midterm Fall Windows, Averaging 11.14% Gains
Omnicom Group is approaching a historically strong 56-day fall trading window just as the stock trades below its highs and short interest builds.
Price as of Sep 16, 2026: $79.33 (last close).

What is the seasonal pattern for Omnicom Group (OMC)?
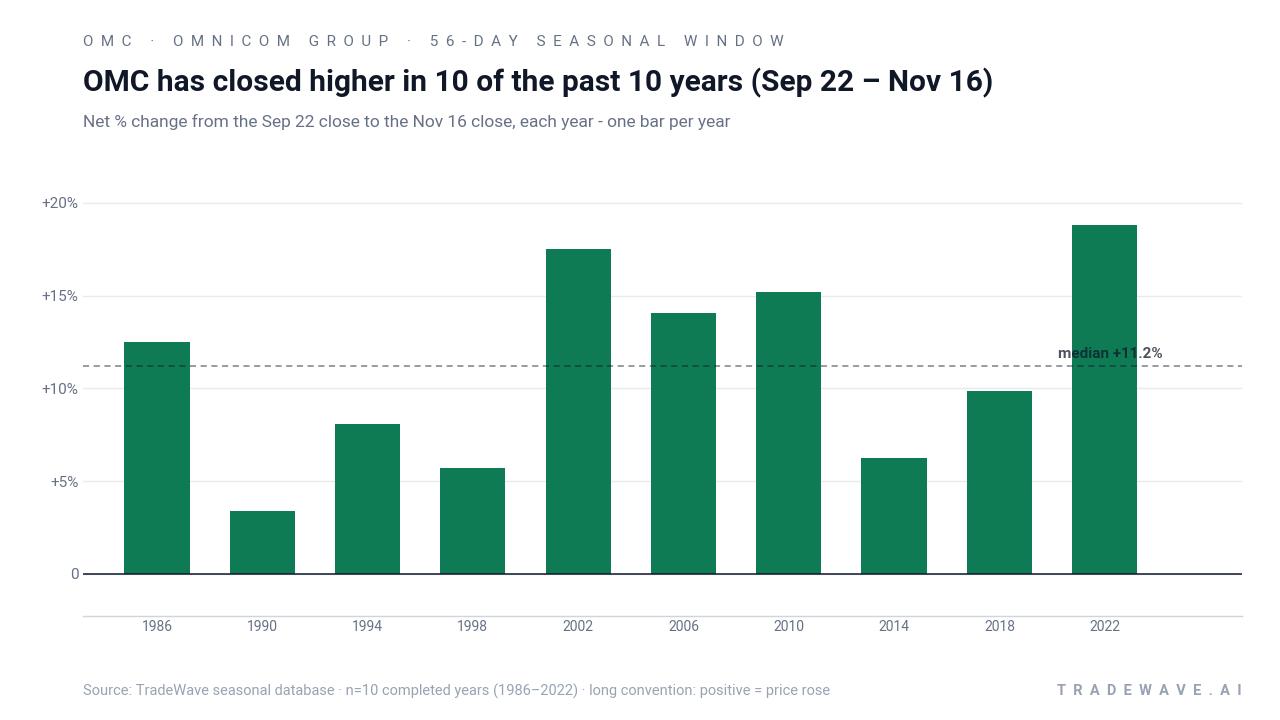
Omnicom Group has risen in 10 of 10 midterm-year fall windows from Sep 22 to Nov 16, with an average gain of 11.14% in winning years.
- 10 for 10 in this window, averaging 11.14% gains in winning years across the last 10 midterm election cycles.
- Seasonal window runs from Sep 22 through Nov 16, spanning 56 calendar days in the concluding midterm election year.
- Percent Profitable is 100.0%, with 10 winners and 0 losers for the long trade direction.
- Average profit of 11.14% reflects all years in the sample, since every window finished positive.
- TradeWave Ratio (TWR) of 1.93 signals that price has typically traveled meaningfully in the trade direction within the window.
- Sharpe ratio of 2.0 points to a historically strong risk‑adjusted profile for this specific Omnicom Group trading window.
According to historical data from TradeWave.ai, this late‑September to mid‑November stretch has behaved very differently from an average autumn for Omnicom Group. The next section walks through how that election‑cycle pattern has played out in prior midterm years.
How has Omnicom Group (OMC) traded in the late‑September midterm window?
Omnicom Group has finished higher in every single Sep 22 to Nov 16 midterm‑year window across the last 10 cycles, averaging 11.14% gains for long positions. The stock closed Thursday at 79.33, down 0.7% on the day and about 11.5% below its 52‑week high of 89.56, with shares modestly negative year to date at -1.11%.[3] Short interest has climbed to roughly 9.86% of float as of late August, with MarketBeat flagging an increase to 26.7 million shares sold short as of Aug 31, 2026, which could add fuel if the seasonal pattern pulls in buyers against crowded bearish positioning.[4]
Because this pattern is grouped by the presidential election cycle, it reflects how Omnicom tends to trade in the final stretch of midterm election years, just before markets transition into the historically stronger “year before the presidential election” phase. In other words, the Sep 22 to Nov 16 window sits at the handoff between a policy‑heavy midterm backdrop and the pre‑election year, when risk appetite has often improved across cyclicals and advertising names.
Across the 10 completed midterm‑year samples from 1986 through 2022, the long trade direction has been unambiguously favored. Percent Profitable is 100.0%, with 10 winners and 0 losers, and the average profit of 11.14% matches the all‑years average because there were no losing windows. Median profit of 11.2% sits close to the mean, which suggests the gains have been relatively clustered rather than driven by a single outlier year.
The per‑year table shows how that plays out in individual cycles. The weakest net outcome was 3.41% in 1990, while the strongest was 18.79% in 2022, when Omnicom rallied from an entry level of 57.52 to 68.33 over the 56 days. Several other cycles, including 2002, 2006 and 2010, posted double‑digit percentage gains, reinforcing the bullish historical seasonality in this specific Omnicom Group trading window.
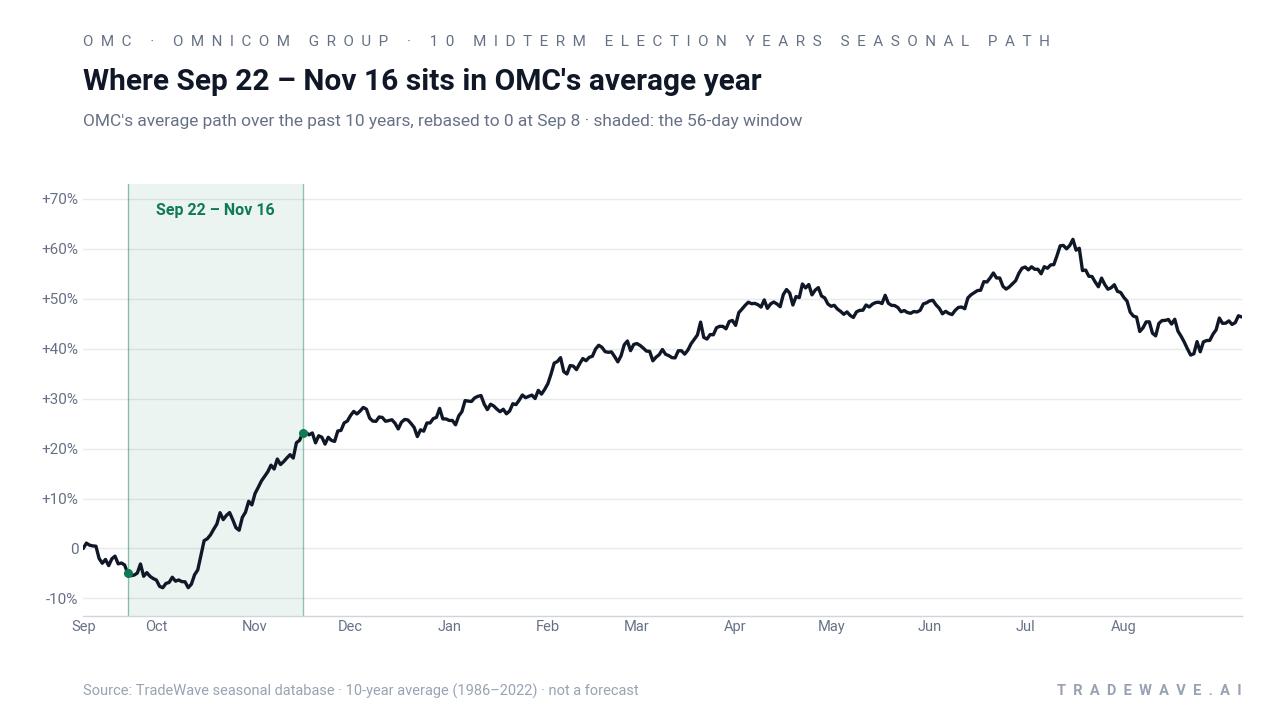
The historical seasonal average chart indicates that, on a typical path, Omnicom has tended to firm into late September and then grind higher through October and early November. The shaded 56‑day window often captures the heart of that climb, with the average curve tilting upward rather than choppy, which aligns with the strong win‑loss record for long exposure.
A second view combines yearly net results with the full intraperiod range of gains and drawdowns.
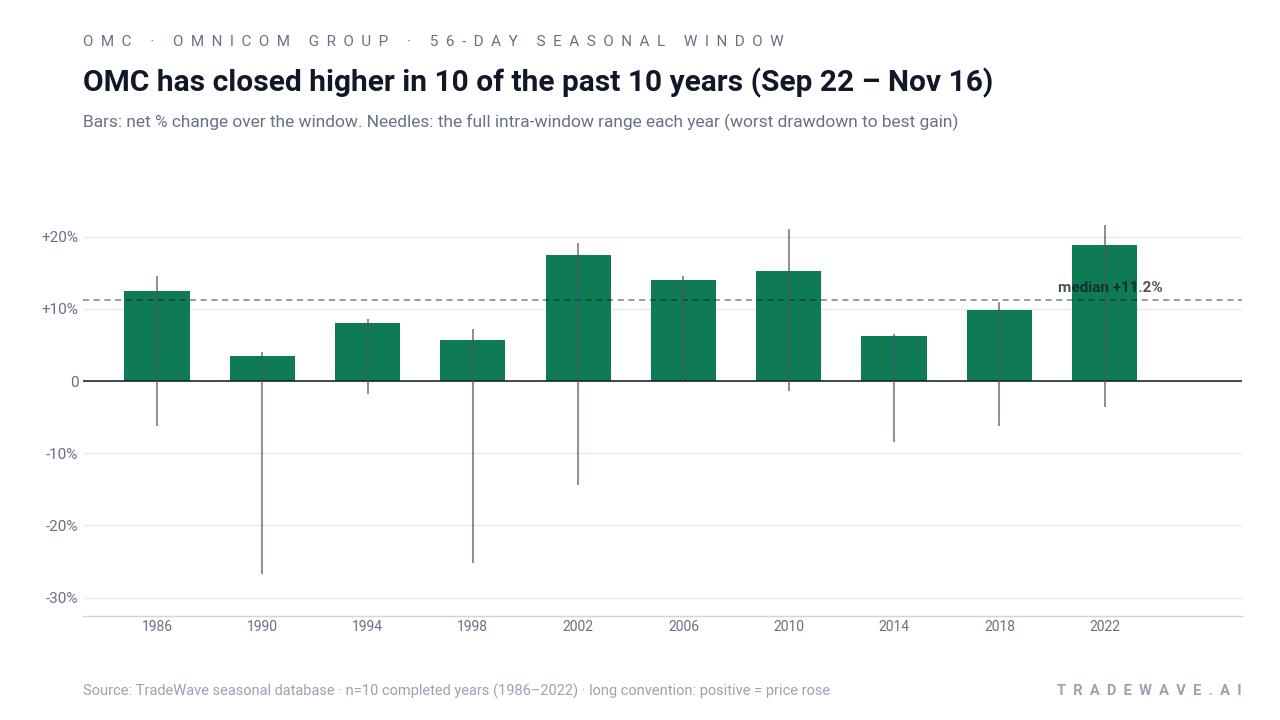
The combined net / maximum favorable move / maximum adverse move view shows why this pattern has appealed to active traders. In strong years like 2010 and 2022, maximum favorable excursions reached above 20%, while maximum adverse moves were contained to single‑digit drawdowns. In more volatile cycles such as 1990 and 1998, Omnicom still finished positive, but the worst intraperiod drawdowns stretched to roughly -26.71% and -25.16% respectively, underscoring that even a 100% win rate has come with sizable swings along the way.
History does not guarantee future results; adverse excursions can be large even in winning windows, and traders should size positions with that intraperiod risk in mind.
Why does Omnicom Group (OMC) follow this seasonal pattern?
One likely driver is the clustering of Omnicom’s earnings and guidance updates around the end of the third quarter, when advertisers finalize budgets for the holiday season and the coming year.[2] That timing often coincides with portfolio repositioning in the broader market as investors shift from midterm election uncertainty toward the historically stronger year‑before‑the‑presidential‑election phase. For an advertising and marketing services group tied to corporate spending plans, that combination of earnings visibility and improving risk appetite may help explain why this late‑September window has repeatedly favored the long side.
What is driving Omnicom Group (OMC) today?
Omnicom shares closed Thursday at 79.33, off 0.52 on the day, leaving the stock down 6.56% over the past month and about 11.5% below the 52‑week high of 89.56, while still sitting above the 52‑week low of 66.33.[3] The stock also trades below its 50‑day moving average of 83.19 and has seen volume of roughly 2.07 million shares, a touch below its 20‑day average of 2.27 million, as investors weigh a fresh dividend and the next earnings update.[3]
On Sep 18, 2026, Omnicom is scheduled to go ex‑dividend on a cash payout of $0.80 per share, a level that keeps the yield profile in focus for income‑oriented holders.[1] The next major fundamental catalyst is the Sep 2026 quarter, where analysts are looking for earnings per share of $2.56, following a June quarter that delivered $6.56 billion in revenue and $584.8 million in earnings, for an 8.91% profit margin.[1] In early September, Barron’s data showed Omnicom trading on a modest earnings multiple with a steady dividend, while Markets Insider and other aggregators continued to flag a Buy‑leaning analyst consensus rather than a high‑growth story.[2][3]
Positioning has become more interesting into this setup. MarketBeat reports that short interest rose in August, with 26,725,825 shares sold short as of Aug 31, 2026, representing roughly 9.86% of the float.[4] GuruFocus notes that over the past 12 months insiders have sold about $0.2 million of stock with no reported insider buys, a small but directionally cautious signal that contrasts with the stock’s long‑term seasonal strength.[5] Add it up and Omnicom is heading into its historically strong midterm‑year fall window with a mix of income support, moderate valuation, and a non‑trivial short base that could either press the downside or be forced to cover if the usual pattern reasserts itself.
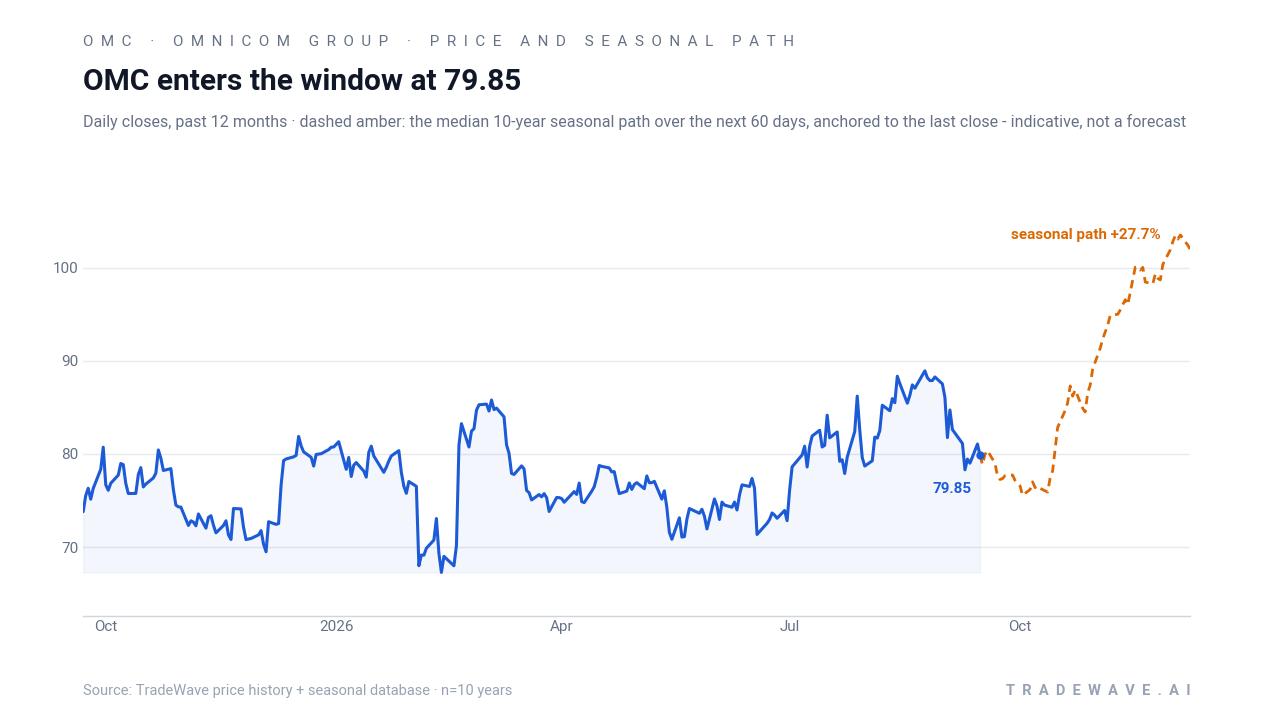
The chart below situates the latest pullback against the past year’s trading range and the median seasonal path for the coming weeks.
What should traders watch in this Omnicom Group (OMC) window?
First, the calendar: the 56‑day window opens on Sep 22 and runs through Nov 16, overlapping Omnicom’s Sep‑quarter earnings release and the heart of the U.S. policy calendar as the midterm election year wraps up.[1][2] How the stock behaves around earnings relative to its historical midterm‑year pattern will be an early tell on whether this cycle tracks the prior 10 for 10 record or diverges.
Second, price levels matter. On the upside, traders will be watching whether Omnicom can reclaim the 50‑day moving average near 83 and then challenge the 52‑week high around 89.56 during the window.[3] On the downside, any break back toward the mid‑60s 52‑week low would run counter to the historical seasonality and signal that macro or company‑specific pressures are overwhelming the usual fall strength.
Third, positioning and short interest deserve close monitoring. With roughly 9.86% of the float sold short and August’s short interest rising, follow‑through in bearish bets or a sharp reversal in those positions could amplify moves in either direction during the window.[4] If the stock starts to track its typical midterm‑year seasonal trend higher, a reduction in short interest or signs of covering would confirm that the historical pattern is again exerting pressure on crowded shorts. If short interest continues to build while price lags, that would be a clear sign that this cycle is breaking from the 10‑for‑10 script.
Finally, watch the broader advertising and marketing services sector tone. Omnicom’s seasonal window sits at the intersection of year‑end ad budget decisions and a shift from midterm election uncertainty toward the year before the presidential election, a phase that has often been friendlier to cyclical risk.[2][3] If sector peers respond well to macro data and corporate spending commentary through October, it would add another tailwind to a window that has already delivered 184.56% cumulative gains across the past 10 midterm cycles.
Sources
- Yahoo Finance - Omnicom Group Inc. (OMC) Analyst Ratings, Estimates & Forecasts - Yahoo Finance
- Markets Insider (Business Insider) - Omnicom Group Stock Price | OMC Stock Quote, News, and History | Markets Insider
- Barron's - Omnicom Group Inc. Stock Overview (U.S.: NYSE) | Barron's
- MarketBeat - Omnicom Group (OMC) Short Interest & Short Float | Updated Sep 2026
- GuruFocus - A Look at Omnicom Group Inc (OMC) After 5.0% Decline -- GF Value $94.14 vs Price $81.76
About this seasonal analysis
Seasonal pattern data is sourced from TradeWave.ai, which analyzes historical price behavior across annual calendar windows going back up to 30 years. Read the full data methodology or the book The 100-Year Pattern by Afshin Moshrefi (2026 edition). Past performance of seasonal patterns does not guarantee future results. This article is for informational purposes only and does not constitute investment advice.