Lennar (LEN) Has Rallied in 9 of 10 Midterm Fall Windows, Averaging 18.35% Gains
Lennar is heading into an October-to-January stretch that has been unusually strong in past midterm election years, even as the stock trades well below its 52-week high in a fragile housing cycle.
Price as of Sep 16, 2026: $78.36 (last close).

What is the seasonal pattern for Lennar (LEN)?
Lennar has risen in 9 of 10 years during this Oct 5 to Jan 8 midterm-year window, with an average gain of 18.35% in winning years.
- 9 for 10 in this window, with winning years averaging 18.35% gains and only one losing year across the sample.
- Seasonal window runs from Oct 5 through Jan 8, spanning 96 days in the last 10 midterm election years.
- Percent Profitable is 90.0%, with 9 winners and 1 loser for the long trade setup.
- Including all years, the average outcome is a 16.1% gain, reflecting relatively modest losses in the lone down year.
- The strongest year in the sample delivered a 36.7% net return, while the weakest year lost 4.13% with a drawdown of 16.65% inside the window.
- TradeWave Ratio of 1.93 and a Sharpe ratio of 1.37 point to historically strong, risk-adjusted upside in this specific Lennar trading window.
According to historical data from TradeWave.ai, this upcoming stretch has behaved very differently from an average quarter for Lennar, especially in midterm election years.
How strong is Lennar (LEN) in the Oct 5 to Jan 8 midterm-year window?
Lennar has rallied in 9 of the last 10 midterm election years during the Oct 5 to Jan 8 window, with gains in winning years averaging 18.35%. The stock finished the prior session at 78.36, down 2.1% on the day and about 41.5% below its 52-week high of 133.99, even as it sits just above a 52-week low of 76.63. That combination of a historically strong fall-to-winter seasonal pattern and a stock trading near the bottom of its one-year range gives this year’s setup unusual tension for homebuilding bulls and bears alike.
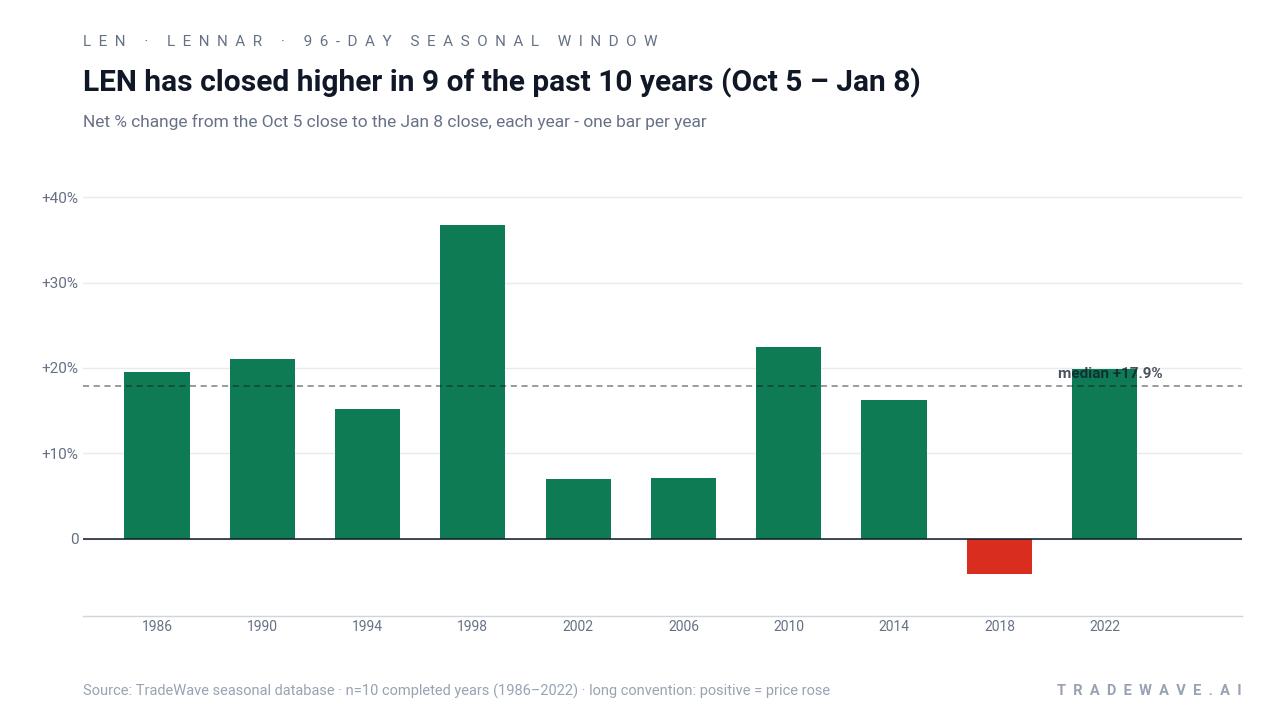
The pattern is built on the last 10 midterm election years, a phase when policy uncertainty, rate debates and fiscal wrangling often hit housing and construction stocks hardest. Grouping by the presidential election cycle matters here because midterm years tend to feature tighter financial conditions and more volatile risk appetite, so a window that has still delivered consistent gains for Lennar stands out.
Historically, the trade direction for this window is long. Percent Profitable sits at 90.0%, with 9 winners and just 1 loser, so the LEN seasonal trend in this slice of the calendar has leaned clearly bullish rather than mixed. The average profit in winning years is 18.35%, while the all-years average, including the lone down year, is still a hefty 16.1%, which means the losing outcome has been relatively contained compared with the upside in the winners.
The per-year table shows how wide the range can be. The strongest year in the sample, 1998, posted a 36.7% net return with a maximum favorable move of 41.78% and a worst drawdown of 19.32% inside the window. The weakest year, 2018, lost 4.13% even though it briefly traded up 2.3% before sliding to a 16.65% adverse excursion, a reminder that even in a strong seasonal window, timing and intraperiod swings matter.
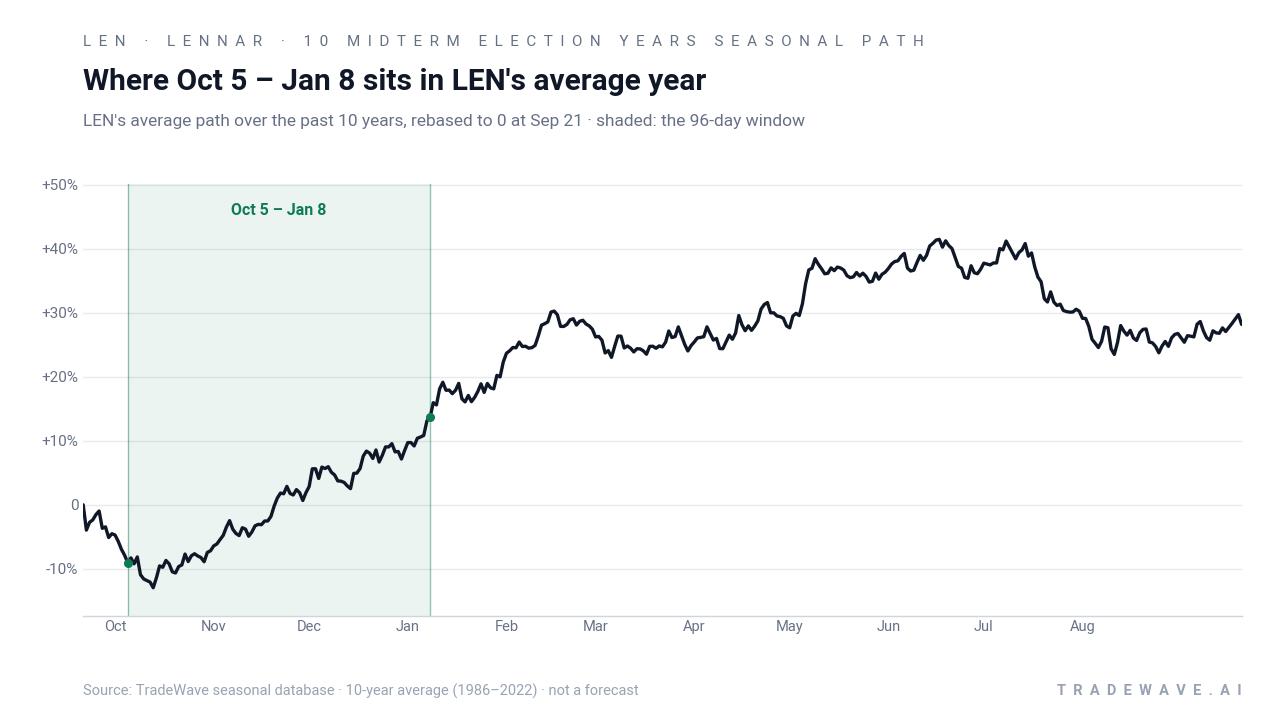
The next chart shows how each year’s net result lines up with its best and worst intraperiod swings.
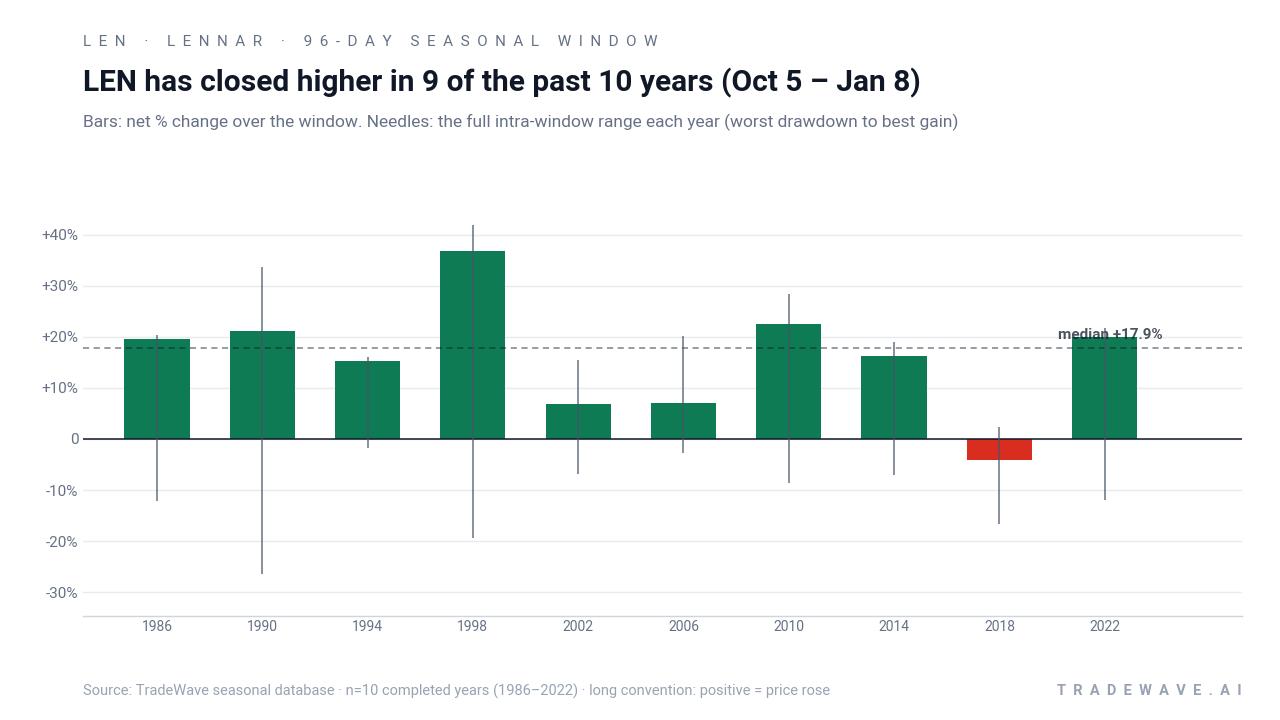
The stacked net, best-case and worst-case bars show a clear pattern: in most years, Lennar has pushed meaningfully higher at some point in the window, with maximum favorable excursions often north of 15%, while maximum adverse moves have typically stayed in the single digits but occasionally stretched into the mid-teens. That mix of strong upside potential and manageable, though sometimes sharp, drawdowns is what drives the 1.93 TradeWave Ratio and a 1.37 Sharpe ratio for this setup. Add it up: across the 10 midterm-year samples, repeatedly owning this 96-day slice would have compounded to a 327.15% cumulative gain.
History does not guarantee future results; adverse excursions (MAE) can be large even in winning windows.
Why does Lennar (LEN) follow this seasonal pattern?
One likely driver is the way Lennar’s earnings calendar and order commentary cluster around the late-year period, when investors get clearer visibility into next year’s housing demand and margins. Midterm election years also tend to feature shifting expectations for fiscal policy, rates and regulation, which can spark sector rotation into or out of homebuilders as the policy outlook firms up. This Oct 5 to Jan 8 window may capture a recurring combination of year-end positioning, improving visibility on the spring selling season and relief when policy risk peaks earlier in the year.
What is driving Lennar (LEN) today?
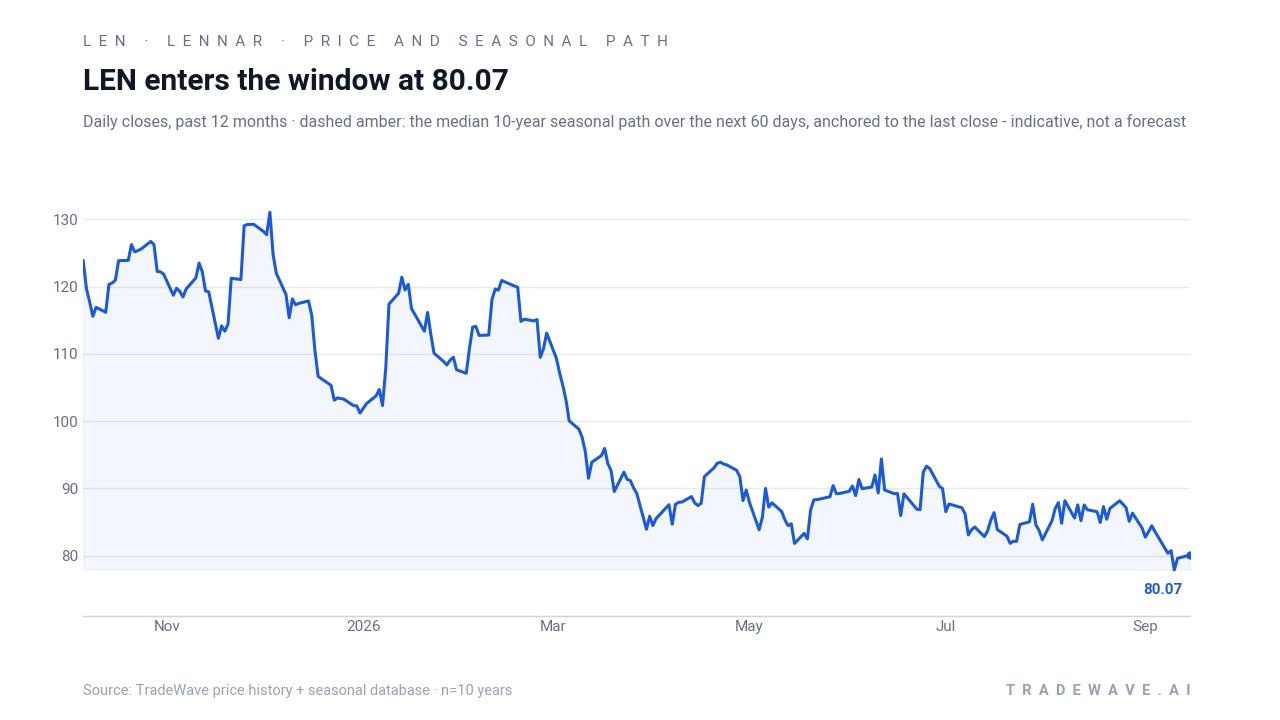
Lennar closed at 78.36 in the prior session, down 2.1% on the day and roughly 16.0% lower year to date, leaving the stock about 41.5% below its 52-week high and only a few dollars above its 52-week low.[2][4] The pullback comes after a stretch of choppy trading for homebuilders as investors weigh weaker near-term housing demand against a longer-term story of underbuilding and affordability pressure that could support volumes once rates stabilize.[2][9]
On Jun 11, Lennar reported quarterly earnings of $1.31 per share, topping consensus estimates of $1.24, on revenue of $7.94 billion that came in slightly below expectations, with net margin at 4.93% and return on equity at 7.08%.[1][3] Revenue fell 5.2% from a year earlier, reinforcing the narrative of a cyclical reset in housing rather than a straight-line growth story, and analysts have kept a cautious stance with a consensus “Reduce” rating and a MarketBeat-aggregated price target around 91.33 that sits above the current share price but reflects a more conservative regime than the stock’s prior highs.[3][5][6][7]
Macro commentary around the sector continues to focus on affordability, mortgage rates and the supply of new homes, with several analyses describing a backdrop where near-term demand is soft but structural underbuilding supports the longer-term case for large builders like Lennar.[2][9] Within that homebuilding and construction group, Lennar’s scale, land position and balance sheet give it leverage to any improvement in demand, but also leave it exposed when investors rotate away from cyclical housing exposure in response to rate or policy headlines.[2][5]
The chart below situates the latest move in its recent multi-month context alongside the median seasonal path.
What should traders watch as Lennar (LEN) approaches this window?
First, the calendar: the 96-day window opens on Oct 5 and runs through Jan 8, so any shift in price behavior as that date approaches will be watched against the backdrop of a 9-for-10 historical record. A firming tape into the start of the window, especially if Lennar can hold above the mid-70s and reclaim its 50-day moving average, would be more in line with the historical pattern than a fresh breakdown toward or below the 52-week low.[2][4]
Second, the policy and macro calendar matters. As the midterm election year concludes and markets start to discount the year before the presidential election, traders will be watching for any change in rate expectations, housing data or fiscal headlines that could either reinforce or undercut the typical late-year strength in homebuilders. Stronger-than-feared housing starts, better order commentary from peers or a plateau in mortgage rates could all help the seasonal tendency express itself, while renewed rate volatility or negative housing surprises would test it.
Finally, watch how Lennar trades around sector news and any company-specific updates. If the stock begins to show higher lows and stronger reactions to positive housing or rate headlines as the window opens, that would echo the historical pattern of sizable maximum favorable moves within the period. On the other hand, if rallies keep failing quickly and intraperiod drawdowns deepen, it would look more like the 2018 outlier year in the sample, when the window ultimately finished in the red despite an early uptick.
Sources
- MarketBeat - Lennar (NYSE:LEN) Releases Quarterly Earnings Results
- Seeking Alpha - Lennar Corporation (LEN) Stock Price, Quote, News & Analysis
- MarketBeat - Lennar Corporation (NYSE:LEN) Receives Consensus Rating of "Reduce" from Analysts
- MarketBeat - Lennar (LEN) Stock Chart and Price History 2026
- MarketBeat - Lennar (LEN) Stock Price, News & Analysis - MarketBeat
- GuruFocus - Lennar (LEN): Wells Fargo Lowers Price Target to $90 | LEN Stock
- MarketBeat - Bank of America Lowers Lennar (NYSE:LEN) Price Target to $70.00
- Lennar Investor Relations (PDF) - Lennar Corporation - 10-K / Earnings Release Document
- Yahoo Finance - Is Lennar (LEN) Offering An Opportunity After Recent Share Price Weakness?
About this seasonal analysis
Seasonal pattern data is sourced from TradeWave.ai, which analyzes historical price behavior across annual calendar windows going back up to 30 years. Read the full data methodology or the book The 100-Year Pattern by Afshin Moshrefi (2026 edition). Past performance of seasonal patterns does not guarantee future results. This article is for informational purposes only and does not constitute investment advice.