10-for-10 Midterm Run: Altria (MO) Has Gained Every Sep 27-Oct 26 Window, Averaging 7.05%
Altria is heading into a late-September trading window that has quietly delivered gains in every midterm year in the sample, just as the stock climbs in 2026 with a rich dividend story and fresh insider buying in the background.
Price as of Sep 16, 2026: $70.10 (last close).

What is the seasonal pattern for Altria (MO)?
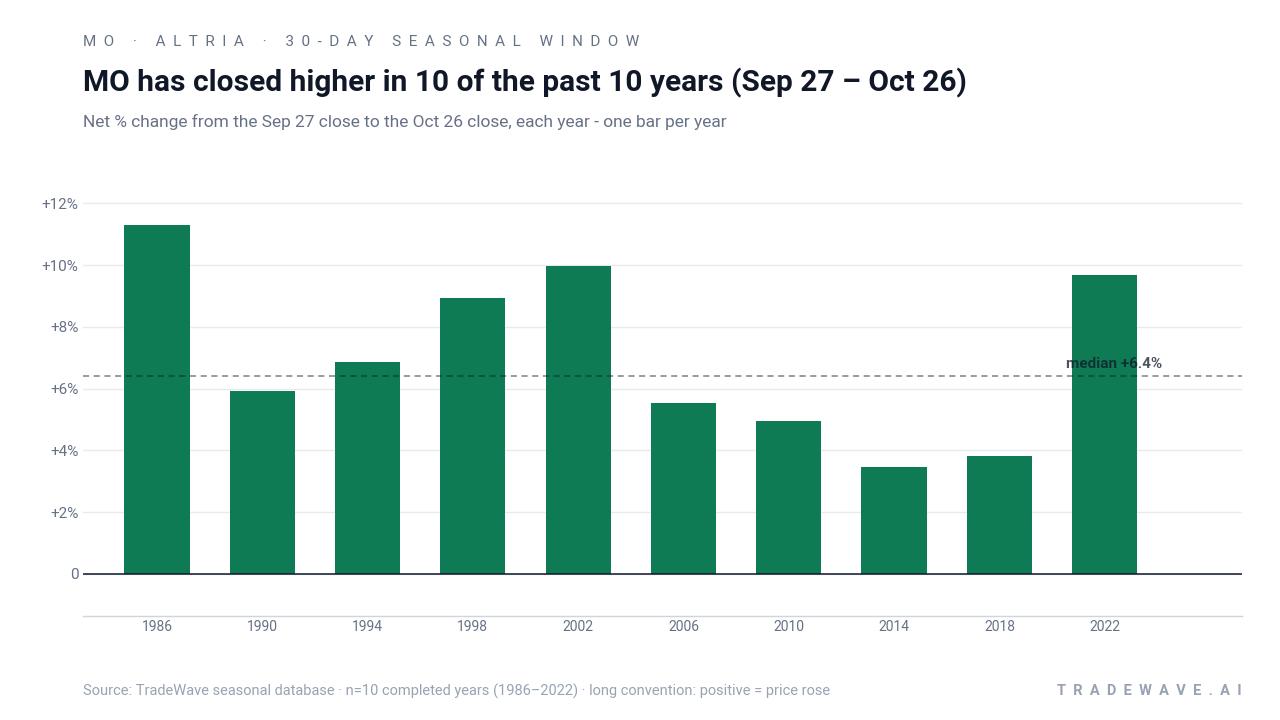
Altria has risen in 10 of 10 midterm-year Sep 27 to Oct 26 windows, with an average gain of 7.05% in winning years.
- 10 for 10 record: Altria has finished higher in all 10 midterm election years during the Sep 27 to Oct 26 window, averaging 7.05% gains.
- High win rate: Percent Profitable is 100.0%, with 10 winners and 0 losers across the lookback sample.
- Strong risk‑adjusted profile: The window shows a Sharpe ratio of 2.44 and a TradeWave Ratio of 2.27, pointing to historically favorable upside versus volatility.
- Election‑cycle angle: The pattern is built on the last 10 midterm election years, a phase that often precedes stronger pre‑election risk appetite.
- Drawdown behavior: Even in winning years, individual windows have seen adverse moves of several percentage points before recovering, so the path has not been a straight line.
- Context for 2026: The next iteration of this Altria trading window begins Sep 27, 2026 and runs for 30 calendar days into the heart of earnings season.
According to historical data from TradeWave.ai, this upcoming stretch has behaved very differently from an average month on the calendar for Altria, and the next iteration is just days away.
How has Altria (MO) traded in the late‑September midterm window?
Altria has risen in 10 of the last 10 midterm election years during the Sep 27 to Oct 26 window, averaging 7.05% gains with no losing samples. The stock heads toward this 30‑day stretch at about $70.10, up 21.57% year to date and trading with solid momentum in 2026. That combination of a clean historical win streak and a strong current trend makes this specific Altria trading window hard for seasonal traders to ignore.
Grouping the data by the presidential election cycle matters here because this window sits at the end of a midterm election year, just before the year before the presidential election when risk appetite has often improved across U.S. equities. For a defensive, dividend‑heavy name like Altria, that backdrop has historically lined up with steady inflows from income‑focused investors and portfolio rebalancing into consumer staples.
The Trade Direction for this pattern is long, and the historical record lines up cleanly with that bias. Percent Profitable is 100.0%, with 10 winners and 0 losers, and the average gain across all years in the sample is 7.05%. Median profit of 6.4% shows that the typical outcome has been a mid‑single‑digit advance, with a few stronger years pulling the average higher.
Looking at individual years, the strongest midterm window in the sample came in 2002, when Altria gained 9.99% between Sep 27 and Oct 26, after reaching a maximum favorable move of 16.46% at the best point in the window. The softest outcome was 3.47% in 2014, which still finished positive but saw a worst intraperiod drawdown of 3.15% before recovering. That spread shows how the same calendar slice can deliver very different paths even when the final result is green.
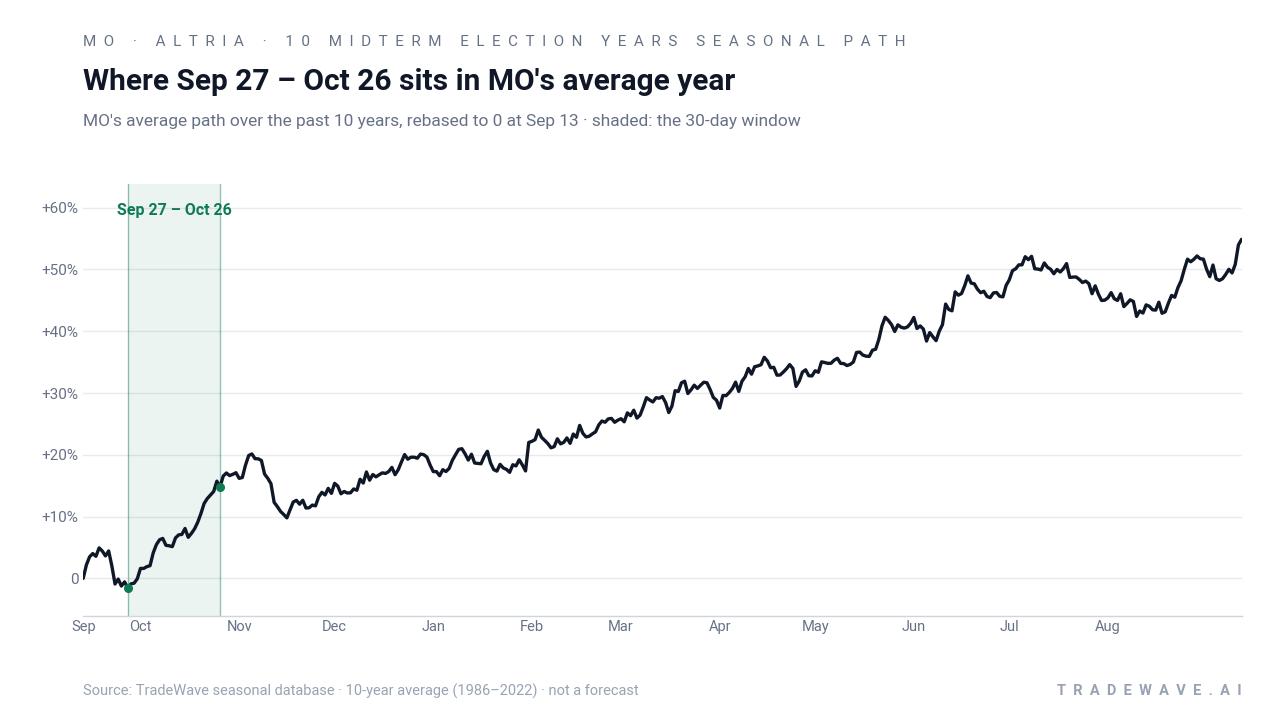
Year‑by‑year ranges show how much Altria has typically swung inside this window before settling at a higher close.
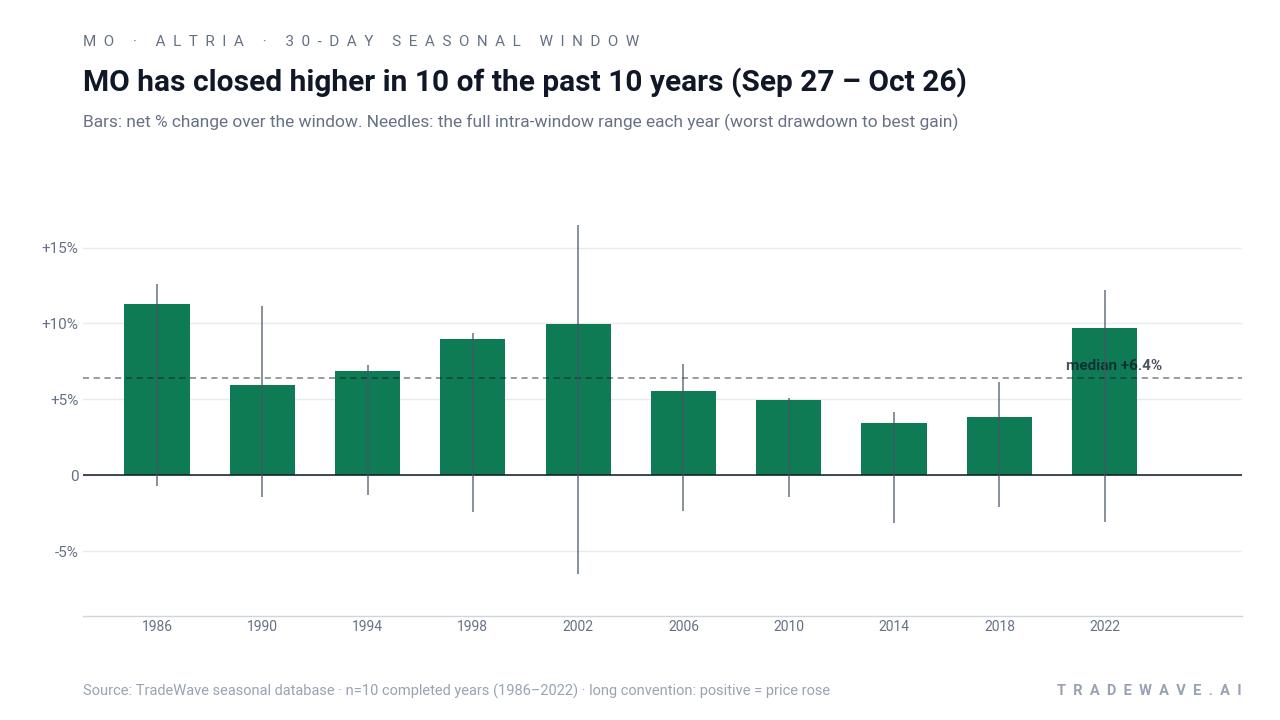
The maximum favorable move, or best intraperiod run‑up, has often been meaningfully larger than the final net gain, which is what the TradeWave Ratio of 2.27 is flagging. In 2002, for example, the stock was up more than 16% at one point before giving back part of the move into the close of the window, while in 1990 the best gain reached 11.13% against a final 5.92% advance. On the downside, maximum adverse excursions have ranged from less than 1% in 1986 to about 6.5% in 2002, showing that even winning windows can involve uncomfortable drawdowns before the pattern plays out.
The cumulative chart of this midterm‑year slice tells the same story in a different way. Stacking the Sep 27 to Oct 26 window across the 10 historical samples compounds to a 97.03% cumulative return, with no multi‑year flat spots or deep setbacks. Add it up: a trader who only held Altria during this 30‑day window in each of those midterm years would have nearly doubled their capital from this slice alone, before dividends.
History does not guarantee future results; adverse excursions can still be large inside the window even when the final outcome has been positive in past years.
Why does Altria (MO) follow this seasonal pattern?
One likely driver is the way the presidential election cycle shapes risk appetite, with investors often rotating back into steady dividend payers like Altria as midterm uncertainty fades and the year before the presidential election approaches. Analysts have also pointed to portfolio rebalancing around early‑Q4 earnings season, when income‑oriented funds top up high‑yield consumer staples positions after summer volatility.[5] The pattern may also reflect how tobacco regulation headlines and tax debates tend to cluster earlier in the year, leaving this late‑September stretch relatively clear for fundamentals and yield to dominate the narrative.
What is driving Altria (MO) today?
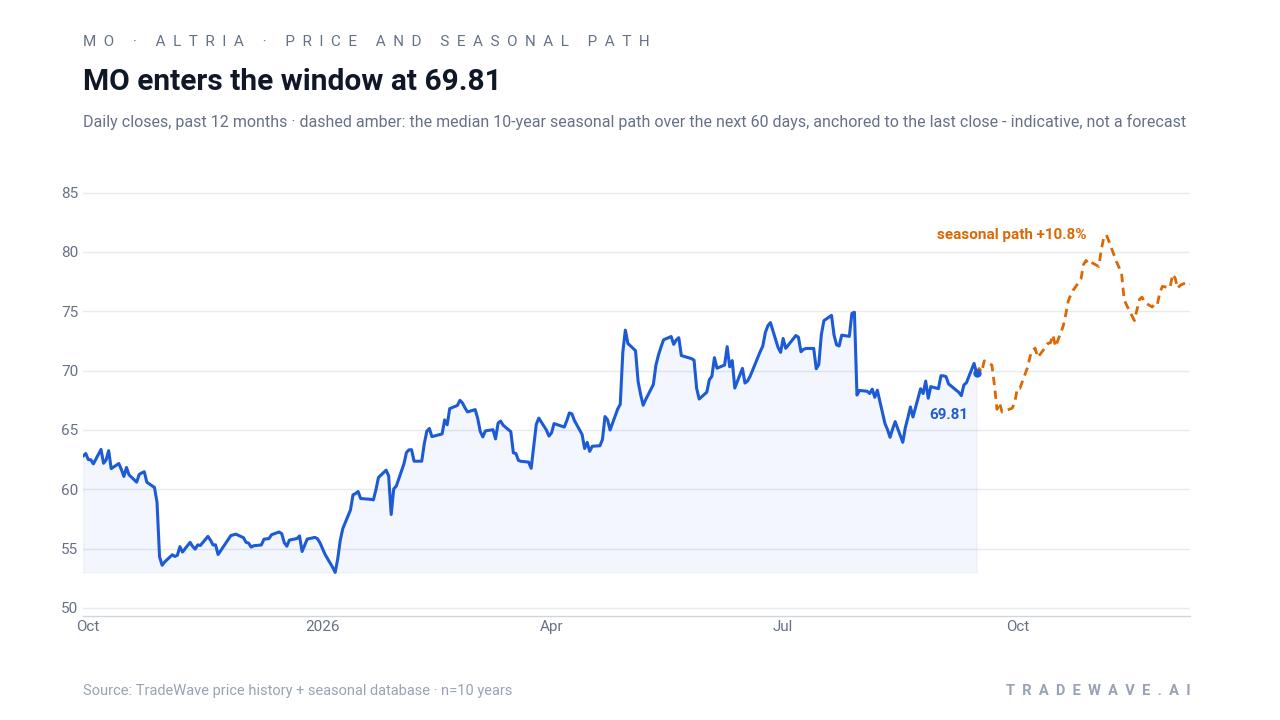
Altria shares closed the latest session at about $70.10, up 0.4% on the day and roughly 21.57% higher so far in 2026, a strong run for a defensive consumer‑staples name.[2] The move comes after a mixed earnings stretch in which the company beat expectations in Q1 2026 with adjusted EPS of $1.32 versus a $1.24 estimate, then narrowly missed in Q2 with EPS of $1.48 against a $1.49 consensus.[3] Even with that small miss, the stock’s high dividend yield remains a central part of the bull case, with Barchart and other outlets continuing to highlight Altria as a high‑yield income play for investors willing to accept regulatory and secular‑decline risk in U.S. tobacco.[5][6]
On the fundamental side, Altria remains one of the dominant U.S. tobacco players, with Marlboro in cigarettes, Black & Mild in cigars, Copenhagen and Skoal in smokeless tobacco, on! nicotine pouches, and NJOY in e‑vapor giving it a broad nicotine portfolio.[2] That mix has helped the company defend cash flow even as cigarette volumes trend lower, and it gives management levers to pull as regulators push smokers toward less harmful products. The sector’s defensive profile has also kept Altria in the conversation for investors looking for ballast against more volatile growth holdings.
Positioning and insider activity add another layer to the story. MarketBeat data show that over the last 24 months insiders have sold 35,698 shares for about $2.45 million, including a 27,908‑share sale by Charles N. Whitaker on Mar 5, 2026, but there have also been purchases, most recently a 1,500‑share buy by director Kathryn B. McQuade on Sep 9, 2026.[4] That mix of selling and selective buying suggests insiders are not uniformly cashing out at current levels, which some investors may read as a modest vote of confidence in the company’s medium‑term outlook.
The chart below situates the latest move in its recent multi‑month context and overlays the historical seasonal path for the next 60 days.
What should traders watch in this Altria seasonal window?
First, the calendar: the 30‑day window runs from Sep 27 to Oct 26, overlapping Altria’s next earnings report, which is scheduled for Oct 29, 2026.[3] Historically, the strongest years in this pattern have seen the stock start to grind higher early in the window, then accelerate into the back half, so traders will be watching whether price action tracks that typical shape or diverges. A choppy or negative first week would not be unprecedented given past maximum adverse moves, but a failure to recover into mid‑October would mark a clear break from the 10‑for‑10 record.
Second, the policy and macro backdrop tied to the election cycle. As the midterm election year wraps up and the year before the presidential election approaches, investors will be parsing any shifts in regulatory tone around nicotine products, tax policy, and healthcare costs, all of which can swing sentiment on tobacco names.[2][5] A friendlier‑than‑feared regulatory path or stable tax environment could reinforce the historical pattern of late‑year strength, while negative headlines could overwhelm the usual seasonal tailwind.
Third, the income story. With Altria still framed as a high‑yield dividend stock, any commentary on payout sustainability, buybacks, or leverage in the upcoming earnings cycle will matter for how income‑focused investors treat this seasonal window.[5][6] If management leans into capital returns and keeps guidance steady, that could support the kind of steady bid that has characterized prior midterm‑year windows; a surprise shift in dividend policy would cut the other way.
Finally, traders should keep an eye on insider and institutional behavior as the window unfolds. Continued selective insider buying or stable ownership data would fit with the historical pattern of quiet accumulation into year‑end, while a pickup in insider selling or large institutional trims would be a clear sign that this cycle may not rhyme with the last 10.[4] The key tell will be whether any pullbacks inside the window resemble past intraperiod drawdowns that ultimately resolved higher, or whether selling pressure persists into late October, breaking a seasonal streak that has held across four decades of midterm election years.
Sources
- Barchart - What to Expect From Altria Group’s Q1 2026 Earnings Report
- Seeking Alpha - Altria Group, Inc. (MO) Stock Price, Quote, News & Analysis
- Public.com - Altria (MO) Earnings: Latest Report, Earnings Call & Financials
- MarketBeat - Altria Group (MO) Insider Trading Activity 2026
- Barchart - Altria Stock: Why Q2 Matters for Its High-Yield Appeal
- Markets Insider / Business Insider - Altria Stock Price | MO Stock Quote, News, and History
About this seasonal analysis
Seasonal pattern data is sourced from TradeWave.ai, which analyzes historical price behavior across annual calendar windows going back up to 30 years. Read the full data methodology or the book The 100-Year Pattern by Afshin Moshrefi (2026 edition). Past performance of seasonal patterns does not guarantee future results. This article is for informational purposes only and does not constitute investment advice.