Ford Motor Company (F) Has Rallied in 8 of 10 Late-October Midterm Windows
Ford Motor Company is approaching a historically strong 13-day midterm-year window in October even as the stock trades well below its 52-week high and regulatory scrutiny over China partnerships keeps volatility elevated.
Price as of Sep 15, 2026: $13.50 (last close).

What is the seasonal pattern for Ford Motor Company (F)?
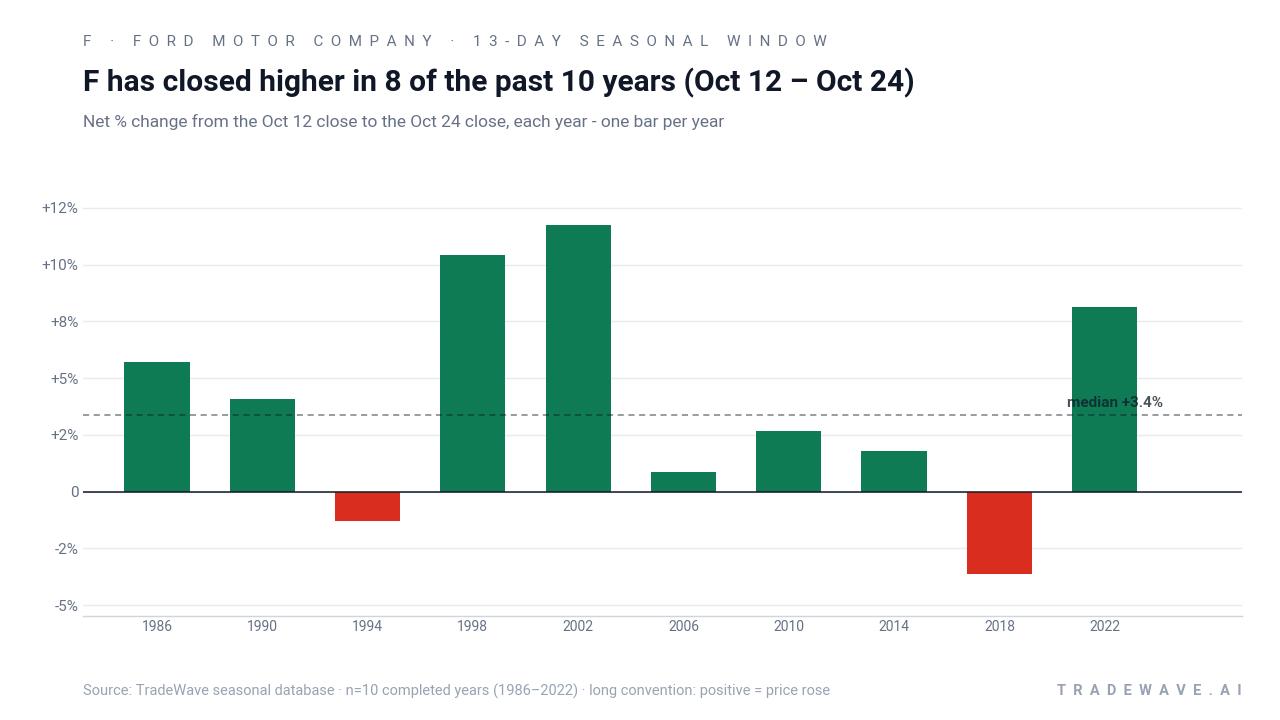
Ford Motor Company has risen in 8 of 10 years during this Oct 12–Oct 24 midterm-year window, with an average gain of 5.67% in winning years.
- 8 for 10 in this window, with winning years averaging 5.67% gains from Oct 12 to Oct 24.
- Percent Profitable is 80%, with 8 winners and 2 losers across the last 10 midterm election years.
- Including all years, the average outcome is a 4% gain over the 13-day Ford Motor Company trading window.
- The strongest year in the sample, 2002, saw an 11.73% net gain, while the weakest, 2018, lost 3.62%.
- Intraperiod swings have been meaningful, with some years showing double-digit point-to-peak rallies and mid-single-digit drawdowns inside the window.
- This late-October seasonal pattern sits in the concluding midterm election year, just before the historically stronger pre-election year phase for equities.
According to historical data from TradeWave.ai, Ford’s late-October behavior in midterm election years has followed a distinct pattern that differs from an average month. The next section walks through how that pattern has played out and where the upcoming 2026 window fits in the broader election cycle.
How has Ford Motor Company (F) traded in the late-October midterm window?
Ford Motor Company has risen in 8 of the last 10 midterm election years during the Oct 12–Oct 24 window, with winning years averaging a 5.67% gain and all years averaging 4%. Shares finished the prior session at 13.50, about 22.4% below the 52-week high of roughly 17.40 and roughly 30.4% above the 52-week low near 10.35, leaving the stock in the middle of its one-year range.[3]
Grouping the data by presidential election cycle matters here because this 13-day slice always lands in the late part of a midterm election year, just before markets transition into the pre-election year that has historically been friendlier to risk assets. In that context, Ford’s pattern looks more consistent than a simple calendar-average view, with most of the strength clustering in the same late-October pocket across cycles.
Across the 10 midterm years in the sample, the long trade direction has been rewarded more often than not. The best net outcome came in 2002, when Ford gained 11.73% between the Oct 12 entry and Oct 24 exit, while 1998 delivered a 10.44% gain. On the downside, 2018 saw a 3.62% loss over the window and 1994 slipped 1.29%, reminding traders that even a strong F seasonal trend can produce losing years.
The intraperiod path has been lively. In 2002, the maximum favorable move, or best point-to-peak rally inside the window, reached 25.72%, while 1998 saw a 14.28% intraperiod gain before settling back to a smaller net profit. On the risk side, several years, including 1998, 2006 and 2010, experienced worst-case drawdowns between roughly 4% and 5% from the entry level before recovering, illustrating that the typical Ford Motor Company trading window here has required tolerance for swings.
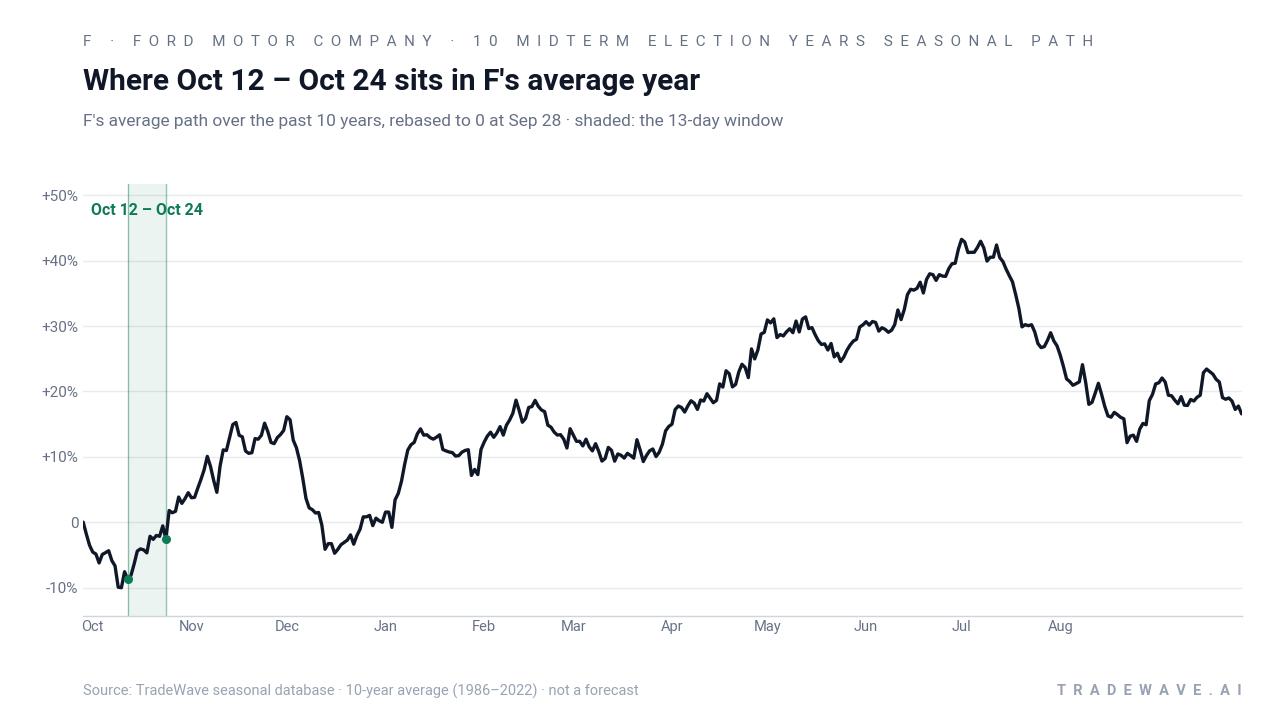
The historical seasonal average, captured in the trend chart, shows Ford tending to grind higher through this 13-day stretch rather than spiking in a single session. Gains have often started to build early in the window and then level off toward the exit date, which fits with the idea of steady positioning into late October rather than a one-off headline shock.
A second view stacks each year’s net result against its full intraperiod range, highlighting how upside and downside have coexisted in this short window.
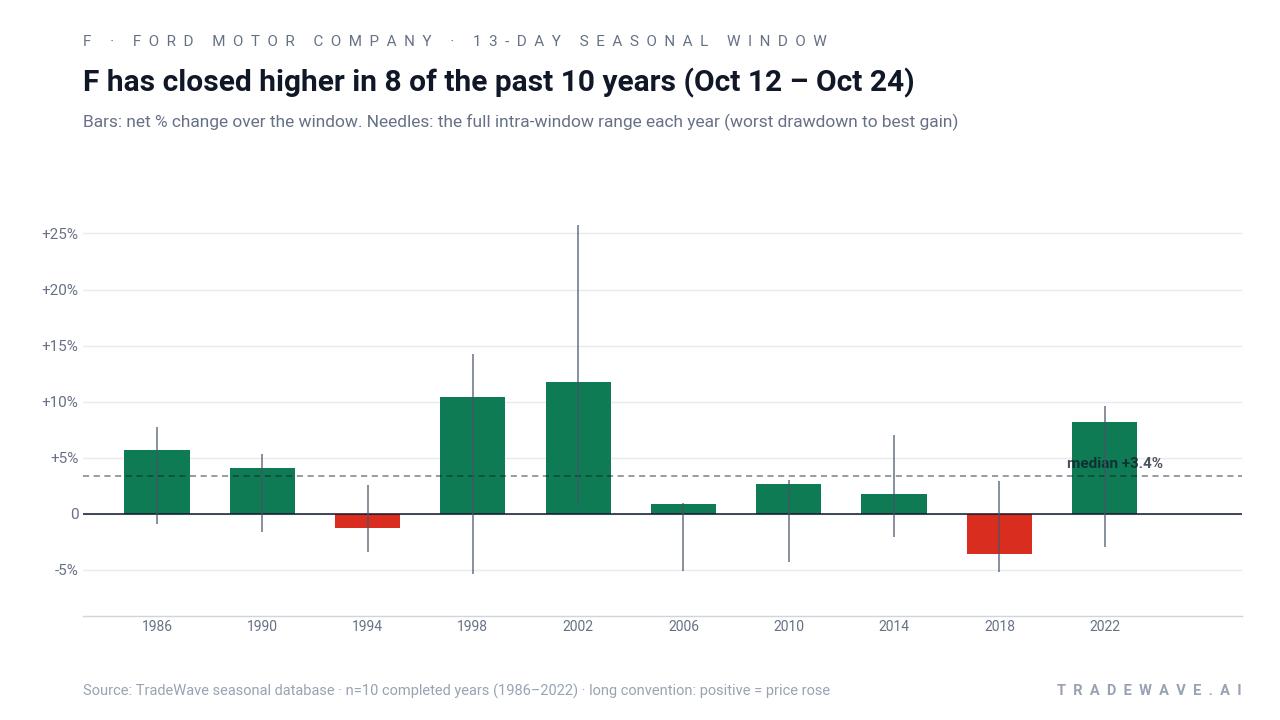
The bars-and-needles profile shows that even in years that finished modestly positive or negative, Ford often traveled several percentage points in both directions inside the window. Large maximum favorable excursions paired with mid-single-digit maximum adverse moves suggest a high-variance but generally upward-tilted setup for a long trade direction.
History does not guarantee future results; adverse excursions (MAE) can be large even in winning windows.
Why does Ford Motor Company (F) follow this seasonal pattern?
One likely driver is the way the auto sector’s earnings calendar and guidance cadence line up with the policy and spending backdrop late in midterm election years. Analysts have pointed to Ford’s results and commentary as key inputs for industrial and consumer cyclicals, so portfolio managers often adjust exposure around this period as they look ahead to the pre-election year’s growth and regulation outlook.[8] The pattern may also reflect sector rotation as investors rebalance between traditional automakers and higher-multiple EV names heading into year-end.[10]
What is driving Ford Motor Company (F) today?
Ford Motor Company closed the latest session at 13.50, down 2.6% on the day, extending a roughly 3.55% slide over the past month as the stock trades well below its 52-week high and above its 52-week low.[1] The pullback comes after a strong Q2 2026 earnings report on Jul 28, when Ford beat EPS estimates by about 17.71% even as revenue missed by roughly 4.48%, a combination that supported upbeat commentary on production and costs.[3] In the wake of those results, Citigroup upgraded the stock to buy with a 20 dollar price target, citing accelerating F-series production, lower warranty accruals and easing material pressures, though that target reflects a more optimistic price regime than today’s mid-teens trading range.[4]
More recently, the story has shifted from earnings to politics. On Sep 9, U.S. officials raised concerns about Ford’s partnerships with Chinese technology and battery firms, including CATL and Geely, prompting a sharp bout of volatility and a forceful response from the company.[9] The scrutiny adds a layer of regulatory and reputational risk just as Ford leans harder into its EV and energy businesses, areas that had previously helped the stock pace the S&P 500 on strong days earlier this year.[10] Zacks noted on Sep 15 that Ford’s shares have at times registered larger declines than the broader market, underscoring how quickly sentiment can swing when macro or policy headlines hit the tape.[5]
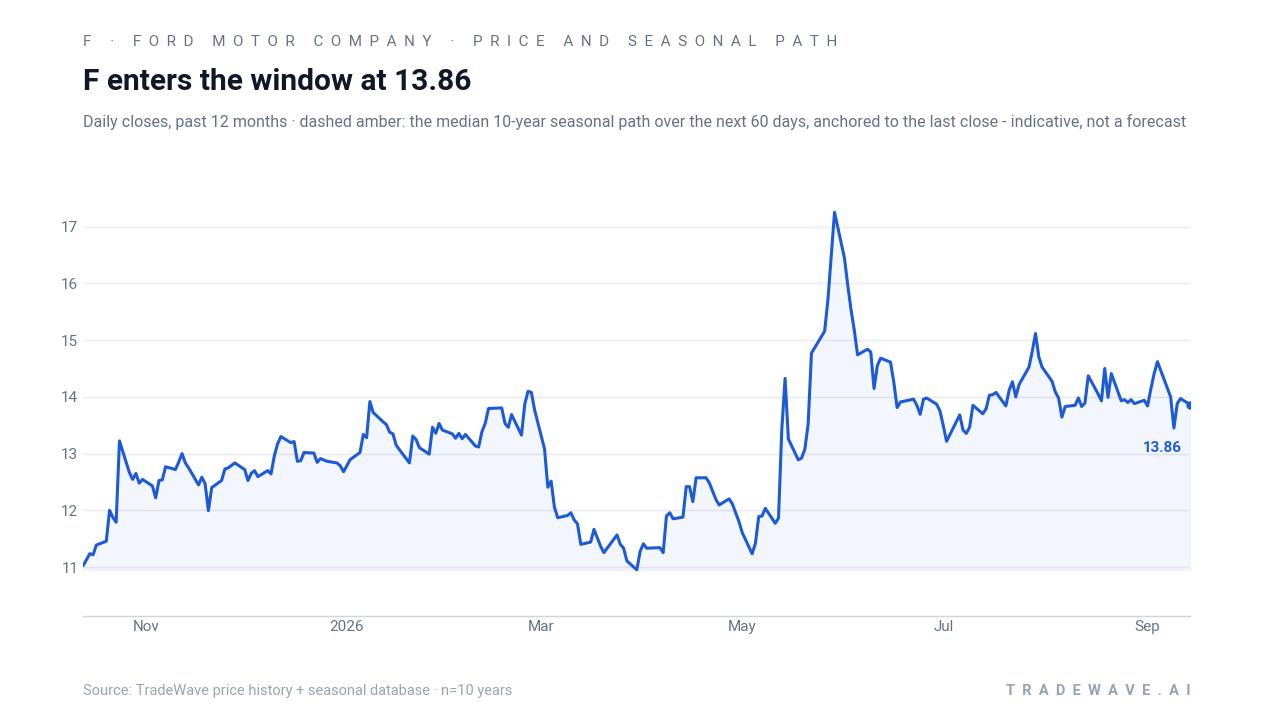
The chart below situates the latest move in its recent multi-month context alongside the historical seasonal projection.
Fundamentally, analysts still see room above spot. ChartMill’s aggregation shows an average analyst price target around 16.11 dollars, implying upside from current levels, though that consensus was built when the stock traded higher earlier in the year.[3][4] Zacks’ latest commentary ahead of Q3 points to an EPS forecast of 0.41 dollars and revenue near 46.04 billion dollars, with the firm maintaining a constructive stance on Ford’s execution and valuation.[5][7] At the same time, ChartMill’s fundamental snapshot flags a short float of 2.63% and days to cover of 2.08, suggesting some bearish positioning but not an extreme short-interest overhang.[6]
On the sector side, Ford remains a key player in the auto and EV transition narrative, with coverage highlighting its push into EVs and the Ford Energy business as a way to capture recurring revenue and investor enthusiasm.[10] That strategic pivot, combined with production recovery as aluminum supply constraints ease, has helped frame Ford as a cyclical name with structural catalysts, which can amplify moves when macro data or policy headlines shift expectations for growth and regulation.[3][8]
What should traders watch as the Oct 12–Oct 24 window approaches?
First, the calendar. The 13-day Ford Motor Company trading window begins on Oct 12 and runs through Oct 24, landing squarely in the concluding midterm election year just ahead of the pre-election year, a phase that has often been friendlier to equities. Historically, this specific slice has produced 8 winners and 2 losers for a long setup, with average gains of 5.67% in the up years and a 4% average across all outcomes.
Second, price levels. With Ford about 22.4% below its 52-week high and roughly 30.4% above its 52-week low, traders will be watching whether the stock stabilizes in the low-to-mid teens or retests the lower end of the range before the window opens.[1][3] Behavior inside the window that mirrors prior cycles, such as early strength followed by consolidation, would line up with the historical seasonality, while a sharp break lower or a flat, low-volatility stretch would mark a departure from the pattern.
Third, catalysts. The next scheduled earnings event is Ford’s Q3 2026 report on Oct 21, which falls right in the middle of the seasonal window and could act as a focal point for volatility.[3][8] Any updates on U.S.-China regulatory scrutiny or on Ford’s EV and energy strategy could also intersect with the window, potentially amplifying the typical intraperiod swings that past years have shown.[9][10]
Finally, volatility itself. The historical record shows that even winning years have seen mid-single-digit drawdowns inside the window before finishing higher, so traders may monitor how intraday ranges and volume behave as Oct 12 approaches. If swings expand and news flow around earnings and policy remains active, the upcoming Ford Motor Company seasonal window could again be a period where the stock moves quickly, in line with its past midterm-year behavior.
Sources
- Seeking Alpha - Ford Motor Company (F) Stock Price, Quote, News & Analysis | Seeking Alpha
- Zacks Investment Research - All You Need to Know About Ford Motor (F) Rating Upgrade to Buy - July 6, 2026
- ChartMill - F Stock Price, Quote & Chart | ChartMill.com
- The Motley Fool - Is Ford Motor Stock a Buy After Its Latest Earnings Report?
- Zacks Investment Research - Ford Motor Company (F) Registers a Bigger Fall Than the Market: Important Facts to Note - September 15, 2026
- ChartMill - F Fundamental Analysis & Valuation | Fair Value & Financial Strength | ChartMill.com
- Zacks Investment Research - Ford Pre-Q2 Earnings Analysis: Buy the Stock Now or Wait? - July 24, 2026
- Barron's - Ford Stock Needs Earnings to Clear a Rising Bar. What to Watch.
- Yahoo Finance - Ford blasts White House criticism of China tech partners, calls Duffy letter 'wrongheaded'
- MarketWatch - Ford’s stock is the S&P 500’s biggest gainer. The carmaker is putting a very Tesla spin on things.
About this seasonal analysis
Seasonal pattern data is sourced from TradeWave.ai, which analyzes historical price behavior across annual calendar windows going back up to 30 years. Read the full data methodology or the book The 100-Year Pattern by Afshin Moshrefi (2026 edition). Past performance of seasonal patterns does not guarantee future results. This article is for informational purposes only and does not constitute investment advice.