Copart (CPRT) Has Risen in 7 of 7 Midterm Autumn Windows, Averaging 9.03% Gains
Copart is heading toward an October 6 trading window that has quietly delivered gains in every midterm election year in the sample, just as shares trade near the lower end of their 52-week range and investors digest fresh earnings and policy uncertainty.
Price as of Sep 15, 2026: $31.04 (last close).

What is the seasonal pattern for Copart (CPRT)?
Copart has risen in 7 of 7 midterm-year autumn windows starting October 6, with an average gain of 9.03% in winning years.
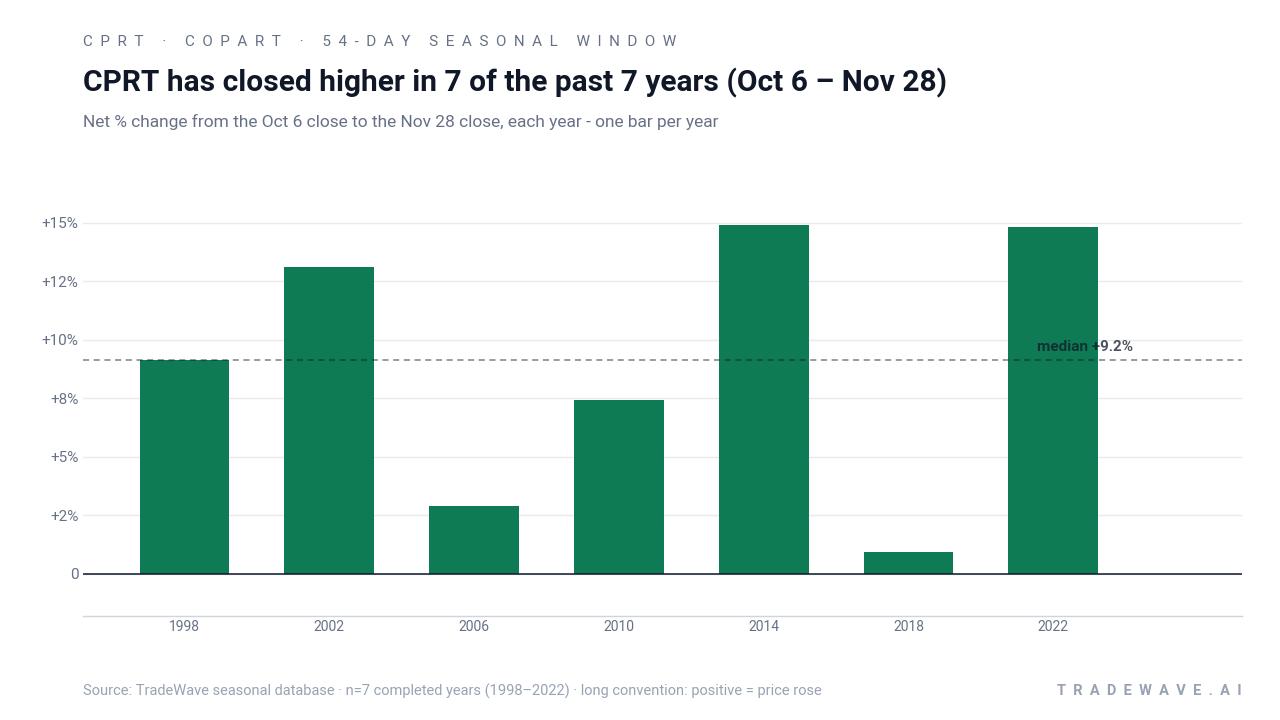
- 7 for 7 in this window, with Copart averaging 9.03% gains across the 54-day stretch from October 6 to November 28.
- Percent Profitable is 100%, with 7 winners and 0 losers across the last 7 midterm election years in this pattern.
- Average profit in winning years is 9.03%, with a median outcome of 9.15%, pointing to a fairly tight cluster of positive returns.
- The TradeWave Ratio of 1.52 suggests price has typically traveled meaningfully in the long direction within the window, not just drifted higher.
- A Sharpe ratio of 1.5 for this window indicates historically strong risk-adjusted returns relative to the volatility of outcomes.
- Individual years have still seen sizable intraperiod drawdowns before finishing higher, so the path has not always been smooth even in winning seasons.
According to historical data from TradeWave.ai, this upcoming autumn stretch for Copart behaves differently from an average month on the calendar. The next section looks at how that midterm-year pattern has played out in prior cycles and where it sits in the broader election and policy backdrop.
How has Copart (CPRT) traded in the late-year midterm window?
Copart has risen in each of the last 7 midterm election years during the 54-day window that runs from October 6 to November 28, averaging a 9.03% gain for long positions. Shares finished the prior session at 31.04, down 2.17% on the day and sitting well below a 52-week high of 48.96, with the stock trading closer to its 52-week low of 26.81.[2] That combination of a strong historical seasonal tailwind and a stock that has already pulled back from its highs gives this year’s window more weight than a typical calendar quirk.
Because this pattern is grouped by the presidential election cycle, it only looks at midterm election years, which tend to feature heavier policy noise early in the year and a clearer fiscal and regulatory path as markets pivot toward the year before the presidential election. For Copart, that means the October 6 window sits right as Washington’s focus shifts from midterm outcomes to the coming pre-election year, a phase that has often coincided with more constructive risk appetite across industrial and infrastructure-linked names.
The trade direction for this setup is explicitly long. Across the seven completed midterm-year windows in the sample, Copart finished higher every time, with individual net returns ranging from 0.94% in 2018 to 14.89% in 2014. The median outcome of 9.15% is close to the average, which suggests the CPRT seasonal trend in this slice of the calendar has not been dominated by a single outlier year.
Looking at the per-year table, 2014 and 2022 stand out as the strongest runs, with gains of 14.89% and 14.83% respectively, while 2018 was the softest at 0.94%. In 1998, the stock still managed a 9.15% net gain despite a very choppy path that included a worst intraperiod drawdown of 20.93% and a best run-up of 17.99%. That mix of strong finishes and sometimes violent swings inside the window is a key feature of this Copart trading window.
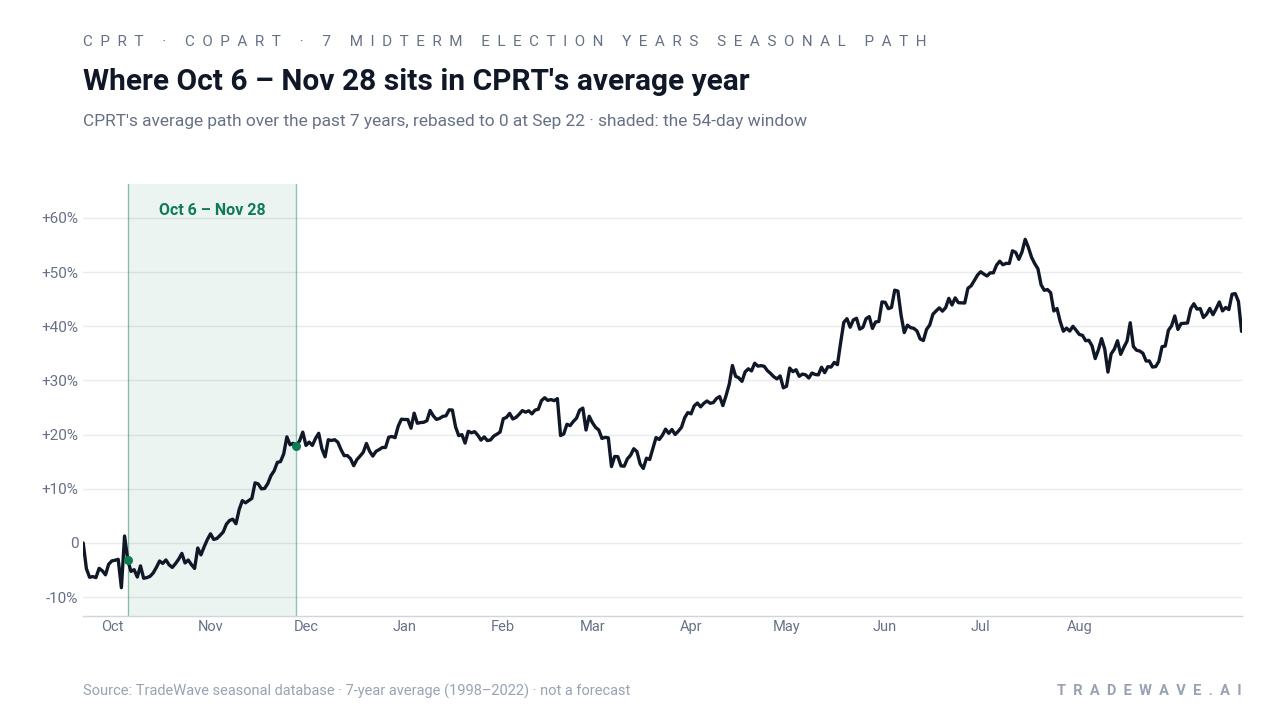
Year-by-year ranges show how far Copart has typically swung inside the window before settling at its final result.
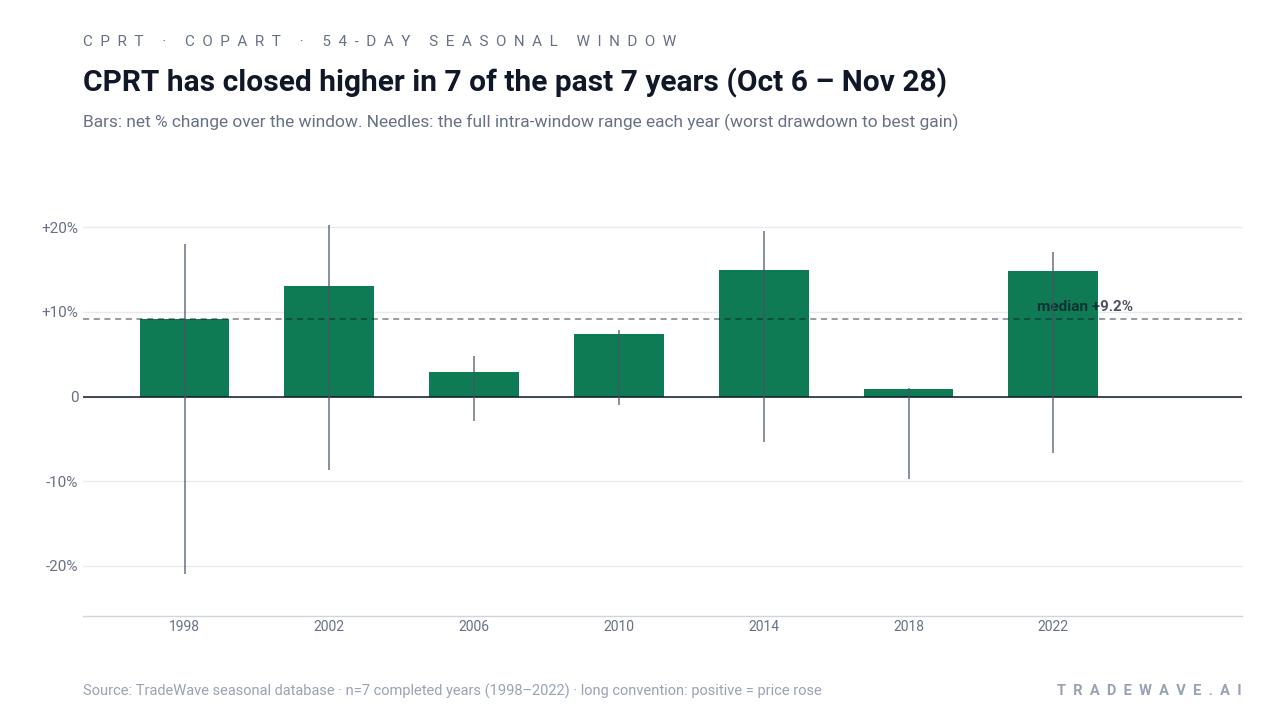
The bar-and-needle profile shows that maximum favorable moves inside the window have often pushed into the mid-teens, while maximum adverse moves have at times been deep, particularly in 1998 and 2018. In plain English, Copart has tended to travel a long way in both directions before ending higher, which aligns with a TradeWave Ratio of 1.52 that points to meaningful trend travel rather than a flat grind. The cumulative chart for this Copart trading window compounds those yearly gains to roughly 81% across the seven midterm cycles, underscoring how consistently this specific slice of the calendar has added up over time.
History does not guarantee future results; adverse excursions (MAE) can be large even in winning windows.
Why does Copart (CPRT) follow this seasonal pattern?
One likely driver is the clustering of Copart’s fiscal-year reporting and guidance updates around late summer and early autumn, which can reset expectations just before this October 6 window begins.[8] Analysts have also pointed to industry-wide shifts in salvage volumes and pricing, which often firm into year-end as insurers close their books and auction pipelines fill, supporting the industrials sector seasonal outlook for names like Copart.[2] Layer in the broader election-cycle effect, where the year before the presidential election has historically seen more supportive policy and liquidity conditions, and the pattern may reflect a recurring mix of company-specific catalysts and macro positioning.
What is driving Copart (CPRT) today?
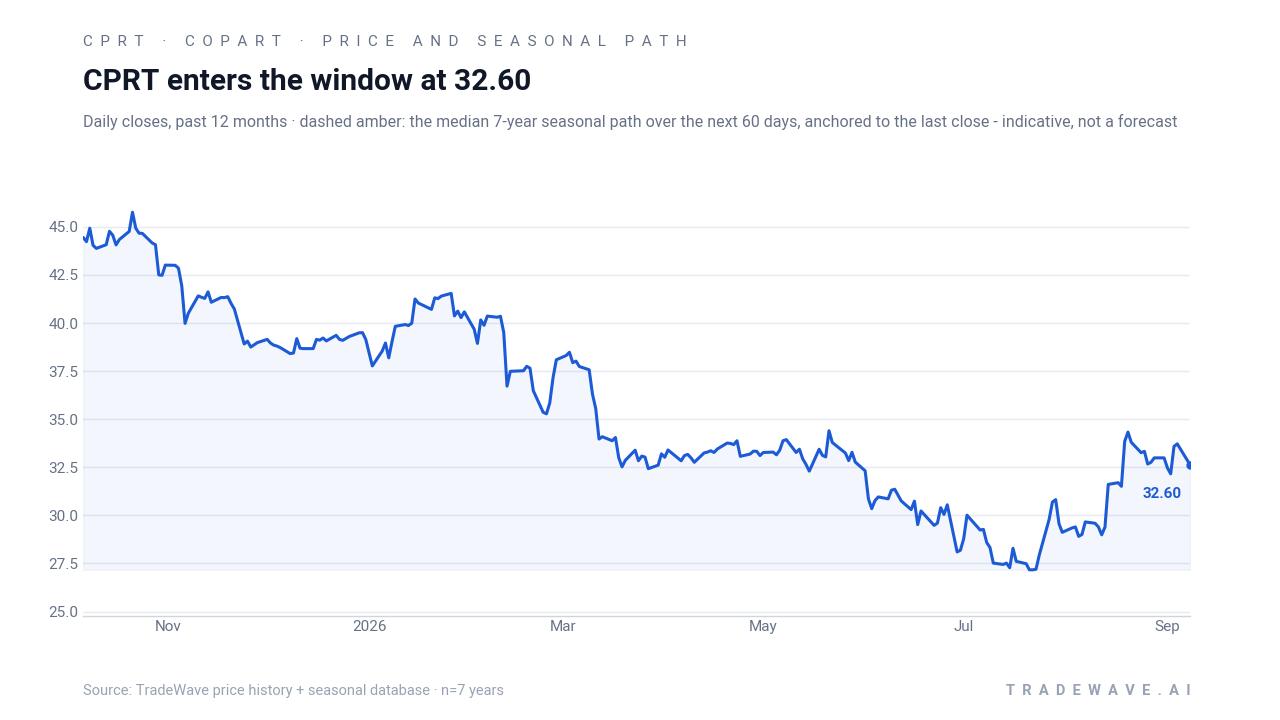
Copart closed the latest session at 31.04, down 0.69 points or 2.17% on the day, after trading between 30.985 and 31.83 on volume of about 7.4 million shares, below its 20-day average of roughly 10.6 million. The stock sits about 36.6% below its 52-week high of 48.96 and roughly 15.8% above its 52-week low of 26.81, with the 50-day moving average near 30.31 acting as a nearby reference level.[2] That leaves Copart in a consolidation zone after a strong multi-year run, with traders weighing fresh earnings against a more cautious narrative on valuation and fee-rate pressure.
On Sep 10, 2026, Copart reported fourth-quarter fiscal 2026 revenue of $1.15 billion and net earnings of $327.42 million, implying a profit margin of 28.41%, which reinforced the company’s reputation for high-margin growth in the auto-salvage and online auction space.[8] Earlier in the year, Copart posted April-quarter earnings per share of $0.43, topping consensus estimates of $0.41 and marking a 4.88% upside surprise, a beat that helped support the stock despite growing concerns about competitive pressure on fee rates and the sustainability of prior growth rates.[3][7] Analysts tracking the name have highlighted that while the long-term structural story remains intact, lower price targets and talk of earnings headwinds have started to reshape the narrative around how much investors are willing to pay for that growth.[4][5][6]
Copart sits in the Industrials sector, in the Diversified Support Services industry, and often trades as a proxy for broader activity in vehicle remarketing, insurance salvage, and logistics-heavy infrastructure.[2] That positioning means macro themes such as used-car pricing, repair costs, and insurance claim volumes can all feed into sentiment on the stock, even when company-level execution remains solid. With the midterm election year concluding and policy debates around infrastructure spending, environmental regulation, and auto-safety standards likely to heat up into the year before the presidential election, Copart’s regulatory and demand backdrop could become more volatile around the same time its historical seasonal window opens.
The chart below situates the latest move in its recent multi-month context alongside the historical seasonal projection.
What should traders watch as the October 6 window approaches?
First, the calendar: this Copart trading window begins on Oct 6 and runs for 54 days, squarely in the handoff from the concluding midterm election year to the year before the presidential election. Historically, that phase has seen policy uncertainty fade and risk appetite improve, which has lined up with the 7-for-7 positive record in this CPRT seasonal pattern. Traders will be watching whether the stock can stabilize above the 50-day moving average near 30.31 and hold the 26.81 area as a key downside reference as the window opens.[2]
Second, earnings follow-through and guidance tone will matter. The latest quarter’s 28.41% profit margin and solid revenue base set a high bar, so any commentary from management or analysts that revisits fee-rate pressure, competitive dynamics, or capital allocation could influence how investors lean into or fade the historical seasonality.[4][8] If the stock responds positively to incremental news and begins to track the typical late-year CPRT seasonal trend, that would be a sign that the historical pattern is aligning with the current fundamental story. If instead the stock breaks materially below recent support despite the favorable window, it would signal that macro or company-specific headwinds are overpowering the usual midterm-year tailwind.
Finally, policy and macro headlines tied to infrastructure, auto markets, and insurance regulation will be key into the year before the presidential election. Any shifts in fiscal spending plans, environmental rules affecting vehicle scrappage, or insurance-industry reforms could alter expectations for salvage volumes and pricing, which are central to Copart’s business model.[2][4] Add it up: the October 6 window has been a remarkably consistent bright spot for Copart in past midterm cycles, but how the stock behaves inside this year’s stretch will tell traders whether that historical seasonality still has bite in the current macro and policy regime.
Sources
- Yahoo Finance - Copart, Inc. (CPRT) Analyst Ratings, Estimates & Forecasts - Yahoo Finance
- Seeking Alpha - Copart, Inc. (CPRT) Stock Price, Quote, News & Analysis | Seeking Alpha
- Yahoo Finance (Markets Articles) - Copart, Inc. (CPRT) Stock Sinks As Market Gains: Here's Why
- Simply Wall St (via Yahoo/aggregated article) - How The Copart (CPRT) Narrative Is Shifting With Lower Price Targets And Earnings Concerns
- Barchart - Copart Stock: Analyst Estimates & Ratings
- ChartMill - CPRT Stock Price, Quote & Chart | ChartMill.com
- Zacks (via Yahoo Finance article) - Copart, Inc. (CPRT) Tops Q3 Earnings and Revenue Estimates
- Barchart Press Release - Copart Reports Fourth Quarter Fiscal 2026 Financial Results
About this seasonal analysis
Seasonal pattern data is sourced from TradeWave.ai, which analyzes historical price behavior across annual calendar windows going back up to 30 years. Read the full data methodology or the book The 100-Year Pattern by Afshin Moshrefi (2026 edition). Past performance of seasonal patterns does not guarantee future results. This article is for informational purposes only and does not constitute investment advice.