AI Capex Hype Meets 83% Losing Sep 23-Oct 9 Stretch for Nvidia (NVDA)
Nvidia is trading well below its 52-week high as it heads toward a late-September seasonal window that has historically leaned bearish for the stock in midterm election years.
Price as of Aug 24, 2026: $208.48 (last close).

What is the seasonal pattern for Nvidia (NVDA)?
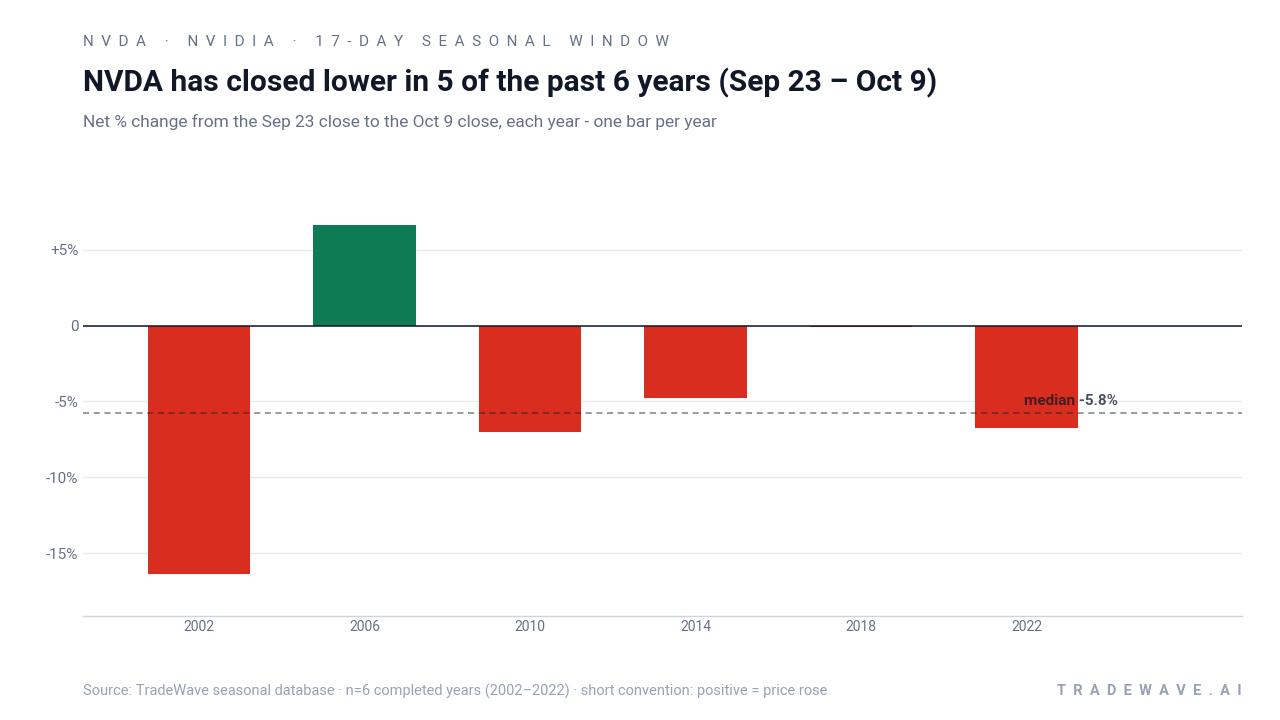
Nvidia has fallen in 5 of 6 midterm-year Sep 23–Oct 9 windows, with an average 6.99% gain in winning years for the short setup.
- 5 wins and 1 loss for the short side in this 17-day Sep 23–Oct 9 window across the last 6 midterm election years.
- Percent Profitable is 83%, with 5 winning short years and 1 losing year for this Nvidia trading window.
- Avg Profit for winning short years is 6.99%, while Avg Profit - All, including the losing year, is 5%.
- The TradeWave Ratio (TWR) of 1.67 signals that price has typically traveled meaningfully in the trade direction within the window.
- Historical maximum adverse moves have reached double digits in some years, underscoring that drawdowns can be sharp even when the short pattern works.
- Stacking this midterm-year window across the sample compounds to roughly 30% cumulative gains for the short side.
According to historical data from TradeWave.ai, this late-September stretch has behaved very differently from an average month in Nvidia’s trading year. The next section walks through how that pattern has lined up with the presidential election cycle and what it has meant for past midterm years.
How has Nvidia (NVDA) traded in the late-September midterm window?
Nvidia has closed lower in 5 of the past 6 midterm election years during the Sep 23 to Oct 9 window, with the short side averaging 6.99% gains in winning years and 5% across all years. Today the stock finished at 208.48, down 2.9% on the session and about 11.6% below its 52-week high of roughly 235.99, leaving it still elevated on a multi-year view but off the peak.
The pattern is grouped by the presidential election cycle, focusing on the last 6 midterm election years rather than consecutive calendar years. That matters because midterm years often feature shifting policy expectations, tighter financial conditions and more volatile risk appetite than the year before or after, and Nvidia has tended to reflect that regime shift in this specific autumn stretch.
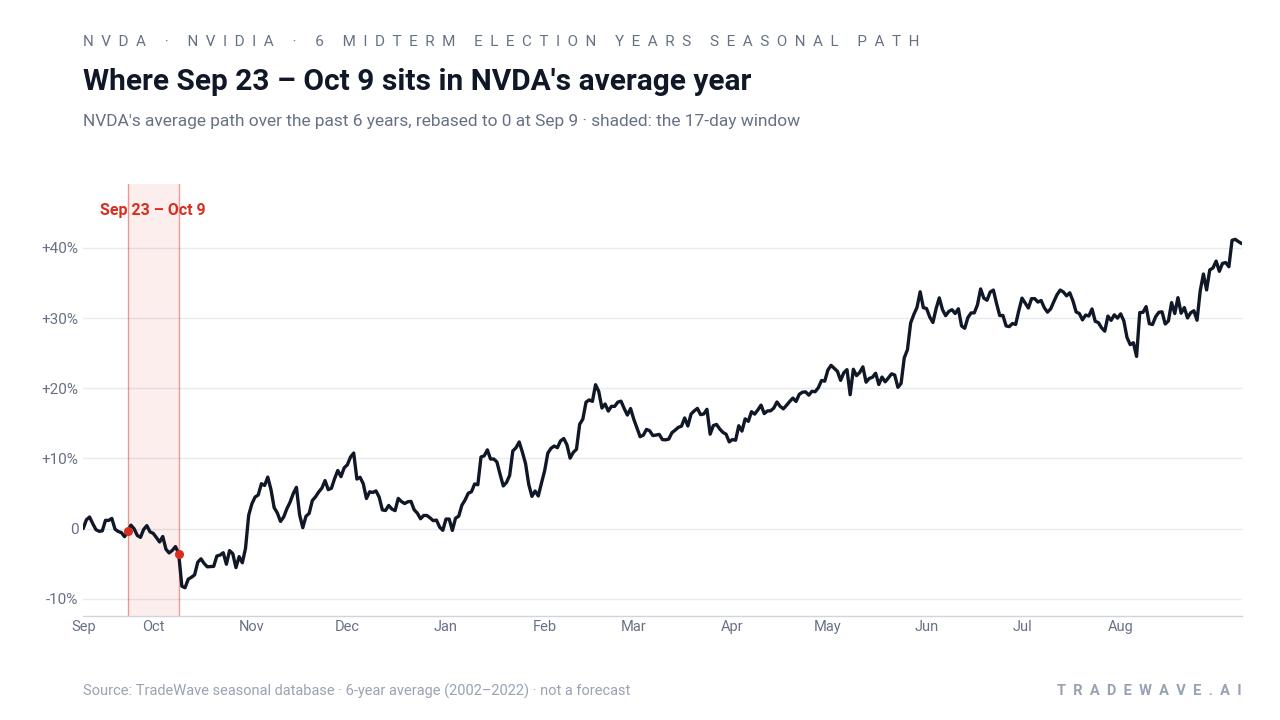
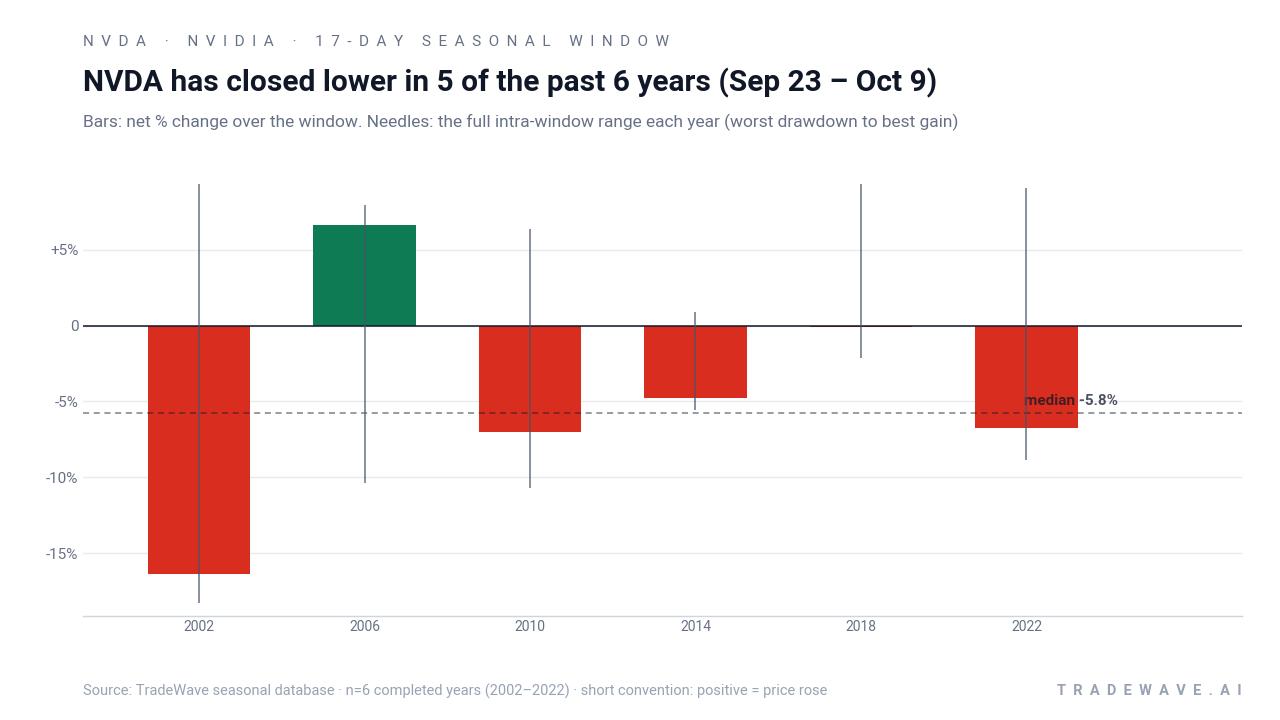
A second view combines net results with the full intraperiod range, highlighting both maximum favorable and adverse moves.
The trade direction for this pattern is explicitly short, so years where Nvidia drifted lower or sold off are the “wins” in this framework. Across the six midterm-year samples, 5 of those windows ended with the stock below its Sep 23 close, while one year saw a rally that hurt the short side. The median outcome is a 5.78% gain for the short setup, which lines up with the 6.99% average profit in winning years and a 5% average when the lone losing year is included.
Intraperiod swings have been meaningful. In 2002, the strongest year for the short side, Nvidia’s net move over the window was a 16.37% drop, but the stock still managed a 9.61% maximum favorable move at one point and an 18.27% maximum adverse move from the entry, showing how violent the path was even in a big win. At the other end of the spectrum, 2018 finished almost flat at minus 0.06% for the short, yet the window still contained a 10.19% best move and a 2.11% worst drawdown, a reminder that the ride can be bumpy even when the final result looks tame.
The maximum favorable excursion and maximum adverse excursion profile across years points to a high-variance window rather than a slow grind. Large positive needles on the chart show that in some years the short side has quickly moved into profit as Nvidia rolled over early in the window. Deep negative needles show that in other years, squeezes against the short have been sharp before the stock eventually settled lower or, in the losing year, stayed elevated.
The cumulative chart for this midterm-year slice compounds those 17-day outcomes into roughly 30% total gains for the short side across the six-sample history. That is not a forecast, but it does show that repeatedly leaning into this specific Nvidia trading window has historically added up for traders who were positioned for weakness rather than strength.
History does not guarantee future results; adverse excursions can be large even in winning windows, and Nvidia’s intraperiod drawdowns have at times exceeded its final net move by a wide margin.
Why does Nvidia (NVDA) follow this seasonal pattern?
One likely driver is the way midterm election years cluster macro and policy uncertainty into the early autumn, just as institutional investors reassess risk budgets and tech exposure. Analysts have also pointed to Nvidia’s earnings calendar and product cycles, which often leave a quieter fundamental news gap between summer launches and late-year updates, making the stock more sensitive to broad risk-off swings in this period.[2] The combination of sector rotation out of high-multiple growth and shifting expectations for AI-related capital spending may help explain why this short window has so often leaned bearish for Nvidia in past midterm years.[2]
What is driving Nvidia (NVDA) today?
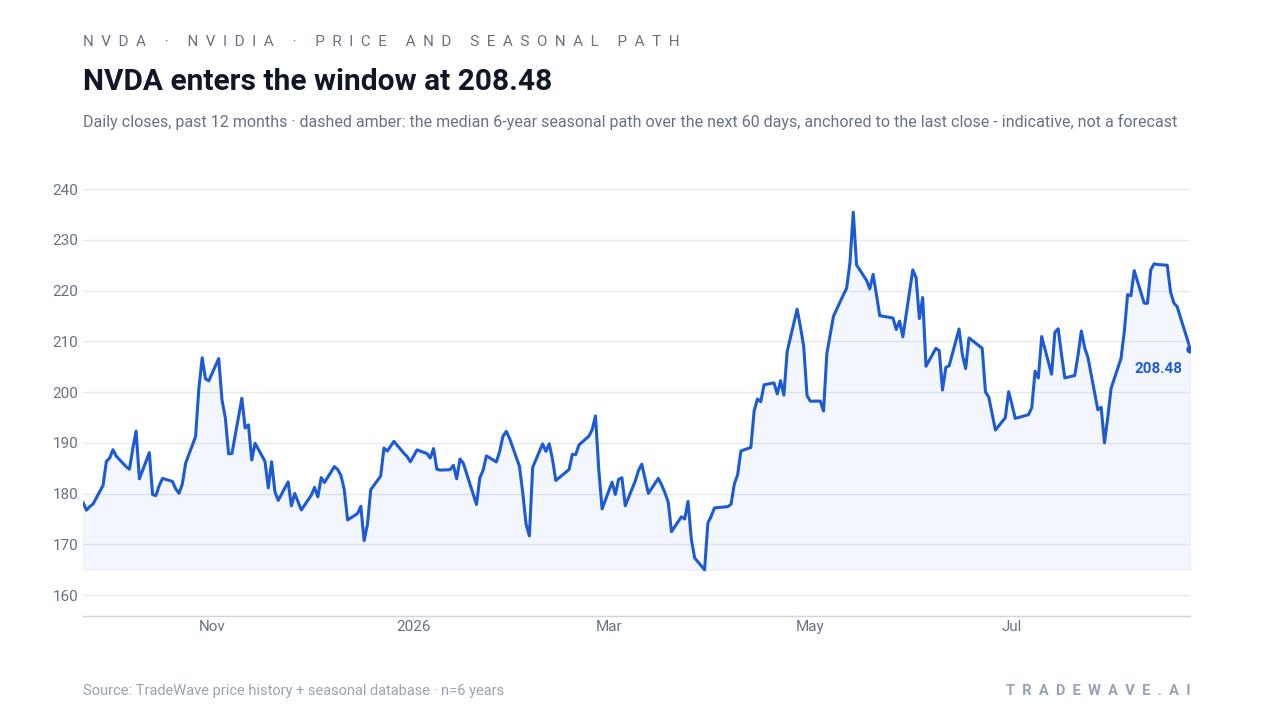
Nvidia closed Monday at 208.48, down 2.9% on the day, leaving the stock about 11.6% below its 52-week high near 235.99 and still well above its 52-week low around 163.63. The pullback comes after a stretch of blockbuster fundamentals, including fiscal 2026 second-quarter revenue of $46.7 billion, up 56% year over year, and adjusted EPS of $1.05, up 54% year over year, underscoring how tightly the share price is tied to AI data center demand.[4]
In February 2026, Nvidia guided for gross margins around 75% and analysts projected that revenue growth could stay above 65% into the following quarter, driven by hyperscaler and enterprise spending on AI infrastructure.[4] In March 2026, investor-focused research highlighted how hyperscaler AI capital expenditure and sovereign AI projects were expanding Nvidia’s long-term revenue opportunity, reinforcing the idea that the company sits at the center of the AI hardware build-out rather than on its fringes.[2]
Sector commentary through late 2025 and early 2026 framed Nvidia as the key supplier in a semiconductor and AI hardware ecosystem that could see more than $500 billion in addressable revenue through the end of next year, helped by the ramp of its rack-scale Blackwell systems.[8] That backdrop has supported a Strong Buy consensus rating and a price target framework that, while compiled from earlier price regimes, still reflects broad optimism about Nvidia’s earnings power and cash generation potential.[1]
Options markets have repeatedly flagged how sensitive the stock can be around catalysts. In May 2026, coverage of Nvidia’s options chain described heavy upside call trading and implied volatility that pointed to large potential post-earnings moves, with some estimates suggesting hundreds of billions of dollars in market-cap swing risk around a single report.[6][7] Earlier commentary in November 2025 also noted short-dated calls trading at a premium to puts ahead of earnings, a setup that tends to appear when traders are willing to pay up for upside exposure and volatility rather than downside hedges.[5]
The chart below situates the latest move in its recent multi-month context and overlays the historical seasonal path for the coming weeks.
What should traders watch as the Sep 23–Oct 9 window approaches?
The next Nvidia seasonal window begins on Sep 23 and runs through Oct 9, landing in the late part of the midterm election year and just ahead of the transition into the historically stronger pre-election year phase. Traders watching this Nvidia seasonal trend will focus on whether the stock starts to roll over into that window, in line with the 5-for-6 record for the short side, or whether strong AI demand and earnings momentum blunt the usual pattern.
Key levels include the recent high near 236 and the 50-day moving average around 207.65, which sits just below Monday’s close and has acted as a reference point for pullbacks in recent months. A decisive break below that moving average during the window would fit the historical seasonality, while a sustained push back toward or through the 52-week high would look more like the lone losing year for the short setup.
Macro and policy headlines will matter as well. Midterm years often bring shifting expectations around regulation, fiscal policy and interest rates, and Nvidia’s role as a bellwether for AI-driven capex means that any sign of hyperscalers slowing or reshaping their spending plans can ripple quickly through the stock.[2][4] If those headlines stay supportive, the historical downside bias could be muted; if they turn cautious, the window’s track record of rewarding shorts could come back into focus.
Options activity is another key tell. Past episodes of heavy upside call buying and elevated implied volatility around earnings have preceded large swings in Nvidia’s share price, even when the direction was hard to handicap in advance.[5][6][7] As the Sep 23–Oct 9 window approaches, traders will be watching whether short-dated calls again trade at a premium to puts and whether straddle pricing climbs relative to realized volatility; a renewed build-up in speculative call positioning could set the stage for either a sharp squeeze against the seasonal pattern or, if enthusiasm fades, a faster slide that lines up with the historical short bias.[5][6][7]
Add it up and the message is straightforward: Nvidia remains a core AI growth story, but its late-September midterm-year window has repeatedly been a soft spot. How the stock behaves around key technical levels, policy headlines and options positioning in that 17-day stretch will show whether this cycle respects or breaks that pattern.
Sources
- Barchart - Nvidia Stock Just Got a New Street-High Price Target. Should You Buy NVDA Now?
- Seeking Alpha - Nvidia: Something Big Is Coming
- The Motley Fool - Nvidia Earnings: What to Watch for on Feb. 25
- CNBC - Nvidia set to report quarterly results after the bell
- CNBC - Something very unusual is happening with Nvidia options
- Seeking Alpha - What Nvidia's options chain shows ahead of earnings
- Reuters - Nvidia shares set for $350 billion price swing after earnings, options show
- MarketWatch - Nvidia’s stock has a strong setup ahead of next week’s earnings, this analyst says
- Business Insider - Watch for this signal in Nvidia stock to capitalize on spring-loaded gains ahead
About this seasonal analysis
Seasonal pattern data is sourced from TradeWave.ai, which analyzes historical price behavior across annual calendar windows going back up to 30 years. Read the full data methodology or the book The 100-Year Pattern by Afshin Moshrefi (2026 edition). Past performance of seasonal patterns does not guarantee future results. This article is for informational purposes only and does not constitute investment advice.