AI PC Upgrade Cycle Meets HP Inc. (HPQ) as a Powerful Midterm Winter Rally Window Nears
HP Inc. is trading just under a fresh 52-week high as it approaches a midterm-year seasonal window that has historically delivered strong upside and elevated swings.
Price as of Sep 11, 2026: $35.48 (last close).

What is the seasonal pattern for HP Inc. (HPQ)?
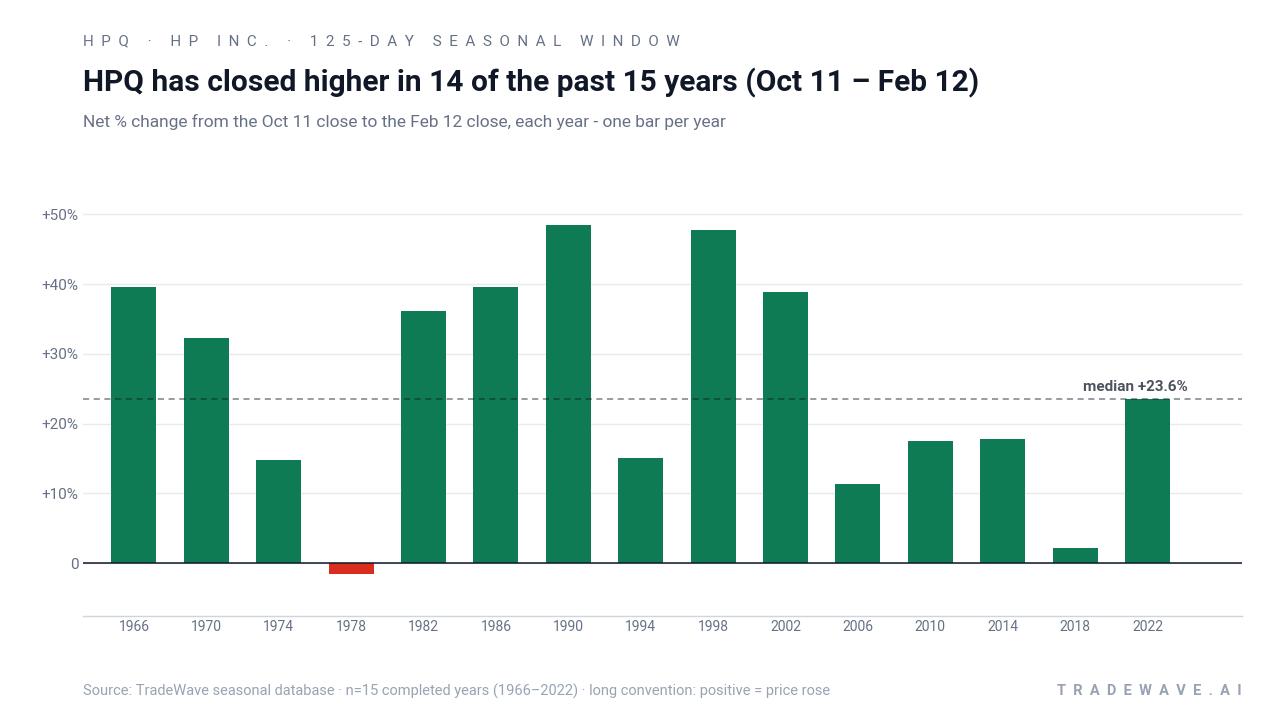
HP Inc. has risen in 14 of 15 years during this Oct 11 to Feb 12 midterm-year window, with an average gain of 27.49% in winning years.
- 14 for 15 in this window, with winning years averaging 27.49% gains and only one losing year in the sample.
- The upcoming trading window runs from Oct 11 for 125 days, covering the late part of the midterm election year into early pre-election-year trading.
- Percent Profitable is 93%, with 14 winners and 1 loser across the last 15 midterm election years in this HPQ seasonal trend.
- Avg Profit is 27.49% for winners, while Avg Profit - All, which includes the lone losing year, is still a hefty 26%.
- The historical pattern shows sizable swings inside the window, with both strong maximum favorable moves and meaningful adverse drawdowns before many of the gains.
- Add it up: stacking this HP Inc. trading window across the sample compounds to a 2,605% cumulative return, underscoring how unusual this midterm-year slice has been.
According to historical data from TradeWave.ai, this specific midterm-year stretch has behaved very differently from an average quarter for HP Inc., and the next iteration is only weeks away.
How has HP Inc. (HPQ) traded in the upcoming Oct–Feb seasonal window?
HP Inc. has closed higher in 14 of the past 15 midterm election years during the Oct 11 to Feb 12 window, a 93% hit rate that stands out even in a strong tech tape. Shares finished Monday at 35.48, up 8.4% on the day and sitting about 2.1% below their 52-week high of 36.225, leaving the stock near the top of its recent range as this historically powerful window approaches.
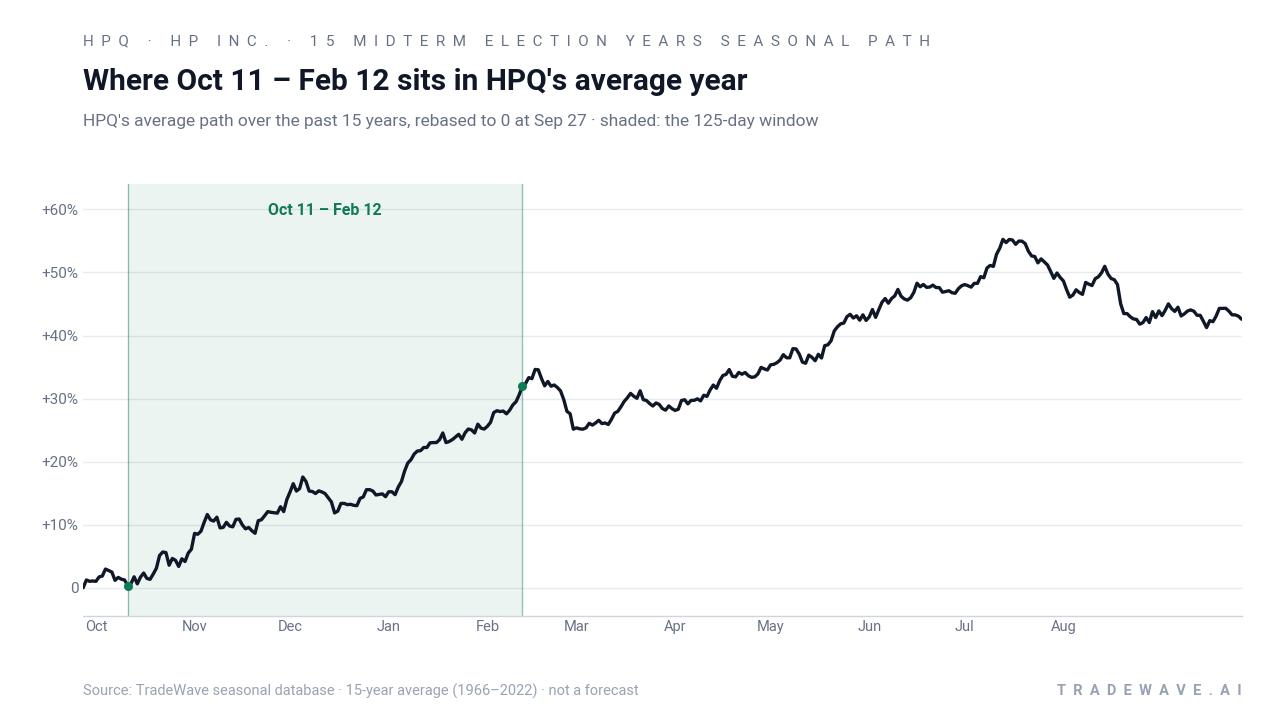
The presidential election cycle matters here because this pattern only looks at the last 15 midterm election years, then tracks HPQ from Oct 11 for 125 days as markets pivot toward the year before the presidential election. That is a phase when Washington often shifts from tightening to a more market-friendly stance, and when corporate IT budgets for the coming year are set, both of which can influence technology hardware spending.
Historically, the trade direction for this HP Inc. trading window has been firmly long. Percent Profitable sits at 93%, with 14 winners and just 1 loser, and the average gain in winning years is 27.49%, compared with an all-years average of 26% once the lone down year is folded in. The median outcome is also strong at 23.56%, which means the typical winning year has not relied on a single outlier to carry the stats.
The per-year breakdown shows how consistent that upside has been. In stronger cycles such as 1990, 1998 and 2002, HPQ logged net returns of 48.4%, 47.71% and 38.87% respectively over the window, while even more muted years like 1994 and 2010 still delivered mid-teens gains. The one clear miss was 2018, when the stock finished the window up only 2.2% after enduring a double-digit drawdown inside the period.
A second view combines yearly net results with the full intraperiod range, from worst drawdown to best run-up.
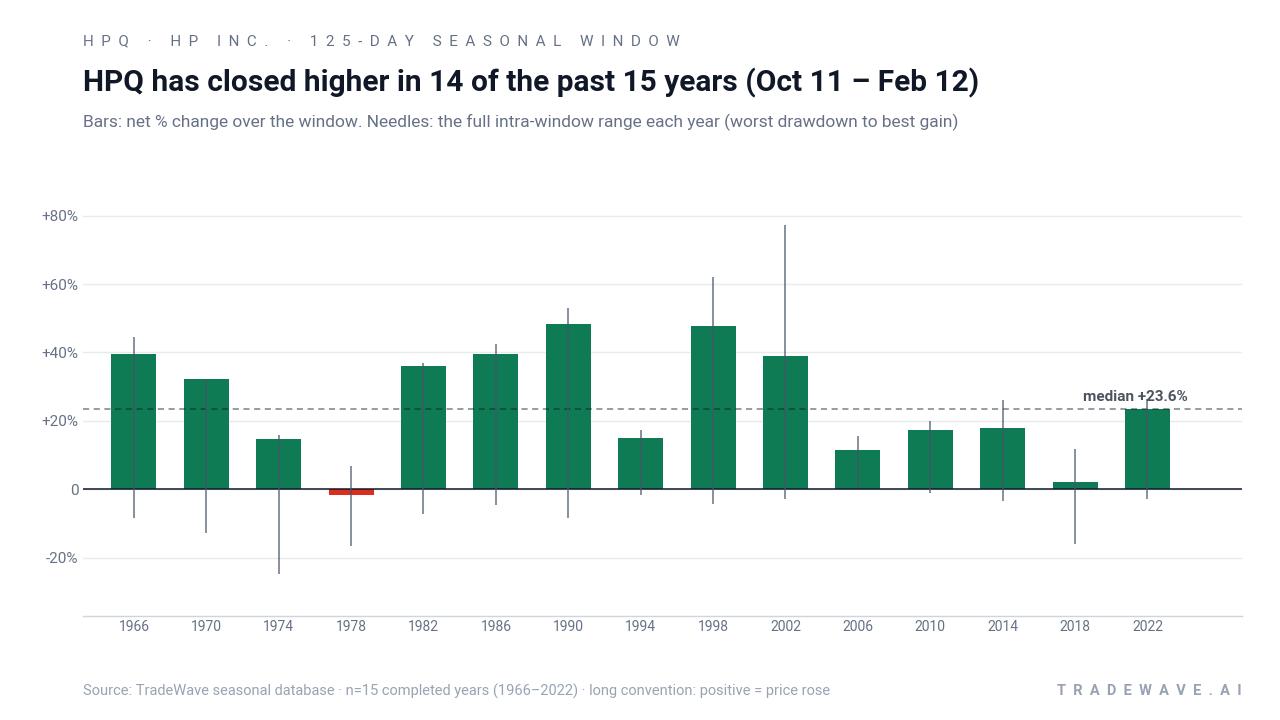
The maximum favorable excursion, or best run-up from the entry during the window, has repeatedly outpaced the final net gain, which is what the TradeWave Ratio of 1.55 is capturing. In years like 2002, HPQ’s maximum favorable move reached 77.13% even though the final net gain was 38.87%, while in 1998 the best intra-window rally hit 62.08% against a 47.71% close. On the downside, maximum adverse excursions have usually been contained to single digits, but 2018 stands out with a worst drawdown of 15.87% before the stock clawed back to a small positive finish.
Put together, the pattern is clear: this has been a long-biased, high-upside seasonal regime for HPQ in midterm election years, with 14 winners out of 15 and average gains in the high 20s. History does not guarantee a repeat, but the consistency and size of prior moves make this window hard to ignore.
Why does HP Inc. (HPQ) follow this seasonal pattern?
One likely driver is the way HP’s fiscal calendar and corporate IT budgeting line up with the broader election cycle. The Oct to Feb stretch captures year-end spending, early-year PC refresh decisions and positioning ahead of HP’s winter earnings updates, all in a period when policy uncertainty from the midterm election begins to fade. Analysts have also pointed to sector rotation into technology hardware as investors look for cyclical exposure heading into the historically stronger year before the presidential election, which may help explain why this particular window has been so favorable for longs.
History does not guarantee future results, and even in winning years HPQ has sometimes seen sizable adverse moves within the window before finishing higher.
What is driving HP Inc. (HPQ) today?
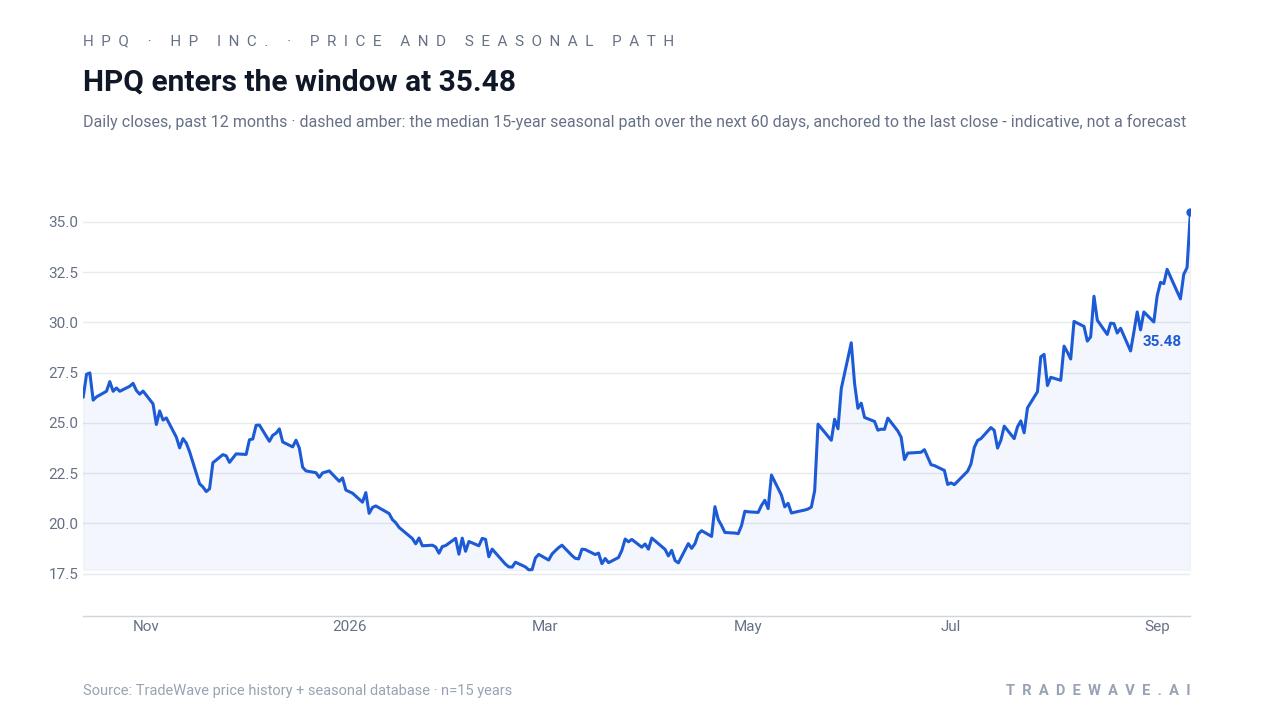
HPQ jumped 8.4% Monday to 35.48 after a powerful post-earnings run, leaving the stock just about 2.1% below its 52-week high of 36.225 and well above its 50-day moving average of 28.05. The move extends a roughly 13.35% gain over the past month and comes on heavy volume of 26.45 million shares, far above the 20-day average of 15.66 million, as investors digest a stronger-than-expected quarter and upbeat guidance.
On Aug 26, 2026, HP reported fiscal third-quarter EPS of $0.83 versus consensus estimates around $0.66, with revenue of $15.68 billion topping expectations near $14.44 billion and rising 12.5% year over year.[1] Management set full-year 2026 EPS guidance in a range of 3.190 to 3.290, bracketing analysts’ average forecast of roughly 3.23, and guided fourth-quarter EPS to 0.690 to 0.790, which helped underpin the stock’s earnings reaction.[1][2] Coverage of the name has highlighted how AI-enabled PCs and advanced chips could drive an upgrade cycle that benefits HP’s personal systems business, adding a structural tailwind to the near-term beat.[4]
Analyst sentiment remains measured despite the rally. MarketBeat and ChartMill data show a consensus “Hold” rating on HPQ, with a blended price target around 25.17 that now sits well below the current share price and reflects an earlier, lower trading regime.[1][2] Public.com’s snapshot of the stock similarly shows a mixed rating distribution, with investors weighing cyclical PC demand against the potential for AI-driven refresh spending and HP’s capital return profile.[5]
Sector-wise, HP sits squarely in Technology Hardware, Storage & Peripherals, a group that has been pulled along by enthusiasm for AI infrastructure and device upgrades.[3][4] As the market wraps up the midterm election year, investors are also looking ahead to the policy and spending backdrop of the year before the presidential election, a phase that has often been friendlier to risk assets and to cyclical tech names tied to corporate capex.
The chart below situates the latest move in its recent multi-month context and overlays the median 60-day seasonal path.
What should traders watch as this HPQ seasonal window approaches?
First, the calendar: the 125-day window begins on Oct 11 and runs into mid-February, overlapping HP’s next earnings report, currently expected around Nov 23, 2026.[2] How the stock trades into and out of that print will be a key test of whether this midterm-year seasonal pattern repeats or fades. A firm tape that shrugs off normal pullbacks would be consistent with the historical HPQ seasonal trend, while a failure to hold gains into earnings would mark a clear break from prior cycles.
Second, levels matter. On the upside, traders will be watching whether HPQ can sustain a break above the 52-week high near 36.23 on strong volume, while on the downside, the 50-day moving average around 28.05 and the prior post-earnings gap zone are likely to be viewed as important support. Behavior around those bands during the Oct to Feb window will help confirm whether this remains a buy-the-dip regime or shifts into something choppier.
Third, the macro and policy backdrop into the year before the presidential election will shape how much room the stock has to run. Any signs that corporate IT budgets are tightening, or that AI PC demand is slower than hoped, could blunt a pattern that has historically been very friendly to longs.[3][4] Conversely, evidence of a broad-based PC refresh cycle and stable rates could reinforce the historical tendency for HPQ to trend higher through winter.
Sources
- MarketBeat - HP (NYSE:HPQ) Stock Rating Upgraded by Zacks Research
- ChartMill - HPQ Forecast, Price Target & Analyst Ratings | ChartMill.com
- Seeking Alpha - HP Inc. (HPQ) Stock Price, Quote, News & Analysis - Seeking Alpha
- Yahoo Finance (article) - What Are Wall Street Analysts' Target Price for HP Inc. Stock?
- Public.com - Buy HP Stock – HPQ Stock Quote Today & Investment Insights
About this seasonal analysis
Seasonal pattern data is sourced from TradeWave.ai, which analyzes historical price behavior across annual calendar windows going back up to 30 years. Read the full data methodology or the book The 100-Year Pattern by Afshin Moshrefi (2026 edition). Past performance of seasonal patterns does not guarantee future results. This article is for informational purposes only and does not constitute investment advice.