S&P Global (SPGI) Has Posted Gains in Every Midterm Oct 6-Jun 15 Window, Averaging 24.4%
S&P Global is down double digits for 2026, but a midterm-election seasonal window that has never produced a losing year for the stock is about to open.
Price as of Sep 11, 2026: $410.71 (last close).
What is the seasonal pattern for S&P Global (SPGI)?
S&P Global has risen in 10 of 10 midterm-election-year Oct 6–Jun 15 windows, with an average gain of 24.4% in winning years.
- 10 for 10 in this window, averaging 24.4% gains in winning years across the last 10 midterm election years.
- Seasonal window runs from Oct 6 through Jun 15, spanning 253 calendar days in the midterm-to-pre-election transition.
- Percent Profitable is 100%, with 10 winners and 0 losers in the historical sample.
- Annualized return across these windows is 24.04%, compounding to a cumulative 762% when stacked over all 10 years.
- TradeWave Ratio (TWR) of 1.88 signals that price has typically traveled meaningfully in the long direction within the window.
- Sharpe ratio of 2.16 indicates strong risk-adjusted returns for this specific S&P Global trading window.
According to historical data from TradeWave.ai, this midterm-year Oct 6–Jun 15 stretch has behaved very differently from an average year for S&P Global, and the next iteration is only weeks away.
How has S&P Global (SPGI) traded in the Oct 6–Jun 15 midterm-year window?
S&P Global has rallied in every single Oct 6–Jun 15 window across the last 10 midterm election years, averaging a 24.4% gain for longs. Shares finished Monday at 410.71, leaving the stock down 16.91% year to date and well below early-2026 levels as investors digest a tougher earnings tape and higher-for-longer rates.[2][3]
Grouping the data by the presidential election cycle matters here because this 253-day window straddles the end of the midterm election year and the start of the year before the presidential election, a phase that has often coincided with friendlier policy tone and improving risk appetite. For a benchmark name in financial information and index services, that backdrop has historically lined up with stronger issuance, more trading activity and rising demand for S&P Global’s data and benchmarks.[4][6]
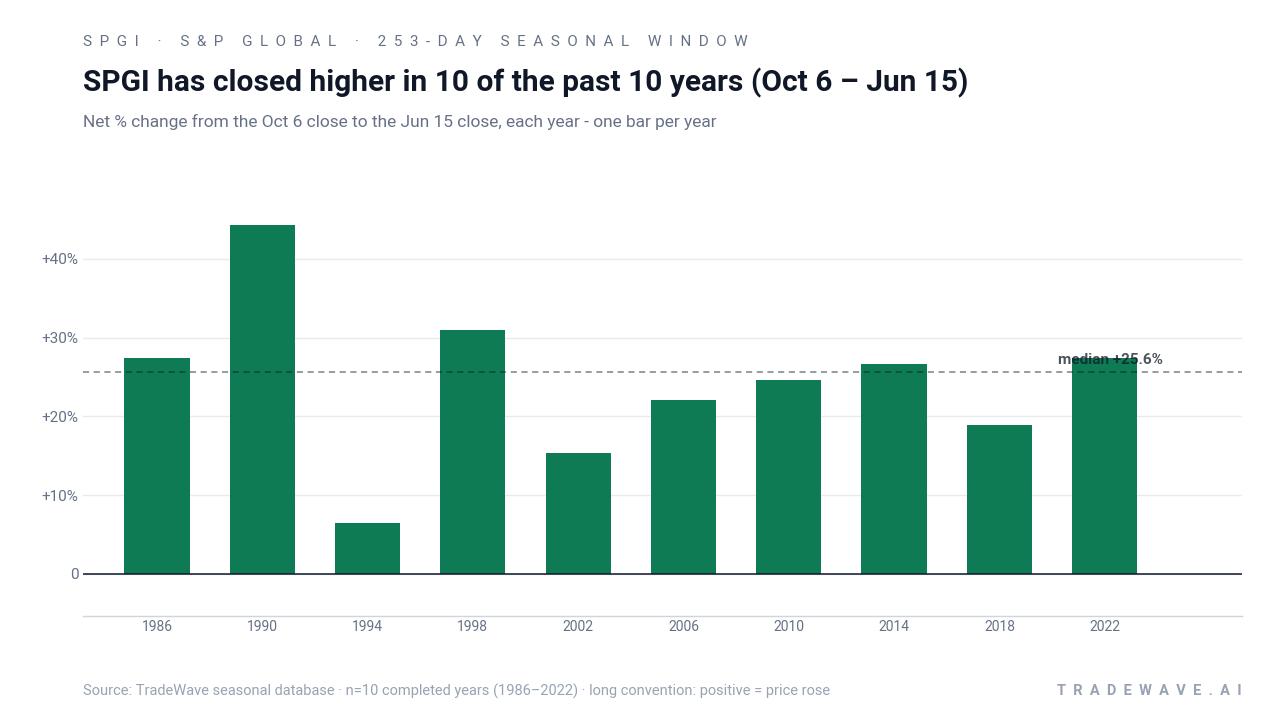
Across the 10 completed midterm-year samples since 1986, S&P Global’s Oct 6–Jun 15 windows have delivered an annualized return of 24.04% and a cumulative gain of 762% when hypothetically compounded year after year. The median outcome is a 25.58% advance, which lines up closely with the average, suggesting the pattern is not being skewed by a single outlier year.
The per-year table shows how consistent that upside has been. The weakest window, in 1994, still finished up 6.4%, while stronger years such as 1990, 1998 and 2022 posted gains of 44.25%, 30.99% and 27.46% respectively. In every case, the trade direction was long, and every year closed higher than it started.
A second view combines net results with the full intraperiod range, highlighting both upside potential and typical drawdowns.
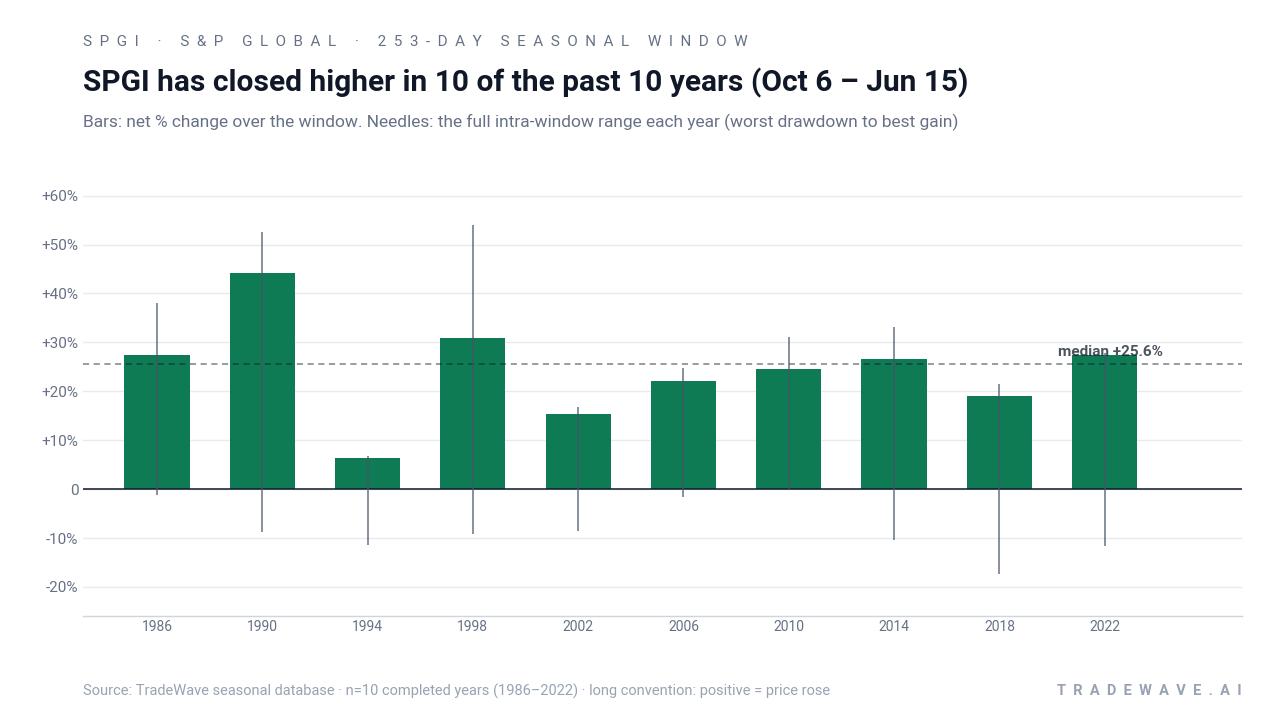
The maximum favorable move within each window has often exceeded the final net gain, which is what the TradeWave Ratio of 1.88 is capturing: price has typically traveled a long way in the trade direction before the window closes. At the same time, the worst intraperiod drawdowns have been non-trivial, with adverse excursions in some years reaching double digits before the stock recovered into the close of the window.
The Sharpe ratio of 2.16, calculated on end-of-window outcomes, points to a historically strong risk-adjusted profile for this specific S&P Global trading window. Add it up: 10 winners, no losers, and a return distribution that has so far favored patient longs during the midterm-to-pre-election handoff.
History does not guarantee future results; adverse excursions (MAE) can be large even in winning windows.
Why does S&P Global (SPGI) follow this seasonal pattern?
One likely driver is the way the midterm election year often clears policy uncertainty, setting up a more constructive backdrop for credit markets, equity issuance and index-linked flows in the year before the presidential election. Analysts have also pointed to institutional portfolio repositioning around year-end and into the first half, which can favor high-moat, fee-based financials like S&P Global as investors rotate toward quality growth.[4][6] The Oct 6–Jun 15 window may be capturing that combination of calmer policy risk and renewed demand for ratings, benchmarks and data.
What is driving S&P Global (SPGI) today?
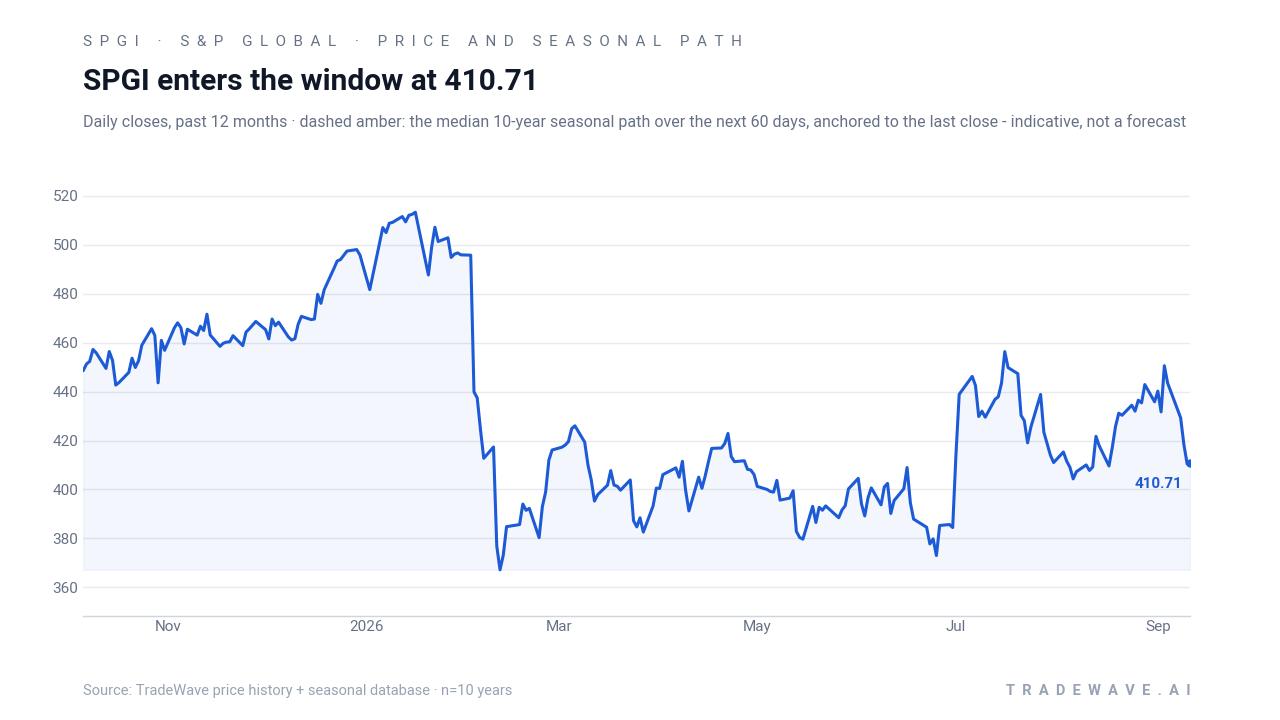
S&P Global closed Monday at 410.71, up 0.07% on the day, leaving the stock down 16.91% for 2026 as investors reassess growth expectations after a softer earnings print and a reset in rate-cut hopes.[2][3] The stock has pulled back from its 52-week high of about 487.53 and is trading above a 52-week low near 336.89, with the 50-day moving average around 426.87 and 20-day average volume near 1.84 million shares, underscoring a choppy consolidation phase rather than a full-blown breakdown.
The near-term narrative is still anchored in fundamentals. On Jul 28, S&P Global reported Q2 2026 earnings per share of $4.83, missing the $4.95 consensus estimate by 2.42%, a modest disappointment that has weighed on sentiment ahead of the next earnings call scheduled for Oct 29.[2] In early September, a detailed investor write-up highlighted the company’s operating leverage and diversified revenue streams across Ratings, Indices, Market Intelligence and energy data, arguing that the franchise remains structurally resilient even as multiples compress.[6]
Short interest remains relatively contained. As of late August, S&P Global’s short interest stood at 2.58% of float, with recent data showing a decline in shares sold short compared with earlier in the year, suggesting limited evidence of an aggressive bearish build-up.[5] That positioning backdrop matters because it means any seasonal tailwind into the Oct 6–Jun 15 window would be working against a market that is cautious but not heavily skewed toward outright downside bets.
Valuation debates continue in the background. In March 2026, Morningstar reiterated a $570 fair value estimate and a wide economic moat rating, framing S&P Global as oversold at the time amid market worries that new AI tools could disrupt its capital-markets information services.[4] More recently, a Morgan Stanley note in July maintained an Overweight rating while trimming the price target to $525, reflecting a slightly more cautious stance but still signaling confidence in the long-term earnings power of the franchise.[1]
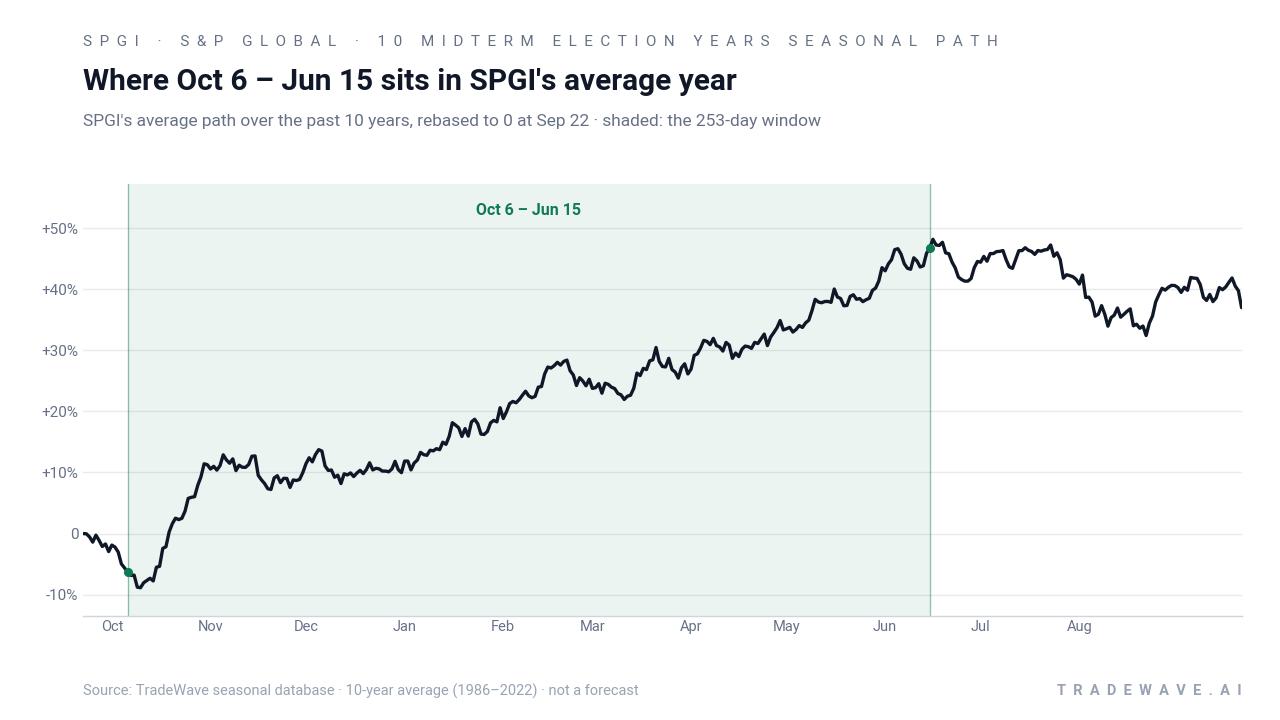
The chart below situates the latest pullback against the past year of trading and a typical seasonal path over the next two months.
What should traders watch as the Oct 6–Jun 15 window approaches?
First, the calendar. The Oct 6 start date is less than a month away, and it lands as markets wrap up the midterm election year and pivot into the historically stronger year before the presidential election. How S&P Global trades into and through the Oct 29 earnings call will help show whether fundamentals are stabilizing enough for the historical seasonal tailwind to matter.[2]
Second, levels. On the downside, traders will be watching the 400 area and the 52-week low zone near 336.89 as key support bands, while on the upside, the 50-day moving average around 426.87 and the low-450s stand out as near-term resistance. A pattern where pullbacks into the window are bought and the stock begins to grind above its 50-day line would rhyme with prior midterm-year Oct–Jun windows.
Third, positioning and sentiment. Short interest has been modest and drifting lower, so any pickup in bearish bets into year-end would mark a change in tone and could either amplify downside volatility or set up future squeezes if the seasonal pattern reasserts itself.[5] Conversely, if shorts stay contained and long-only investors lean back into high-moat financial infrastructure names, S&P Global’s historical 10-for-10 record in this window will be front of mind for traders tracking seasonality.
Finally, the macro and policy calendar. The year before the presidential election has often coincided with a more supportive policy stance and steadier risk appetite, which in turn can boost issuance, trading and demand for S&P Global’s ratings and index products.[4][6] If that backdrop takes shape again while the stock is still trading at a discount to long-term fair value estimates, the Oct 6–Jun 15 window will be a key test of whether this midterm-election seasonal pattern continues to hold.
Sources
- GuruFocus - SPGI Maintained by Morgan Stanley -- Price Target Lowered to $525
- Public.com - S&P Global (SPGI) Earnings: Latest Report, Earnings Call & Financials
- MarketWatch - SPGI Stock Price | S&P Global Inc. Stock Quote (U.S.: NYSE)
- Morningstar - S&P Global: An Oversold Stock to Buy Amid AI Disruption Fears
- MarketBeat - S&P Global (SPGI) Short Interest & Short Float | Updated Sep 2026
- Seeking Alpha - S&P Global: Operating Leverage Is The Name Of The Game (NYSE:SPGI)
About this seasonal analysis
Seasonal pattern data is sourced from TradeWave.ai, which analyzes historical price behavior across annual calendar windows going back up to 30 years. Read the full data methodology or the book The 100-Year Pattern by Afshin Moshrefi (2026 edition). Past performance of seasonal patterns does not guarantee future results. This article is for informational purposes only and does not constitute investment advice.