8-for-8 Midterm Streak: Amphenol (APH) Enters a 202-Day Sep-Apr Window With 100% Wins
Amphenol is approaching a historically strong 202-day seasonal window just as shares pull back from record territory amid intense AI data-center optimism.
Price as of Sep 14, 2026: $78.55 (last close).

What is the seasonal pattern for Amphenol (APH)?
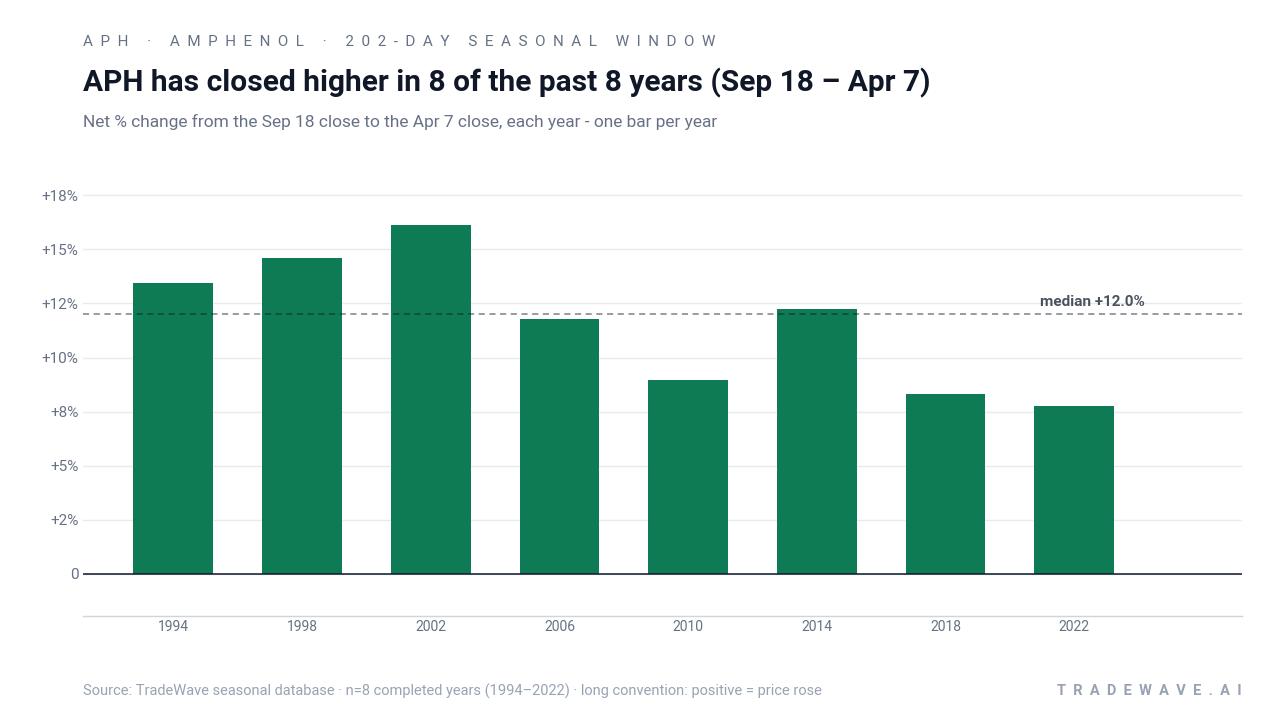
Amphenol has risen in 8 of 8 midterm-election-year Sep 18 to Apr 7 windows, with an average gain of 11.66% in winning years.
- 8 for 8 record: Amphenol has finished higher in every Sep 18 to Apr 7 window across the last 8 midterm election years, averaging 11.66% gains.
- Long, 202-day stretch: The upcoming window runs from Sep 18 through Apr 7, capturing the transition from the concluding midterm election year into the pre-election year.
- High hit rate: Percent Profitable is 100%, with 8 winners and 0 losers across the lookback sample.
- Strong risk-adjusted profile: The Sharpe ratio for this window is 3.08, and the TradeWave Ratio (TWR) is 2.46, indicating historically favorable upside relative to volatility.
- Meaningful swings inside the window: Individual years have seen best intraperiod rallies of up to 30.18% and worst drawdowns as deep as -21.94% before finishing positive.
- Election-cycle context: This APH seasonal trend is specific to the last 8 midterm election years, a phase that often precedes stronger risk appetite into the pre-election year.
According to historical data from TradeWave.ai, this midterm-election-year Sep-to-Apr stretch has behaved very differently from an average calendar window for Amphenol, and the next iteration begins in days.
How strong is the upcoming Sep–Apr seasonal window for Amphenol (APH)?
Amphenol has closed higher in every single Sep 18 to Apr 7 window across the last 8 midterm election years, averaging 11.66% gains over 202 days. Shares ended the prior session at 78.55 after a 6.4% slide, leaving the stock about 7.0% below its 52-week high of 84.48 and still far above its 52-week low near 29.02. That combination of a sharp pullback from highs and a historically strong midterm-year seasonal regime is what makes this upcoming window stand out for traders watching the APH seasonal trend.
The election-cycle framing matters here. The pattern is built only from the last 8 midterm election years, a phase that historically features policy uncertainty in the first half of the year and a more constructive risk tone as markets look ahead to the pre-election year. Amphenol’s Sep-to-Apr window sits squarely in that transition, starting in the concluding midterm election year and running deep into the year before the presidential election.
Across those 8 midterm-year samples, the trade direction is long and the hit rate is perfect: Percent Profitable is 100%, with 8 winners and 0 losers. Average profit across all years is 11.66%, with a median outcome of 12.0%, which means the typical result has been a double-digit gain over roughly six and a half months. The annualized return for this window clocks in at 11.62%, and the Sharpe ratio of 3.08 points to unusually strong risk-adjusted performance for a single recurring slice of the calendar.
The per-year table shows how those gains have stacked up. The strongest year in the sample was 2002, when Amphenol returned 16.11% between Sep 18 and Apr 7, with a best intraperiod rally of 30.18% from the entry level before giving some of it back. The softest outcome was 2022, which still delivered a 7.76% net gain over the window, with a maximum favorable move of 13.24% and a worst drawdown of -10.88% along the way.
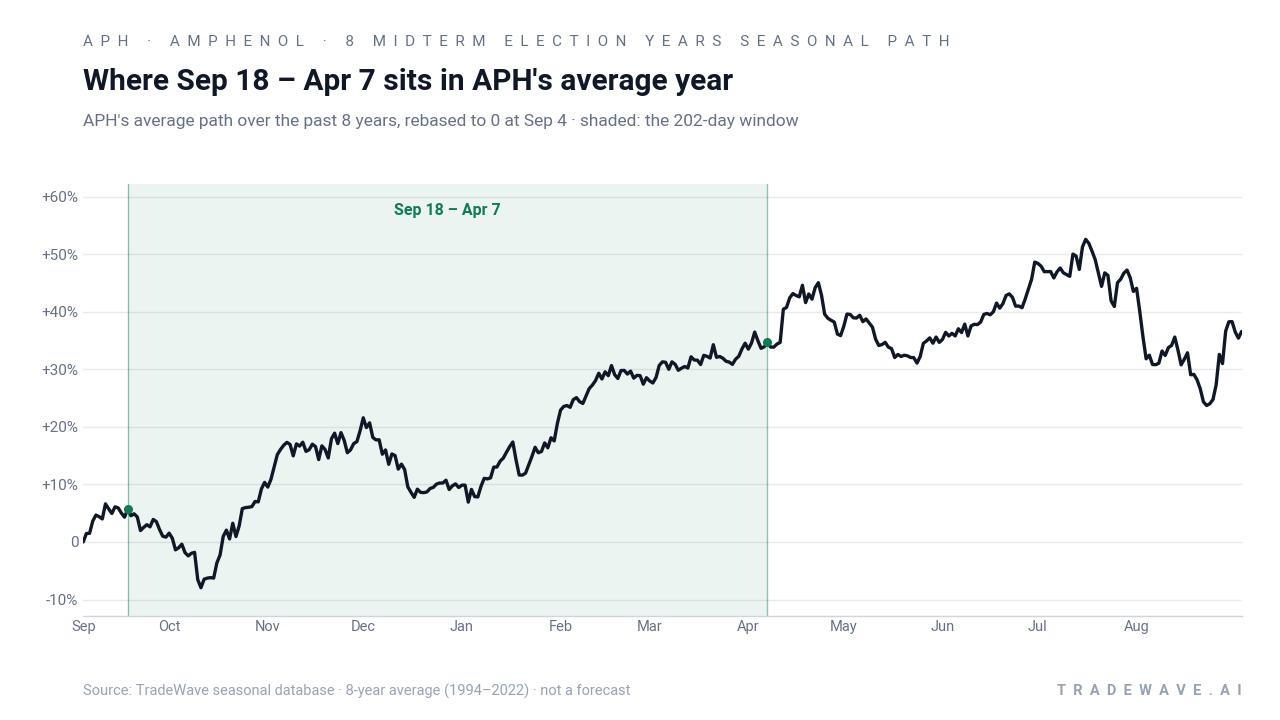
The historical seasonal average path suggests that gains in this Amphenol trading window tend to build steadily rather than in a single burst. The shaded 202-day stretch in the trend chart slopes higher for most of the period, with only modest pauses, which is consistent with a long setup that benefits from persistent buying rather than one-off spikes.
A closer look at yearly ranges shows how much Amphenol has typically swung inside this window before finishing higher.
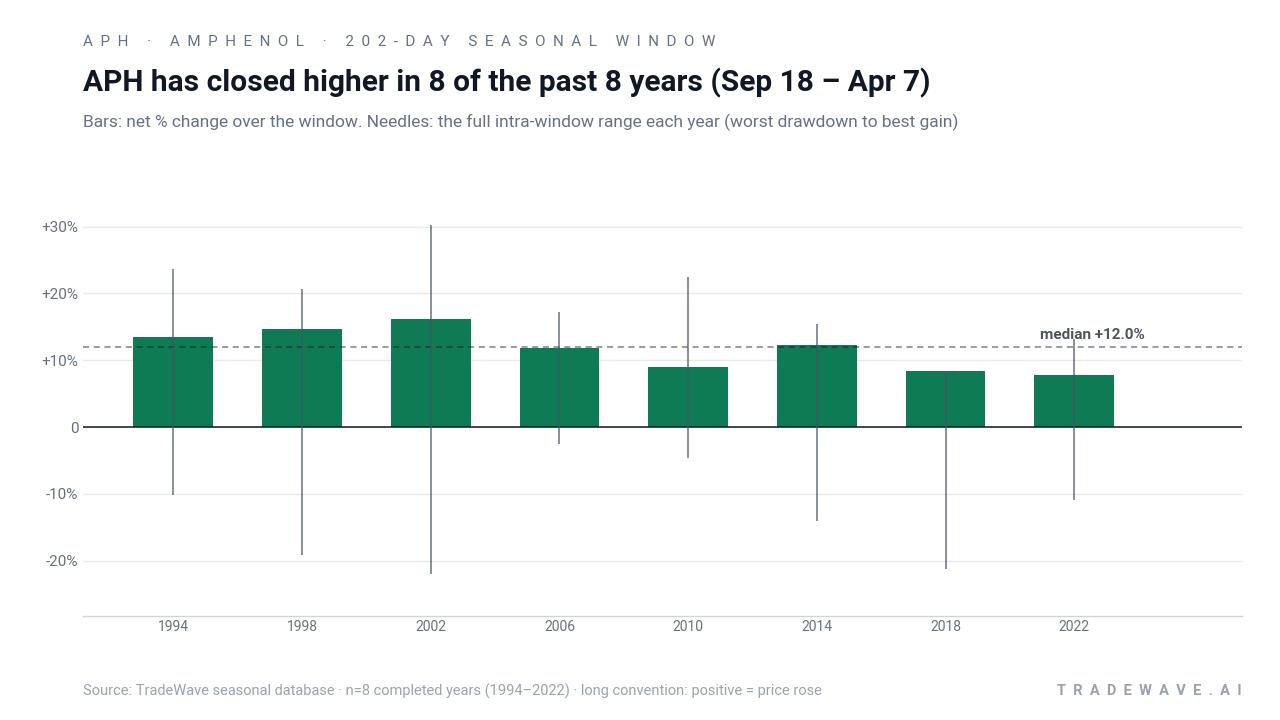
The stacked net / maximum favorable move / maximum adverse move view shows why this pattern has attracted attention. In strong years like 2002, the best intraperiod rally reached 30.18% while the worst drawdown was -21.94%, a reminder that even winning windows can involve deep pullbacks before the final close. In quieter years such as 2006, the stock still gained 11.77% with a relatively shallow -2.51% worst drawdown, illustrating that the same seasonal window can play out with very different volatility profiles.
Put together, the record is striking: 8 for 8 positive outcomes, double-digit average gains, and a long-only profile that has historically rewarded patience through the midterm-to-pre-election transition.
Why does Amphenol (APH) follow this seasonal pattern?
One likely driver is the way the presidential election cycle shapes capital spending and data-center buildouts. Analysts often point to stronger risk appetite and clearer policy visibility as markets move from the midterm election year into the year before the presidential election, which can support orders for electronic connectors and cable components tied to AI and cloud infrastructure. This pattern may also reflect institutional portfolio repositioning around fiscal year-ends, when investors lean into structural growth themes like AI hardware suppliers ahead of the typically stronger pre-election year.
History does not guarantee future results, and the worst intraperiod drawdowns in this window have exceeded -20% in some years even though every sample finished positive.
What is driving Amphenol (APH) today?
Amphenol closed the latest session at 78.55, down 6.4% on the day, after trading between 78.36 and 81.60 on heavy volume of about 12.1 million shares. That pullback leaves the stock about 7.0% below its 52-week high of 84.48 and still far above its 52-week low near 29.02, capping a one-month run of roughly 88.02% that has pushed APH well ahead of its 50-day moving average around 45.80.
Behind the move is a powerful narrative around AI data-center demand and Amphenol’s role as a supplier of high-speed connectors, copper and fiber cables, and other components that sit inside Nvidia-powered racks and similar systems. Bank of America recently highlighted the stock’s parabolic performance and argued that triple-digit AI revenue growth into 2026, combined with higher content per rack and potential M&A, could drive upside to estimates and multi-year organic growth for the company’s electronic connectors and cable components franchise.[1]
The chart below situates the latest pullback against APH’s past year of trading and the median 60-day seasonal path.
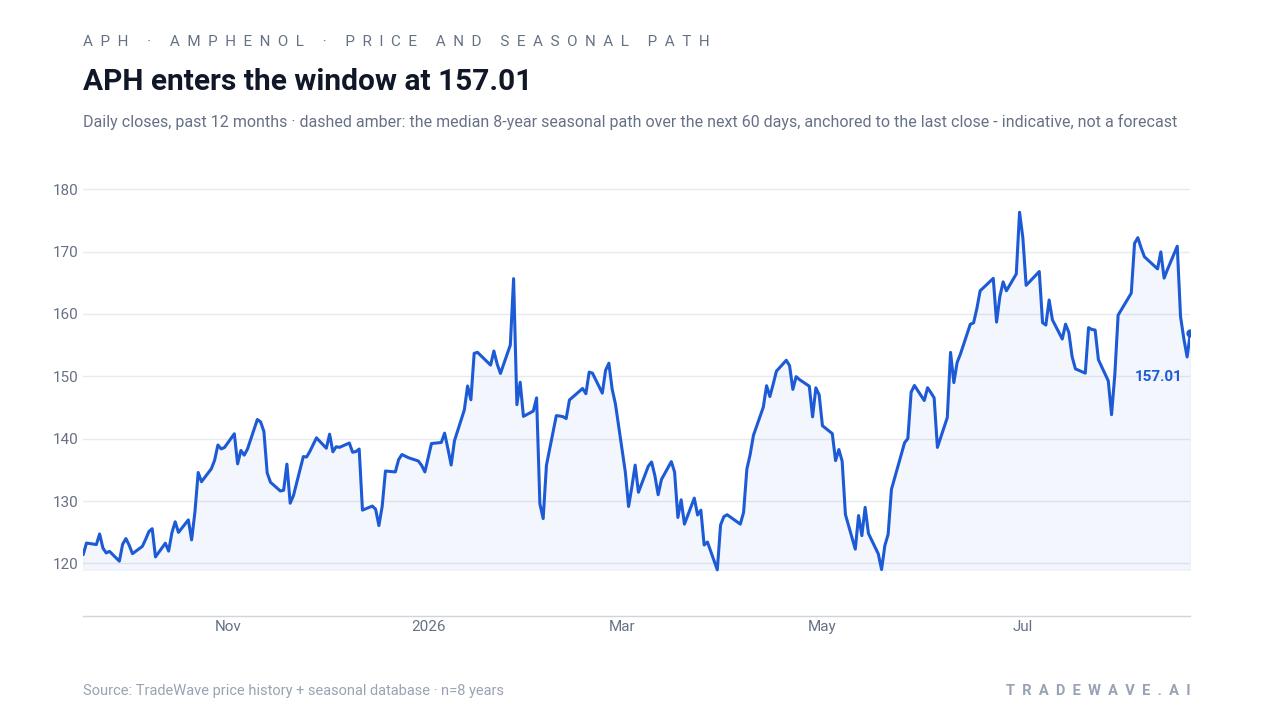
For traders, the setup is a tension between a stock that has already sprinted higher on AI enthusiasm and a historical seasonality profile that has favored long exposure in this exact midterm-year window. The key question over the coming weeks is whether the current pullback proves to be a reset that lines up with the historical pattern, or the start of a regime where AI hardware names trade more on fundamentals than on calendar tendencies.
What should traders watch as this Amphenol (APH) window opens?
First, the calendar: the 202-day window begins on Sep 18 and runs through Apr 7, so price action in the final days before entry will shape how stretched or reset APH looks as it crosses that threshold. A stabilisation above the mid-70s would keep the stock well within the historical range of prior winners, while a deeper slide toward the 50-day moving average would test how much of the AI premium investors are willing to defend.
Second, the intraperiod swings: past midterm-year windows have seen worst drawdowns as deep as -21.94% and best rallies up to 30.18%, so traders will be watching whether early weakness or strength dominates this time. If APH follows the historical seasonal pattern, pullbacks inside the window have tended to be temporary, but a break of prior support levels with expanding volume would argue that this cycle is behaving differently.
Third, the policy and macro backdrop as the market transitions from the concluding midterm election year into the year before the presidential election. Any shifts in fiscal stance, regulation around AI infrastructure, or broader risk appetite could either reinforce the historical tendency for stronger pre-election-year performance or blunt it, especially for a stock tied so closely to AI data-center capex.
Finally, traders will be monitoring how closely APH’s actual path tracks the median seasonal projection over the first 60 to 90 days of the window. A pattern of higher lows and steady grind higher would be consistent with the 8-for-8 history, while a series of lower highs or unusually shallow bounces would be an early sign that this midterm-year slice may not rhyme with the past.
Sources
About this seasonal analysis
Seasonal pattern data is sourced from TradeWave.ai, which analyzes historical price behavior across annual calendar windows going back up to 30 years. Read the full data methodology or the book The 100-Year Pattern by Afshin Moshrefi (2026 edition). Past performance of seasonal patterns does not guarantee future results. This article is for informational purposes only and does not constitute investment advice.