Deere & Company (DE) Has Rallied in 10 of 10 Midterm Fall Windows, Averaging 12.38% Gains
Deere & Company is heading toward a 99-day midterm-year seasonal window that has never produced a loss in this dataset, even as the stock trades near record highs after a strong year-to-date run.
Price as of Sep 10, 2026: $677.94 (last close).
What is the seasonal pattern for Deere & Company (DE)?
Deere & Company has risen in 10 of 10 midterm-year Oct 9 to Jan 15 windows, with an average gain of 12.38% in winning years.
- 10 for 10 in this window, with Deere & Company averaging 12.38% gains in winning years across the last 10 midterm election cycles.
- Seasonal window runs from Oct 9 through Jan 15, spanning 99 days that have historically favored long exposure in DE.
- Percent Profitable is 100%, with 10 winners and 0 losers in the TradeWave sample for this Deere & Company trading window.
- Median profit of 11.4% shows that typical outcomes have been solidly positive, not just skewed by a single outlier year.
- TradeWave Ratio of 1.99 indicates that price has typically traveled meaningfully in the trade direction within the window, while the Sharpe ratio of 1.83 reflects strong risk-adjusted returns.
- Intraperiod swings have included double-digit drawdowns in some years, so the historical seasonality comes with real volatility even in an all-winner sample.
According to historical data from TradeWave.ai, this midterm-year fall stretch has behaved very differently from an average quarter for Deere & Company. The next section walks through how that pattern has played out in prior cycles and what it means as the 2026 window approaches.
How has Deere & Company (DE) traded in the upcoming Oct 9 to Jan 15 window?
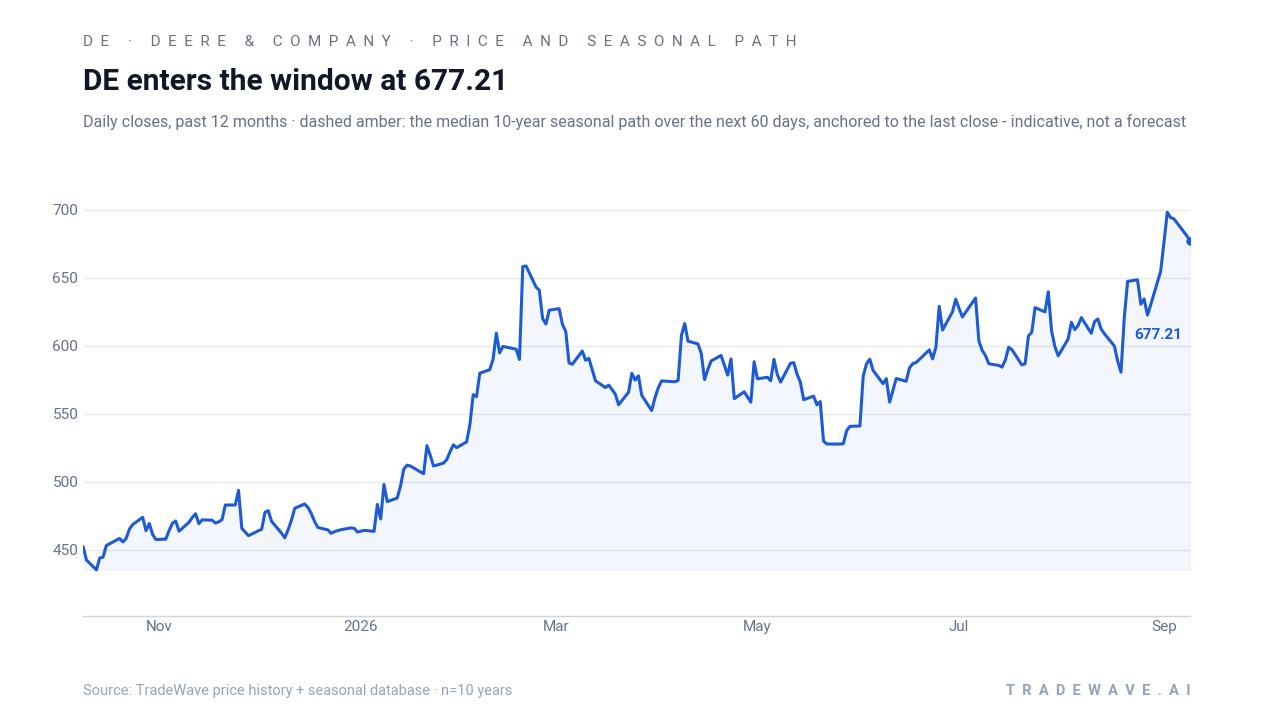
Deere & Company has closed higher in every single Oct 9 to Jan 15 window across the last 10 midterm election years, averaging a 12.38% gain over each 99-day stretch. The stock finished Friday at 677.94, up 0.1% on the day and roughly 38% year to date, leaving it not far from its 52-week high of 705.88. That combination of a strong historical seasonal trend and a stock already near the top of its range is what makes this particular window stand out for traders watching the DE seasonal trend.
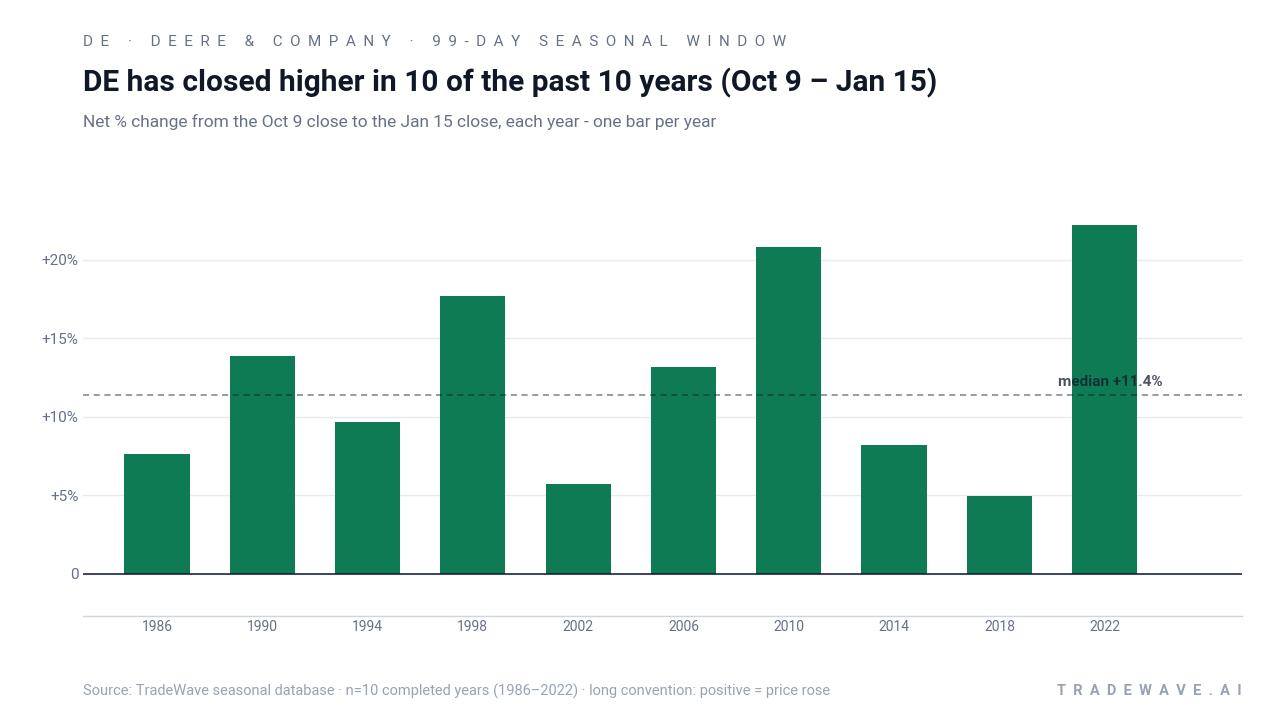
Because this pattern is grouped by the presidential election cycle, it reflects how Deere has behaved specifically in the late part of midterm election years, not just in any random fourth quarter. That matters for an industrial name tied to capital spending and farm economics, since policy uncertainty, tariff shifts and budget debates often cluster in this phase of the cycle.
Historically, the trade direction for this window has been long, and the record is clean: 10 winners, 0 losers, for a Percent Profitable reading of 100%. Average gains of 12.38% and a median profit of 11.4% suggest the typical outcome has been a double-digit advance rather than a grind higher. Add it up and stacking this 99-day slice across the 10 midterm years in the sample would have produced a 217% cumulative return.
The per-year table shows how that has played out in practice. The weakest year in the sample was 2002, when DE still gained 5.73% between Oct 9 and Jan 15. The strongest was 2022, with a 22.17% net return over the same calendar window. In between sit years like 2010, when the stock rallied 20.81%, and 1998, when it climbed 17.7%.
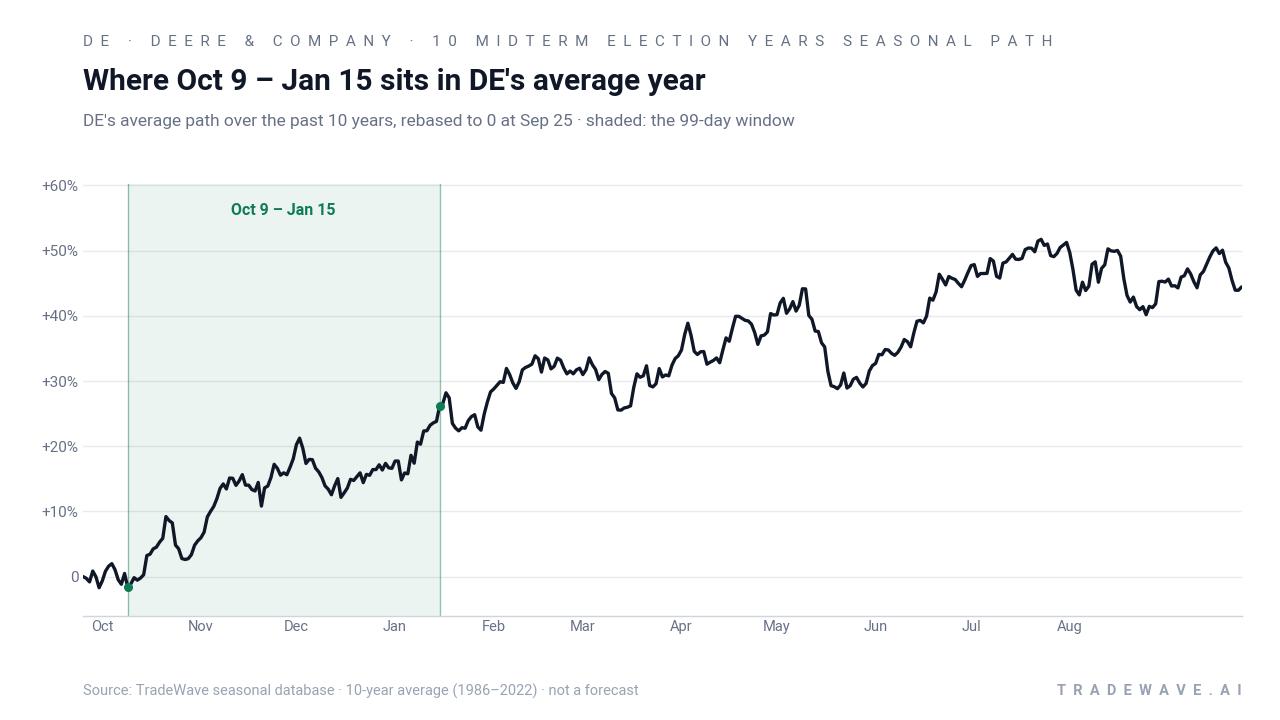
Yearly net and intraperiod swings highlight how much room DE has historically had to run, and to wobble, inside this window.
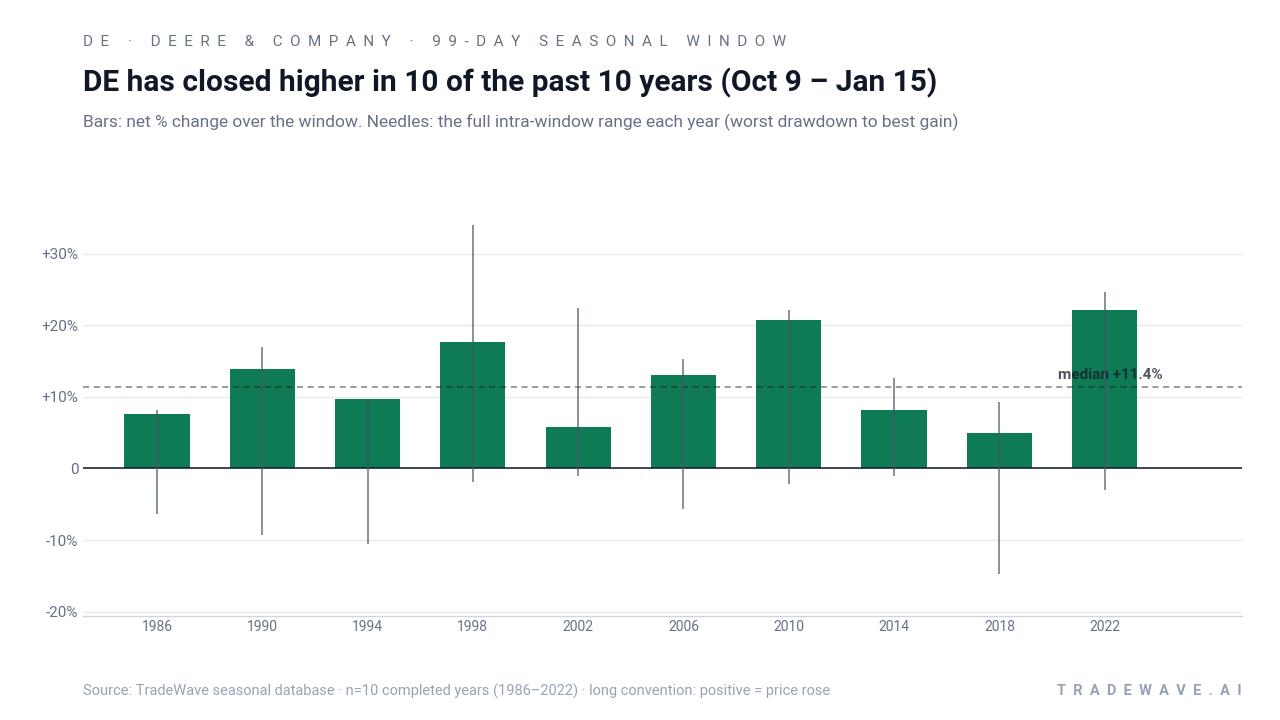
The intraperiod profile is not a straight line. Maximum favorable moves have been large in several years, such as 33.96% in 1998 and 24.67% in 2022, showing how far DE has sometimes run from its Oct 9 starting point before the window closed. At the same time, maximum adverse moves have reached as deep as a 14.71% drawdown in 2018 and more than 10% in 1994, reminding traders that even winning years have included sharp pullbacks.
Looking across the trend chart, the typical pattern shows gains starting relatively early in the window and then building into the turn of the year, with only brief pauses. The bars with full MAE and MFE ranges reinforce that picture: most years finish solidly positive, but the needles extend both above and below, capturing the swings that long holders had to sit through to capture the seasonal edge.
In short, the pattern is clear: this has been a consistently bullish 99-day stretch for DE in midterm election years, with every historical iteration finishing in the green and several delivering outsized double-digit gains.
Why does Deere & Company (DE) follow this seasonal pattern?
One likely driver is the clustering of capital spending decisions and equipment orders around calendar year-end, as farm operators and industrial customers lock in budgets and tax planning. Analysts have also pointed to sector rotation into cyclicals late in midterm election years, when policy uncertainty often eases and investors position for the historically stronger pre-election year. For a machinery name tied to crop economics and infrastructure, that combination of budget timing and macro sentiment may help explain why this specific fall-to-winter window has been so favorable in past cycles.
History does not guarantee future results, and the worst intraperiod drawdowns in this window have been sizable even in years that ultimately finished higher.
What is driving Deere & Company (DE) today?
Deere & Company shares ended the latest session at 677.94, up 0.73 points or 0.1%, extending a year-to-date gain of about 38% that has pushed the stock to within roughly 4.0% of its 52-week high of 705.88. Trading volume of 1.17 million shares sat below the 20-day average of about 1.37 million, suggesting a relatively calm tape as investors digest a strong run and look ahead to the next leg of the presidential election cycle.
In February 2026, Deere reported fiscal first-quarter net income of $656 million on revenue of $9.61 billion and flagged an expected $1.2 billion tariff hit for the full fiscal year, even as it raised net income guidance to a range of $4.5 billion to $5 billion.[2] In March 2026, coverage highlighted that DE was trading at a premium valuation to the broader machinery group, with forward earnings multiples above industry peers and a one-year gain of roughly one-third, while also noting that low crop prices and weak farm economics were acting as a brake on a more aggressive recovery in large agriculture equipment demand.[3]
Earlier commentary in early 2026 and late 2025 focused on Deere’s precision agriculture push and its role as a core agriculture stock, but those pieces also underscored the cyclical nature of the business and the sensitivity to tariffs, commodity prices and capital spending cycles.[1][4][5] That backdrop helps frame why a historically strong seasonal window into year-end could matter: it arrives just as investors weigh premium valuations, policy risk and the transition from a concluding midterm election year into the pre-election year, a phase that has often been friendlier to cyclicals.
The chart below situates the latest move in its recent multi-month context alongside the indicative 60-day seasonal projection.
What should traders watch as this Deere & Company (DE) window approaches?
First, the calendar. The 99-day window begins on Oct 9 and runs through Jan 15, so any shift in behavior as DE moves from late September into early October will be watched closely against the historical seasonality. Traders will be looking to see whether the stock can hold above its 50-day moving average, currently around 621.17, and whether pullbacks stay shallow compared with the double-digit intraperiod drawdowns seen in some past years.
Second, the policy and macro tape. Deere sits at the intersection of tariffs, farm incomes and industrial spending, and the late part of the midterm election year often brings clarity on trade and fiscal policy that can reset expectations for the pre-election year. Any updates on tariff exposure, crop price trends or capital spending plans could either reinforce or challenge the historical pattern that has favored longs in this specific fall-to-winter stretch.[2][3]
Third, price behavior inside the window itself. In prior cycles, some of the strongest years saw DE rally early in the window and then consolidate, while others featured a deeper early drawdown before a sharp recovery. If the stock quickly pushes to or through its 52-week high near 705.88 and holds that breakout, it would rhyme with the more powerful historical years. A deeper shakeout of 10% or more from the Oct 9 starting point would still be consistent with the pattern’s MAE history but would test the conviction of anyone leaning on the DE seasonal trend.
Finally, watch how this single-stock pattern interacts with broader sector and index flows. Deere is a bellwether for machinery and agriculture, and a strong or weak run through this window could influence sentiment toward industrial cyclicals more broadly. If the stock tracks its historical midterm-year seasonal pattern and grinds higher into January, it would fit the narrative of investors rotating toward cyclicals ahead of the pre-election year. A clear break from that script would be an early signal that this cycle is behaving differently from the last 10 midterm-year iterations.
Sources
- Finviz - Deere (DE)'s Precision Agriculture is Quite a Story, Says Jim Cramer
- Yahoo Finance - Deere (DE)’s Precision Agriculture is Quite a Story, Says Jim Cramer
- Finviz - DE Gains 33% in a Year: What's the Right Strategy for Investors Now?
- Yahoo Finance - Is Deere (DE) Pricing Reflect Long Term Value After Recent Agriculture Demand Focus
- MarketBeat - Promising Agriculture Stocks To Consider - November 29th
About this seasonal analysis
Seasonal pattern data is sourced from TradeWave.ai, which analyzes historical price behavior across annual calendar windows going back up to 30 years. Read the full data methodology or the book The 100-Year Pattern by Afshin Moshrefi (2026 edition). Past performance of seasonal patterns does not guarantee future results. This article is for informational purposes only and does not constitute investment advice.