Altria (MO) Has Risen in 10 of 10 Midterm Fall Windows, Averaging 7.05% Gains
Altria is approaching a late-September trading window that has been quietly powerful in past midterm election years, just as shares trade near 52-week highs after a strong 2026 rebound.
Price as of Sep 23, 2026: $68.95 (last close).

What is the seasonal pattern for Altria (MO)?
Altria has risen in 10 of 10 midterm-year Sep 27–Oct 26 windows, with an average gain of 7.05% in winning years.
- 10 for 10 in this window, averaging 7.05% gains in winning years across the last 10 midterm election cycles.
- Seasonal window runs from Sep 27 to Oct 26, aligned with the late part of the midterm election year as markets pivot toward the pre-election year.
- Percent Profitable is 100.0%, with 10 winners and 0 losers in the historical sample.
- Median profit of 6.4% and a Sharpe ratio of 2.44 point to unusually consistent upside for a 30-day stretch.
- TradeWave Ratio of 2.27 suggests price has typically traveled meaningfully in the long direction within the window, even before final closes.
- Intraperiod drawdowns have occurred but have historically been contained relative to the upside moves, with no losing closes in the sample.
According to historical data from TradeWave.ai, this upcoming late-September stretch has behaved very differently from an average month for Altria in prior midterm election years. The next section walks through what that pattern has looked like and how it fits into today’s setup.
How has Altria (MO) traded in the late-September midterm window?
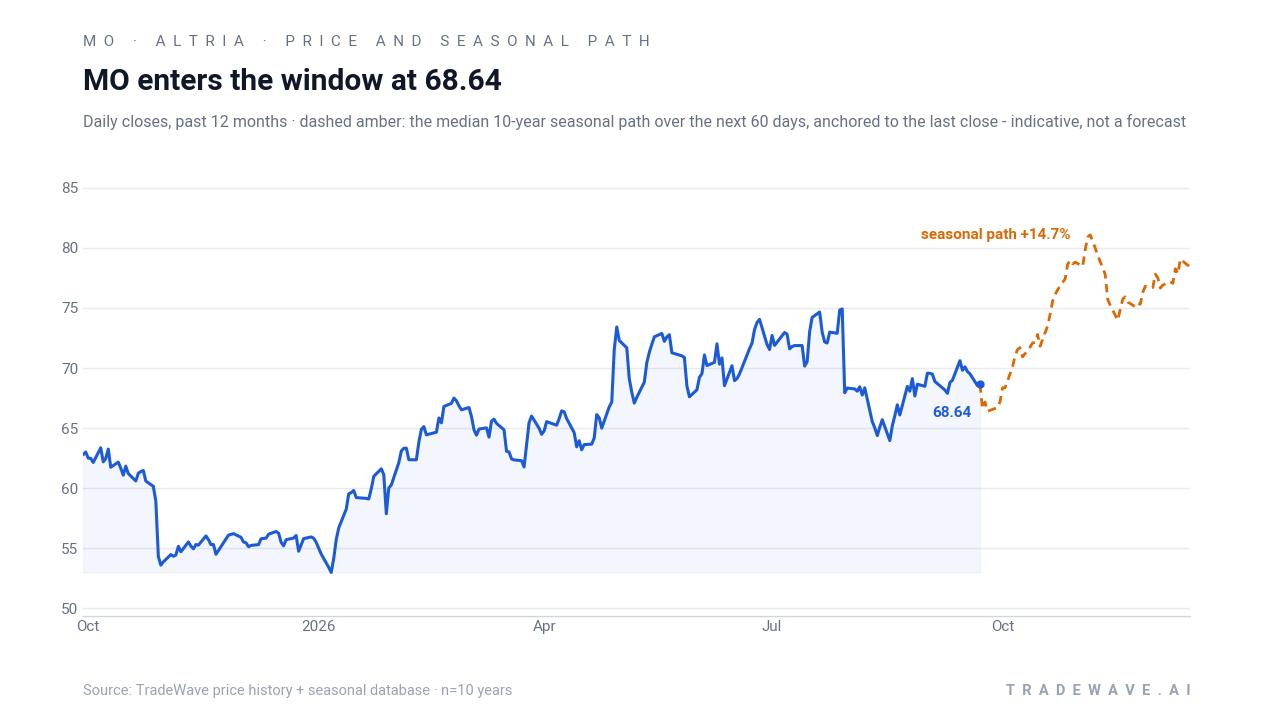
Altria has closed higher in every single Sep 27–Oct 26 window across the last 10 midterm election years, averaging a 7.05% gain for longs. The stock heads toward this year’s iteration at $68.95, up 19.63% year to date and about 10.5% below its 52-week high of $77.06.[8] That combination of a strong year, some distance from the highs and a historically bullish 30-day window gives this otherwise slow-moving tobacco name an unusually tactical feel as the calendar flips into October.
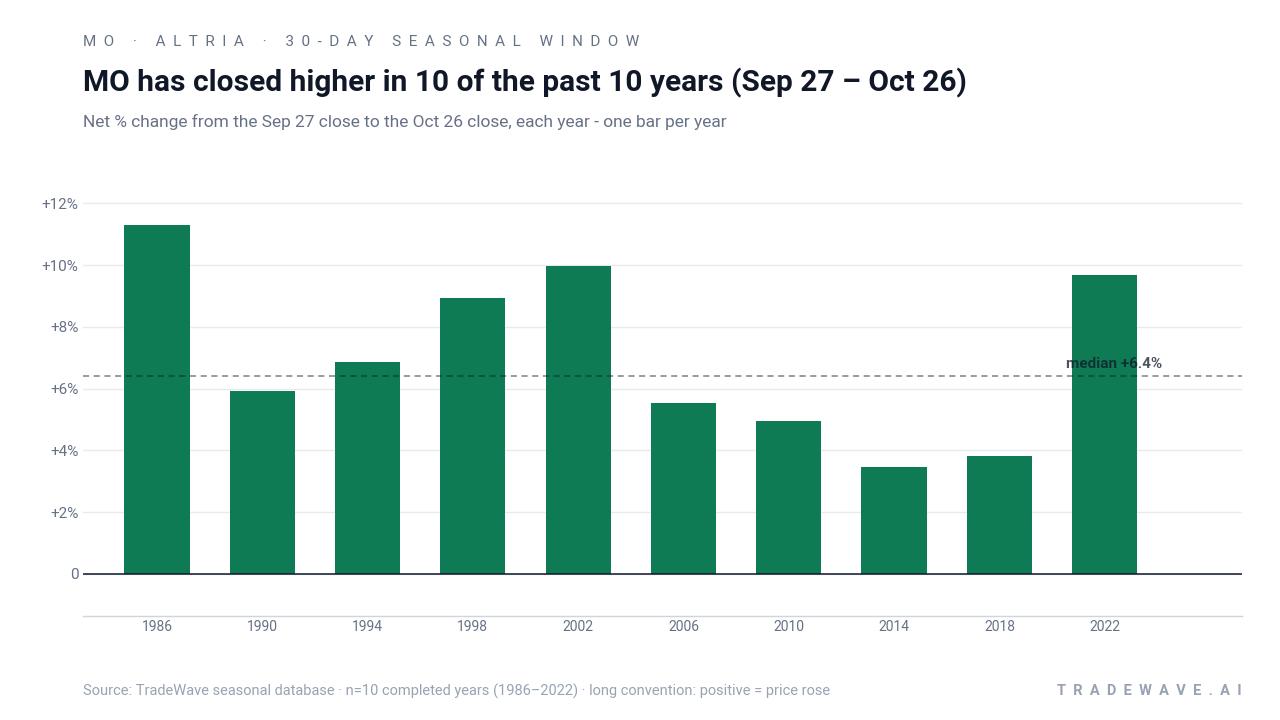
Because this pattern is grouped by the presidential election cycle, it reflects how Altria has behaved specifically in the late part of midterm election years, just before markets move into the historically stronger pre-election year. That matters for a regulated, dividend-heavy name like Altria, where policy expectations, tax debates and sector rotation around the Washington calendar can subtly shape flows.
Across the 10 completed midterm-year windows since 1986, the average profit for longs has been 7.05%, with a median gain of 6.4%. The strongest year in the sample was 2002, when Altria rallied 9.99% between Sep 27 and Oct 26, while the softest outcome was still a positive 3.47% in 2014. For a 30-day holding period in a mature consumer defensive stock, that is a punchy profile.
The intraperiod path has not been a straight line. In 2002, the best point-to-peak move, or maximum favorable excursion, reached 16.46% before the window closed with a 9.99% gain, while the worst drawdown from entry, or maximum adverse excursion, was a 6.5% dip. In quieter years like 2010, the peak run-up was 5.08% and the worst pullback was 1.46%, showing that even the “easy” years came with some noise.
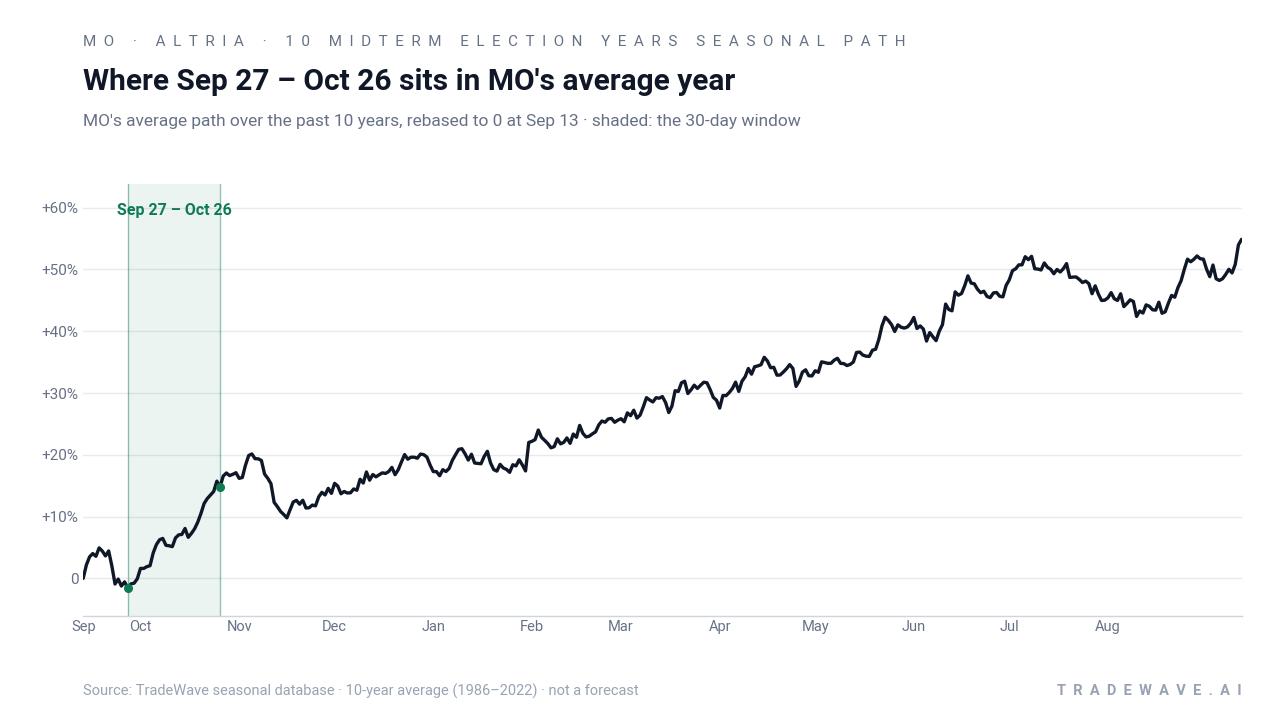
The trend chart of Altria’s average year shows this late-September to late-October stretch as a clear upslope within the broader calendar, with gains tending to build steadily rather than spike only at the end. That suggests the typical pattern has been a grind higher across the month, not a single headline-driven jump.
A second view stacks each year’s net result with its best and worst intraperiod swings.
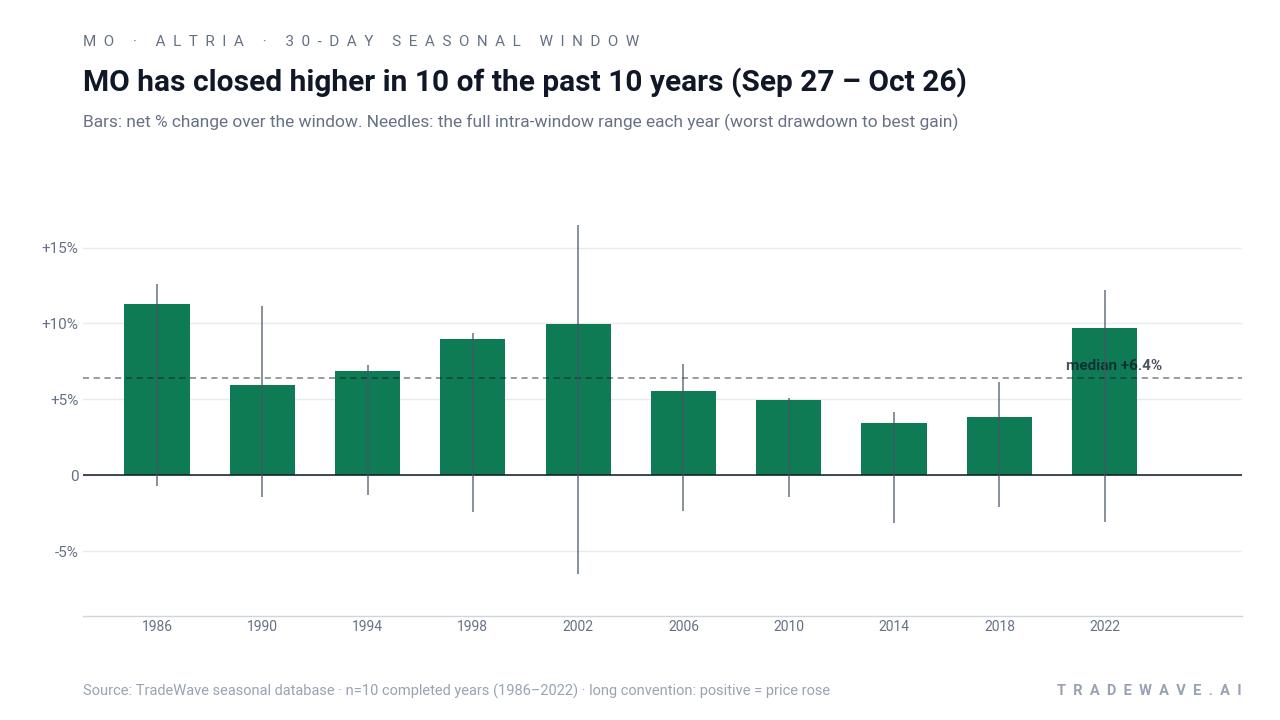
Those bars show that while every year finished green, the full range between worst drawdown and best gain has often been wide, especially in 1998, 2002 and 2022. In 2022, for example, Altria’s best run-up within the window reached 12.18% and its worst pullback was 3.07%, yet the final close still locked in a 9.68% gain. Add it up and stacking this 30-day window across the 10 midterm cycles compounds to a cumulative 97.03% return.
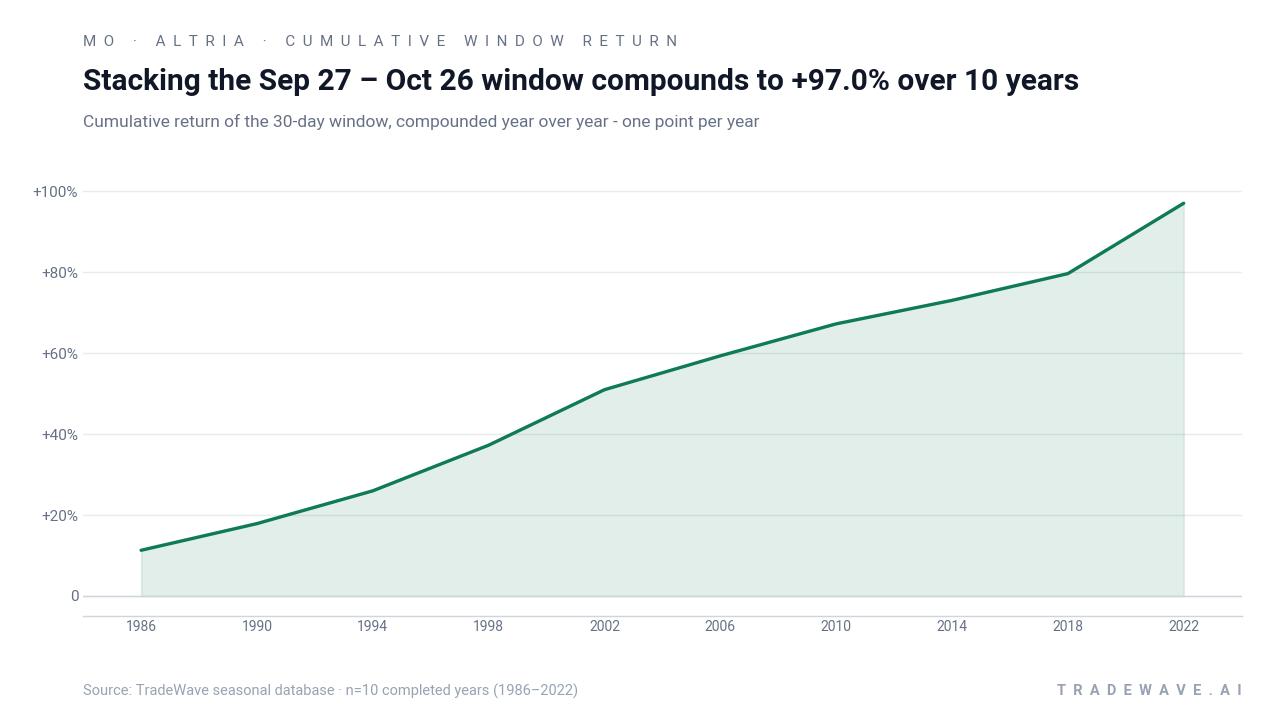
History does not guarantee future results; adverse excursions can still be meaningful even in windows that have always finished higher.
Why does Altria (MO) follow this seasonal pattern?
One likely driver is the way the policy calendar and tax debates cluster in the late stages of midterm election years, which can ease or sharpen regulatory fears around tobacco just as investors position for the pre-election year. Analysts have also pointed to portfolio rebalancing into high-dividend, defensive names in the fourth quarter as funds lock in income streams ahead of year-end. This pattern may reflect that combination of regulatory clarity and yield-focused rotation, which has historically favored Altria in this specific slice of the calendar.
What is driving Altria (MO) today?
Altria shares closed Thursday at $68.95, up 0.45% on the day, leaving the stock up 19.63% so far in 2026 and about 10.5% below its 52-week high of $77.06.[8] The move caps a year in which investors have looked past modest earnings noise and ongoing cigarette volume declines to focus on cash returns and guidance stability.
On Jul 30, Altria reported second-quarter adjusted EPS of $1.48, a hair below the $1.49 consensus, with revenue roughly in line at $5.36 billion; management nudged full-year adjusted EPS guidance to a range of $5.61 to $5.72.[4] The stock sold off on the day as traders reacted to the miss and commentary around cigarette shipment volumes, but the guidance update reinforced the idea that earnings power remains intact even as the core combustible business shrinks.[6]
Earlier in the year, first-quarter results on Apr 30 showed adjusted EPS of $1.32 versus a Zacks consensus of $1.24 and revenue of $4.76 billion, beating estimates and helping reset expectations after a choppy 2025.[2] In the background, sector commentary has highlighted ongoing declines in domestic cigarette unit volumes, including an adjusted 4.5% year-on-year drop in the second quarter of 2026, which keeps pressure on long-term growth and pushes more focus onto pricing, cost control and non-combustible products.[7]
Analyst sentiment remains constructive, with a consensus Buy rating and a blended price target around $69.90 from Finviz’s aggregated sources, roughly in line with where the stock trades today.[8] That suggests Wall Street sees Altria as fairly valued on near-term fundamentals, leaving less room for multiple expansion and more emphasis on the dividend and tactical trading windows like the one that opens on Sep 27.
The chart below situates the latest move against the past year’s trading range and a historical seasonal projection.
What should traders watch in this Altria (MO) window?
First, the calendar: the 30-day window begins on Sep 27 and runs through Oct 26, overlapping the final stretch of the midterm election year and the run-up to Altria’s next earnings report, currently slated for Oct 29.[4] Historically, this has been a period where the stock has tended to grind higher rather than spike, so traders will be watching whether early October price action tracks that pattern or diverges sharply.
Second, levels matter. With shares about 10.5% below the 52-week high, any push back toward the mid-$70s during the window would echo prior years where the maximum favorable move ran into double digits. A failure to hold the high-$60s, especially if accompanied by renewed concern over cigarette volumes or regulatory headlines, would be a clear break from the historical script and could signal that macro or policy forces are overwhelming the usual seasonal tailwind.[6]
Third, the policy and macro backdrop will be in focus. As the midterm election year wraps up, investors will parse fiscal and regulatory signals for clues on consumer defensives, including any shifts in tobacco regulation or tax policy that could affect Altria’s cash flows.[5] If the stock can absorb that noise and still behave like prior midterm-year windows, it would reinforce the idea that this late-September seasonal pattern remains intact.
Finally, watch how the stock trades into and out of the Oct 29 earnings date relative to the window’s historical end.[4] In past cycles, strong windows have often coincided with investors positioning ahead of results and then reassessing once the numbers hit. A firm tape through the window followed by orderly post-earnings trading would rhyme with the historical pattern, while a sharp pre-earnings selloff or an unusually violent reaction could mark a regime shift for this long-running seasonal edge.
Sources
- Public.com - Altria (MO) Earnings: Latest Report, Earnings Call & Financials
- Yahoo Finance (Zacks) - Altria (MO) Q1 Earnings and Revenues Surpass Estimates
- Yahoo Finance (Zacks) - Altria (MO) Earnings Expected to Grow: What to Know Ahead of Next Week's Release
- Yahoo Finance (Zacks) - Altria (MO) Q2 Earnings and Revenues Lag Estimates
- Altria Investor Relations - Altria Reports 2025 Fourth-Quarter and Full-Year Results
- Yahoo Finance - Why Altria Stock Is Sinking Today
- MarketBeat - Altria Group (MO) Options Chain & Prices 2026
- Finviz - MO - Altria Group Inc Stock Price and Quote
- Yahoo Finance (Simply Wall St) - 19% Of This Altria Group Insider's Holdings Were Sold
About this seasonal analysis
Seasonal pattern data is sourced from TradeWave.ai, which analyzes historical price behavior across annual calendar windows going back up to 30 years. Read the full data methodology or the book The 100-Year Pattern by Afshin Moshrefi (2026 edition). Past performance of seasonal patterns does not guarantee future results. This article is for informational purposes only and does not constitute investment advice.