Advanced Micro Devices (AMD) Has Dropped in 10 of 10 Midterm Autumn Windows for Shorts
Advanced Micro Devices is heading toward a late-September seasonal window that has produced declines in every midterm election year in the sample, just as the stock trades near record highs after a powerful AI-driven run.
Price as of Aug 25, 2026: $479.18 (last close).

What is the seasonal pattern for Advanced Micro Devices (AMD)?
Advanced Micro Devices has fallen in 10 of 10 midterm-year Sep 25–Oct 21 windows, with an average gain of 17.13% in winning years for a short position.
- 10 for 10 in this window for shorts, with an average profit of 17.13% across winning years.
- Seasonal window runs from Sep 25 for 27 days, grouped across the last 10 midterm election years.
- Percent Profitable is 100%, with 10 winners and 0 losers for the short trade direction.
- Cumulative return from repeatedly shorting this window compounds to 375% over the sample.
- TradeWave Ratio of 2.32 signals that price typically travels meaningfully in the trade direction within the window.
- Sharpe ratio of 2.09 indicates historically strong risk-adjusted returns for this specific short window.
According to historical data from TradeWave.ai, this late-September stretch has behaved very differently from an average month in AMD’s trading year. The next section walks through what that pattern has looked like across past midterm election cycles.
How has Advanced Micro Devices (AMD) traded in the late-September midterm window?
Advanced Micro Devices has closed lower in every single Sep 25–Oct 21 window across the last 10 midterm election years, with shorts averaging 17.13% profits over 27 days. Today the stock trades at $479.18, up 4.9% on the session and roughly 120.98% higher year to date, leaving it elevated after a powerful AI-driven surge.[1][2]
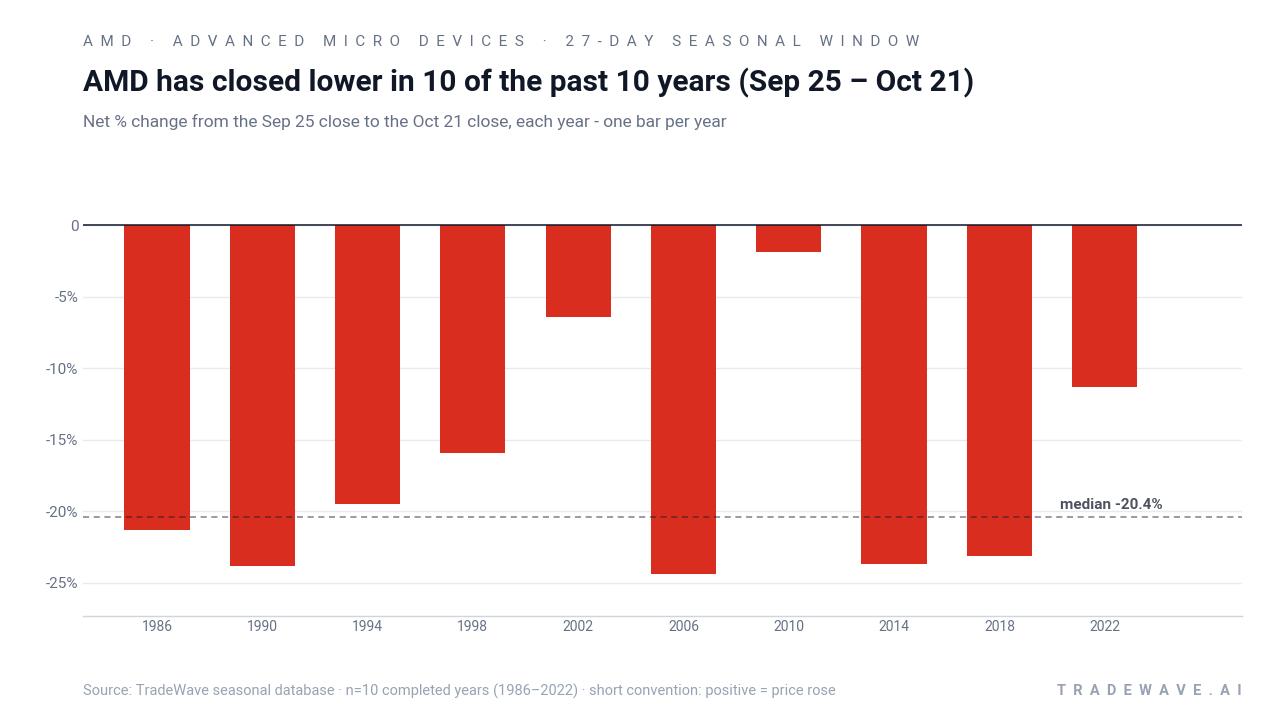
The election-cycle framing matters here. The sample covers the last 10 midterm election years, a phase that often brings tighter financial conditions, regulatory noise and portfolio de-risking before the historically stronger “year before the presidential election” that follows.
Within that context, the Sep 25–Oct 21 window has been unusually one-sided for AMD. Percent Profitable sits at 100%, with 10 winners and 0 losers for the short direction, and a cumulative return of 375% from stacking the trades across the sample. The median profit for shorts is 20.4%, which means the typical winning year has delivered a sizeable move rather than a marginal drift.
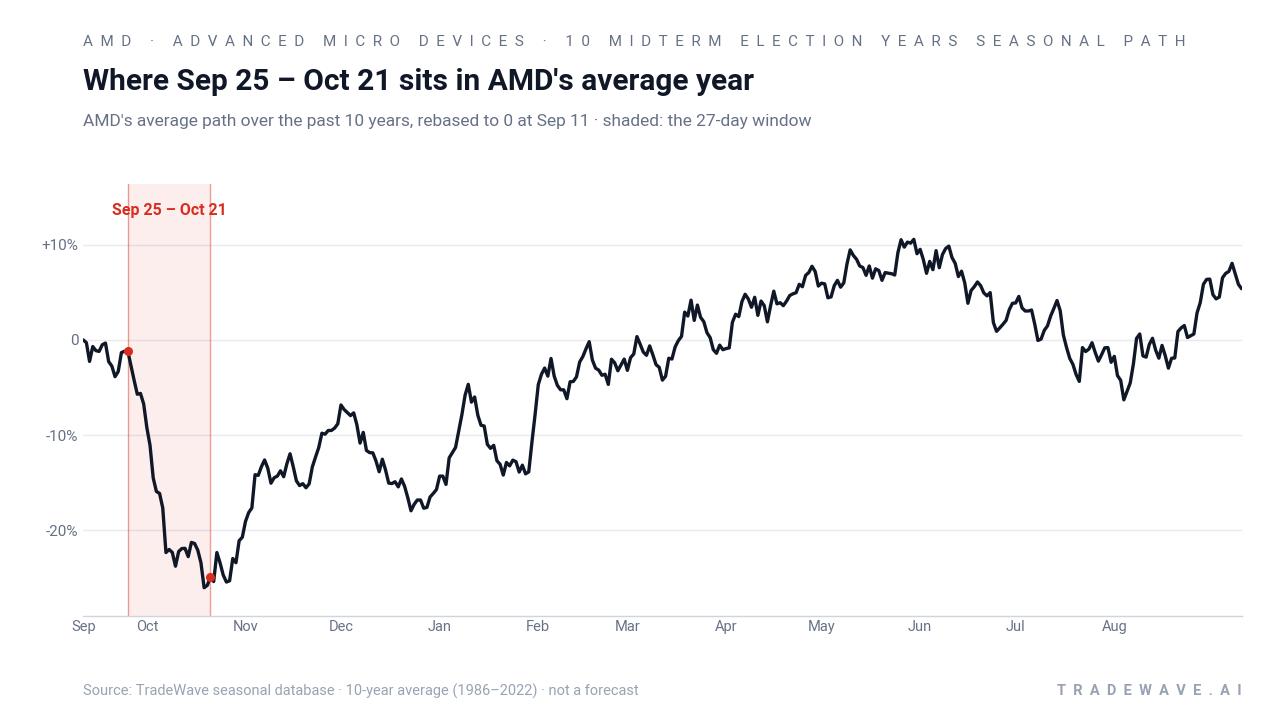
A second view shows how far AMD has tended to move in both favorable and adverse directions inside the window.
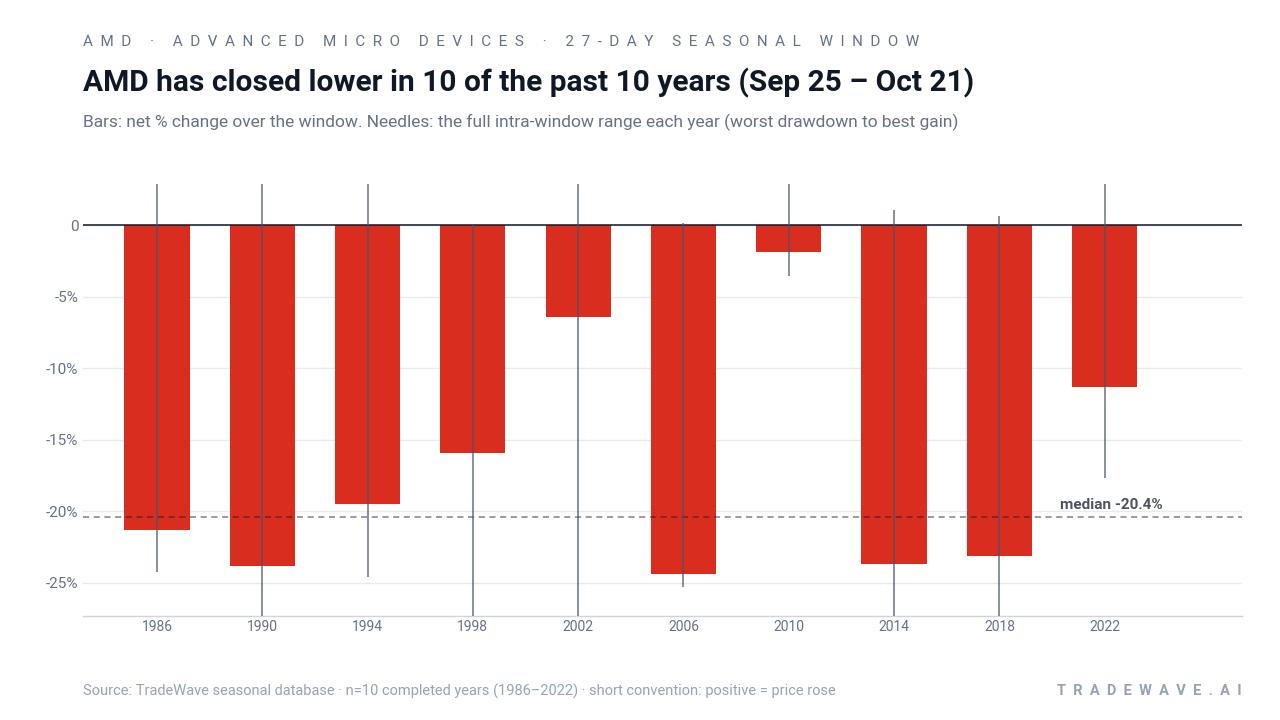
The per-year table shows why this AMD seasonal trend has caught quant desks’ attention. In 1990, a short entered around Sep 25 would have finished the window with a 23.81% gain as the stock slid from roughly 2.62 to 2.00, while the worst intraperiod drawdown from entry reached about 30.95% in favor of the short. In 2002, the net profit was a more modest 6.41%, but the worst drawdown from entry stretched to 47.72%, underscoring how violent the path can be even when the final result is positive for the short.
Across the sample, maximum favorable excursions often extend well beyond the final net move, while maximum adverse excursions show that AMD can stage sharp countertrend rallies inside the window before rolling over again. That mix of large MFE and sizable MAE points to a high-variance stretch where both squeezes and air pockets have been common.
The cumulative chart of this 27-day window compounds to a 375% gain for the short direction over the 10 midterm years in the dataset. Add it up: every iteration has contributed positively to that stack, with no offsetting losing years to dilute the profile.
History does not guarantee future results, and the intraperiod drawdowns (MAE) in several years show that even winning windows have carried meaningful risk for anyone leaning into the pattern.
Why does Advanced Micro Devices (AMD) follow this seasonal pattern?
One likely driver is the clustering of AMD’s product launches and guidance updates around the autumn conference and earnings season, when expectations for next year’s AI and data center spending get reset. Analysts have also pointed to institutional portfolio rebalancing in midterm election years, as managers trim high-beta semiconductor exposure ahead of policy and rate uncertainty.[1][2] This window may also reflect options expiration dynamics, with heavy call positioning built up over the summer unwinding into September and October.
What is driving Advanced Micro Devices (AMD) today?
Advanced Micro Devices closed at $479.18, up 4.9% on the day, and has surged about 120.98% so far in 2026 as investors crowd into AI and data center plays.[1][2] The stock sits well above its 50-day moving average of roughly $509.60 and has pulled back about 18.1% from its 52-week high of $584.73, leaving it in a volatile consolidation after a steep run.
The latest leg higher followed AMD’s Aug 4 Q2 FY26 report, where revenue of $11.54 billion and earnings of $1.66 per share topped expectations, with sales up about 50.1% year over year as AI accelerator demand ramped.[2] That print helped repair sentiment after February’s Q4 earnings, when softer guidance triggered a round of analyst target cuts and rating tweaks even as AMD beat on the quarter itself.[4]
Analyst services still frame the stock as a “Moderate Buy,” with a consensus price target around $582.30 from providers including ChartMill and MarketBeat, implying upside from current levels but with growing debate over valuation after the AI-driven melt-up.[2][3][5] Sector peers such as NVIDIA and Broadcom remain key reference points for how much investors are willing to pay for AI exposure, and AMD’s multiple has expanded alongside that group.[1][2]
At the same time, some institutional research has flagged a more cautious undercurrent. MarketBeat, citing Quiver Quantitative, highlighted 99 insider sales over the past six months with no offsetting insider purchases, including notable selling by CEO Lisa Su, which some traders read as a negative sentiment signal at these price levels.[7] Macro commentary in the same coverage pointed to more than $10 billion of planned capital spending to expand packaging and AI manufacturing capacity in Taiwan, a long-term growth lever that also raises questions about leverage and cycle timing if AI demand ever cools.[7]
The chart below situates the latest move in its recent multi-month context and overlays the historical seasonal path for the next two months.
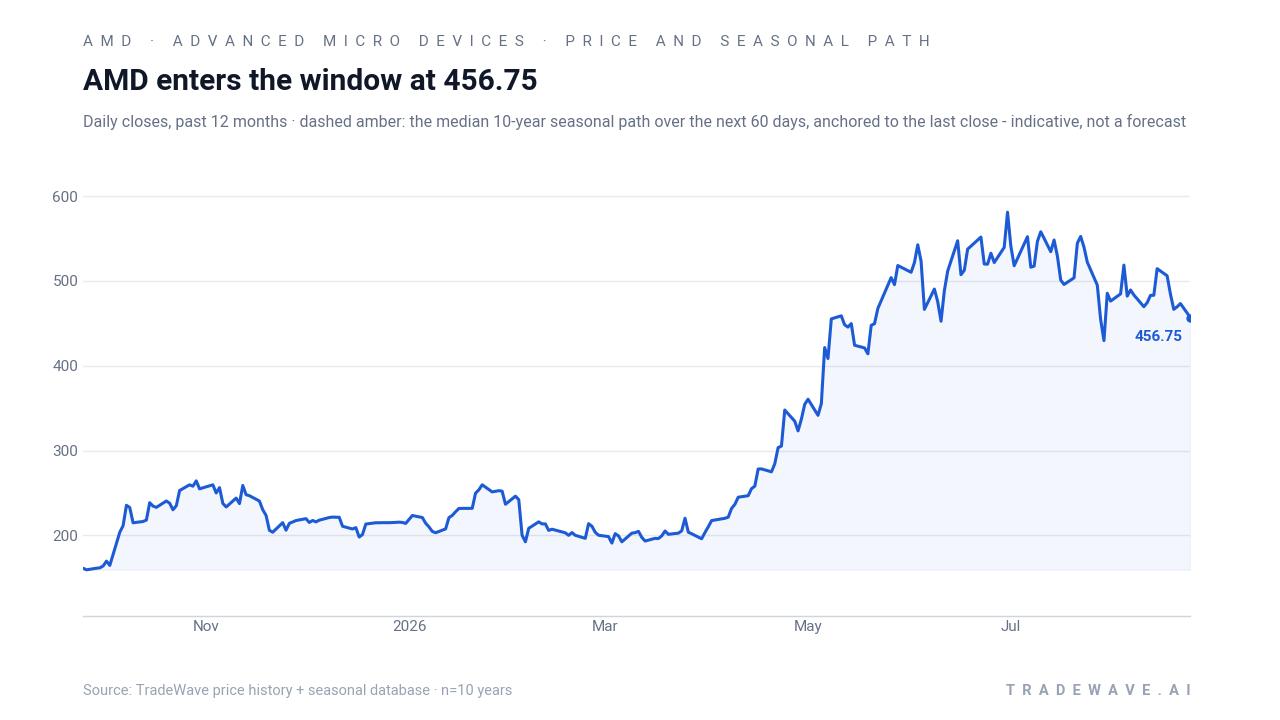
Looking ahead, the next scheduled catalyst is AMD’s Q3 FY26 earnings, expected around Nov 2, which falls just after the seasonal window closes.[2] That timing means the Sep 25–Oct 21 stretch will likely be driven more by positioning, macro data and sector flows than by fresh company-specific guidance.
What should traders watch as AMD approaches this seasonal window?
First, the calendar: the 27-day window begins on Sep 25 and runs through Oct 21, squarely in the late part of the midterm election year and just before markets pivot into the historically stronger “year before the presidential election” phase. Behavior inside this slice will show whether AMD continues to respect its midterm-year pattern or starts to trade more like the pre-election year regime that often favors risk-on tech exposure.
Second, levels and volatility. Traders will be watching how AMD behaves around the $450–$500 band, the recent consolidation zone, and whether rallies toward the 52-week high near $584.73 get sold into or extended.[1] A pattern of lower highs and heavier intraday reversals into late September would rhyme with prior midterm windows, while a clean breakout and sustained hold above the 50-day moving average would mark a clear departure from the historical script.
Third, insider and positioning signals. The recent cluster of insider sales with no reported insider buying has already raised eyebrows.[7] If that trend continues into September, or if options data show a build-up in downside hedging rather than speculative call buying, it would align with the historical tendency for AMD to struggle in this window. A reversal, with insiders stepping back from selling or speculative call activity re-accelerating, would argue that the market is willing to lean against the seasonal pattern.
Finally, the macro and policy backdrop. Any shift in expectations for AI-related capital spending, export controls on advanced chips, or Taiwan-related geopolitical risk could amplify moves in this period.[1][7] For traders tracking AMD’s seasonal trend, the key tell will be whether weakness, if it appears, comes with rising volume and broad semiconductor underperformance, which would echo prior midterm-year episodes, or whether dips are quickly bought as part of a still-intact AI bull story.
Sources
- Yahoo Finance (Canada) - Advanced Micro Devices, Inc. (AMD) Stock Price, News ...
- MarketBeat - Advanced Micro Devices (AMD) Stock Price, News & Analysis
- ChartMill - AMD Forecast, Price Target & Analyst Ratings
- Yahoo Finance (TheStreet) - Analysts reset AMD stock price target after earnings
- Zacks Investment Research - Advanced Micro Devices (AMD) Price Targets - Zacks Investment Research
- SEC (AMD 2025 Form 10-K / filings) - amd-20251227
- MarketBeat (instant alert) / Quiver Quantitative cited - Advanced Micro Devices (NASDAQ:AMD) Trading 4.9% ...
About this seasonal analysis
Seasonal pattern data is sourced from TradeWave.ai, which analyzes historical price behavior across annual calendar windows going back up to 30 years. Read the full data methodology or the book The 100-Year Pattern by Afshin Moshrefi (2026 edition). Past performance of seasonal patterns does not guarantee future results. This article is for informational purposes only and does not constitute investment advice.