Ford Motor Company (F) Has Risen in 8 of 9 Midterm Sep-Jun Windows, Averaging 14% Gains
Ford Motor Company is heading toward a historically strong 276-day midterm-election seasonal window even as shares sit well below their 52-week high and options activity builds.
Price as of Aug 25, 2026: $13.95 (last close).

What is the seasonal pattern for Ford Motor Company (F)?
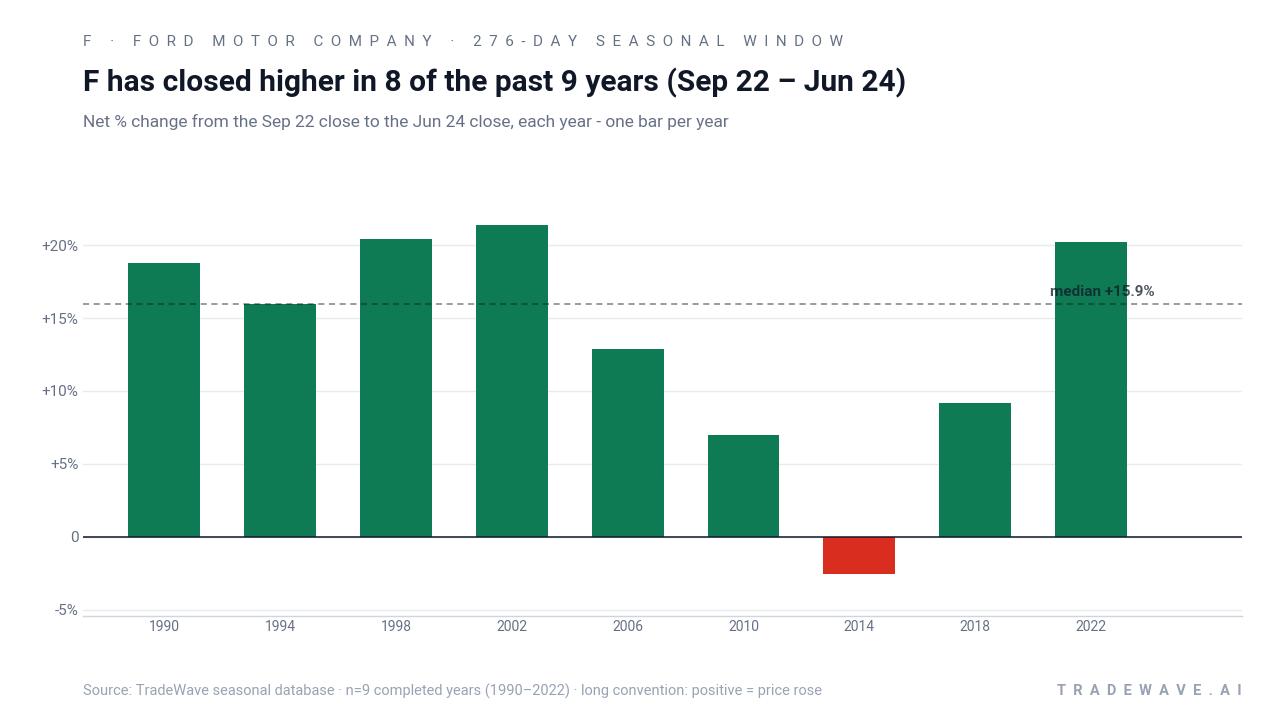
Ford Motor Company has risen in 8 of 9 years during this Sep 22 to Jun 24 midterm-election window, with an average gain of 15.71% in winning years.
- 8-for-9 record in this window, with winning years averaging 15.71% gains and a 210% cumulative return when stacked across cycles.
- Percent Profitable is 89%, with 8 winners and 1 loser across the last 9 midterm election years in this 276-day Ford trading window.
- Avg Profit - All, which includes the lone losing year, still comes in at 14%, pointing to a strong bullish seasonal tendency.
- The worst year in the sample lost only 2.53%, while several strong years posted net gains above 20%, including 1998, 2002 and 2022.
- Intraperiod swings have been large at times, with historical best run-ups above 50% and adverse moves deeper than 20% in some years, underscoring volatility risk.
- This window begins Sep 22 and runs 276 days into the following pre-election year, aligning Ford’s seasonal trend with the late-midterm to pre-election policy phase.
According to historical data from TradeWave.ai, this upcoming stretch for Ford behaves very differently from an average year, with a distinct midterm-election flavor that most traders never see quantified.
How has Ford Motor Company (F) traded in the Sep 22 to Jun 24 midterm-year window?
Ford Motor Company has risen in 8 of the last 9 midterm election years during the Sep 22 to Jun 24 window, averaging double-digit gains for long positions. Shares finished the latest session at $13.95, leaving the stock about 19.7% below its 52-week high of roughly $17.40 and about 35.1% above its 52-week low near $10.32. Heavy long-dated call buying and elevated options activity around Ford in recent months suggest some institutional traders are already positioning for a longer-term move in the name.[8]
Grouping by the presidential election cycle matters here because this window straddles the end of the midterm election year and the start of the year before the presidential election, a phase when policy uncertainty tends to fade and risk appetite often improves. For an economically sensitive automaker like Ford, that backdrop can intersect with fleet replacement, consumer credit conditions and capital spending plans in ways that repeat from cycle to cycle.
Across the nine completed midterm-election cycles in this Ford Motor Company trading window, the long setup has been clearly biased to the upside. Percent Profitable sits at 89%, with 8 winners and just 1 loser, and the average gain in winning years is 15.71%, compared with an all-years average of 14% once the single down year is included. The median outcome of 15.95% is close to the mean, which suggests the positive results are not just the product of one or two outlier rallies.
The per-year table shows how that plays out in practice. Strong years like 1998, 2002 and 2022 each delivered net returns around 20% or more from late September into late June, while the weakest year, 2014, lost only 2.53% despite a sizable intraperiod drawdown. Add it up and stacking this 276-day window across the nine midterm-election cycles compounds to roughly 210% cumulative gains, a powerful seasonal trend for a single stock window.
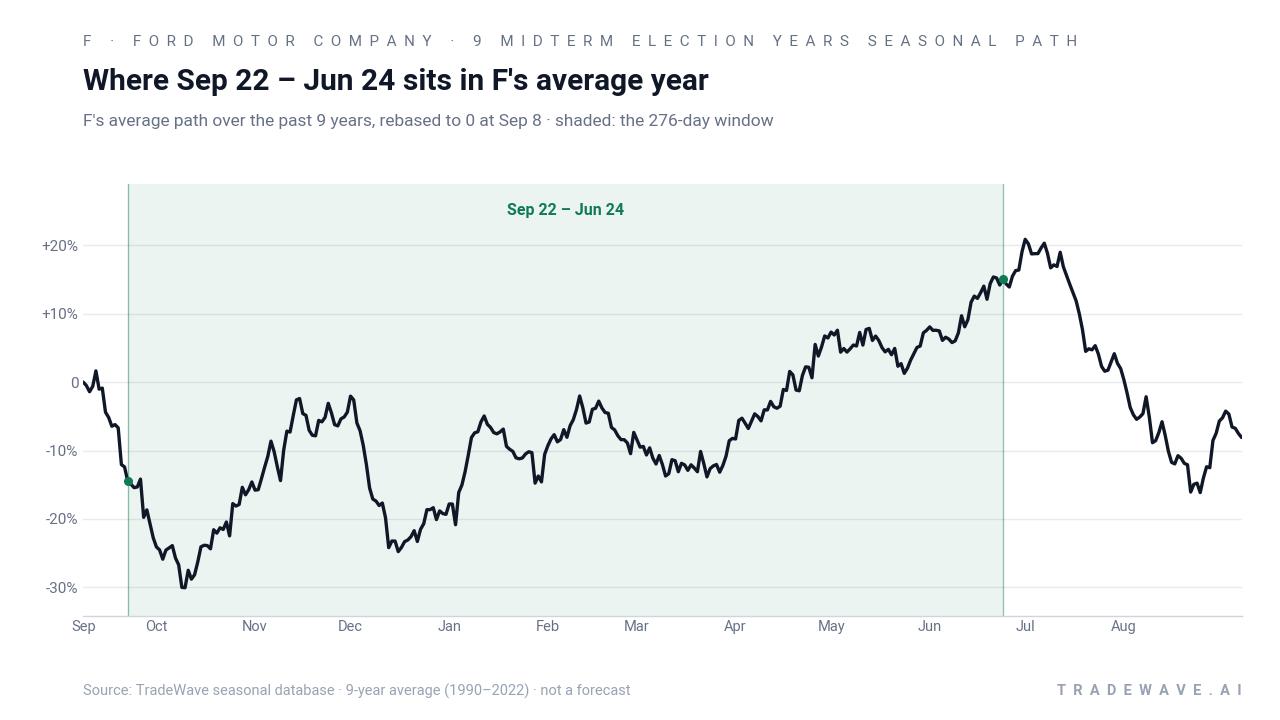
The historical seasonal average path suggests that Ford’s typical gains in this window are not front-loaded into a single burst. Instead, the stock has tended to grind higher over many months, with the slope of the average line steepening as the calendar moves deeper into the pre-election year. That fits the broader pattern of risk assets often firming as policy visibility improves and growth expectations stabilize heading into a presidential race.
Year-by-year ranges show how much Ford has historically swung inside this window before settling at its final result.
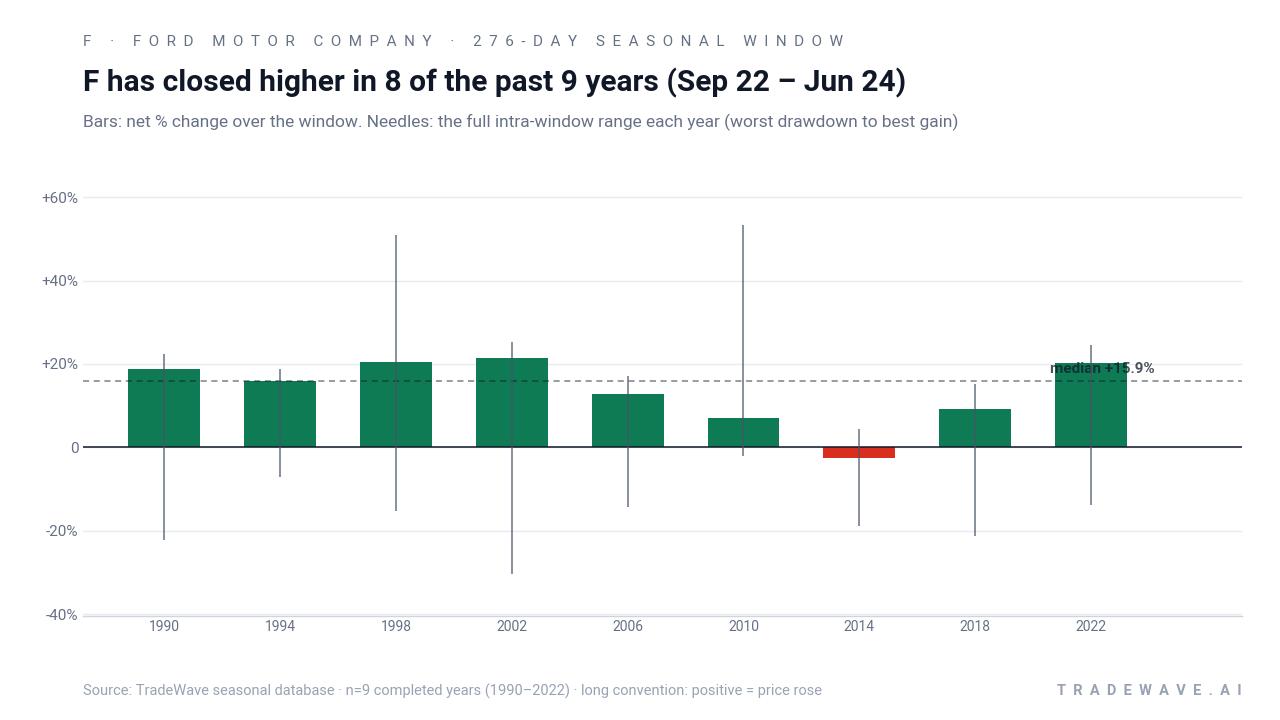
The combined net / maximum favorable move / maximum adverse move view shows why this pattern has a solid TradeWave Ratio of 1.4. In strong years, Ford has seen best run-ups above 50% inside the window, as in 2010, while even the weaker years still posted meaningful rallies before or after drawdowns. At the same time, adverse excursions have been real, with worst drawdowns deeper than 20% in several cycles, including 1990, 2002, 2014 and 2018, which means traders sitting through the full window have historically had to tolerate sizable volatility even when the final outcome was positive.
History does not guarantee future results; adverse excursions can be large even in winning windows, and past seasonal strength does not ensure similar performance in the next cycle.
Why does Ford Motor Company (F) follow this seasonal pattern?
One likely driver is the way Ford’s earnings calendar and product cycles line up with the broader presidential election cycle, with key model launches, fleet orders and guidance updates often clustering from late Q3 through midyear. Analysts have also pointed to institutional portfolio repositioning around midterm elections, where investors rotate into cyclical names like autos as policy risk clears and fiscal priorities become clearer.[7] The pattern may also reflect consumer and commercial vehicle demand that tends to firm into the pre-election year as credit conditions and business confidence stabilize.
What is driving Ford Motor Company (F) today?
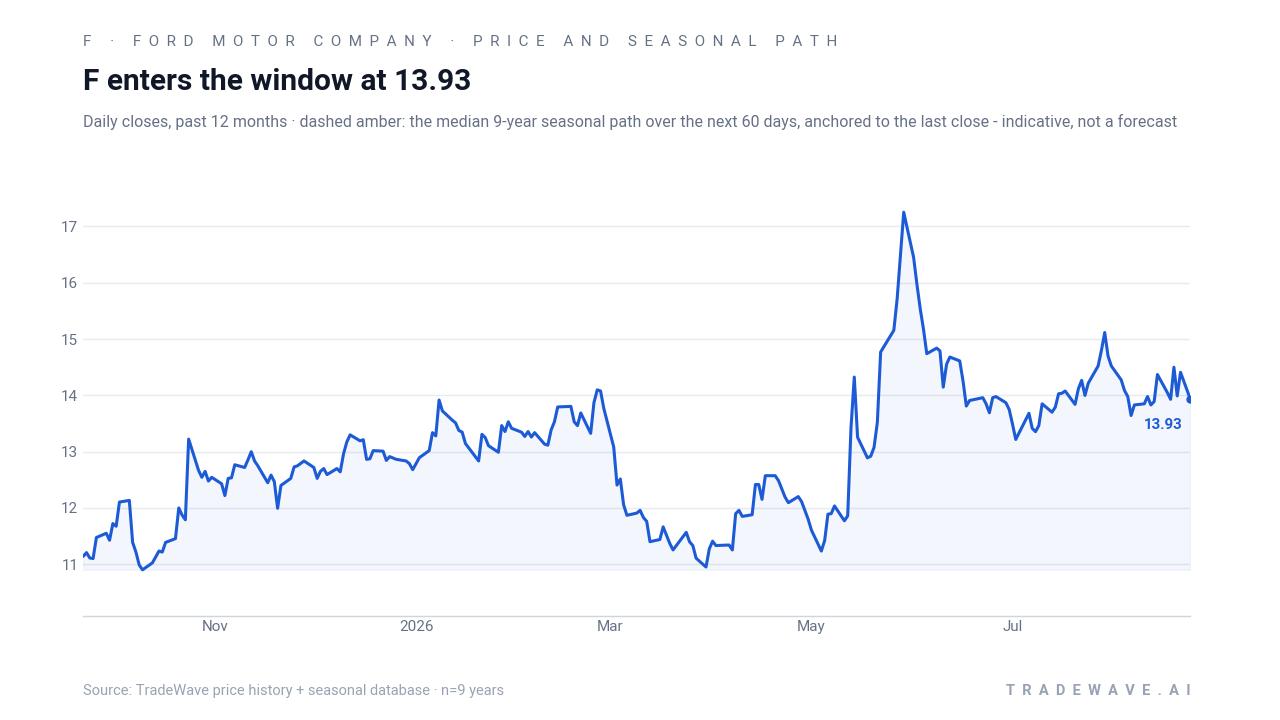
Ford shares closed at $13.95 on Aug 26, up 0.14% on the day, with roughly 33.4 million shares changing hands versus a 20-day average volume near 48.0 million. That leaves the stock trading about 19.7% below its 52-week high and roughly 35.1% above its 52-week low, a mid-range setup after a volatile year for autos. The current level also sits modestly above the 50-day moving average around $13.90, suggesting the stock has been consolidating after a sharp run earlier in 2026.[8]
Fundamentally, Ford is coming off a stronger-than-expected second quarter. On Jul 28, the company reported adjusted EPS of $0.42 versus $0.35 expected and raised its 2026 adjusted EBIT outlook to $10 billion to $11 billion, up from a prior $8.5 billion to $10.5 billion range.[3] Management also lifted its adjusted free cash flow guidance and highlighted recovering vehicle volumes and a tariff reimbursement that should support cash generation, even as it bakes in roughly $1 billion of new commodity headwinds tied to aluminum and other inputs.[3][7]
That guidance reset followed a more mixed Q4 2025, when Ford posted adjusted EPS of $0.13 versus $0.19 expected and took sizable special charges that produced a net loss despite record full-year revenue of $187.3 billion.[5] Since then, commentary from fundamental research shops has framed the stock as a cyclical value play with execution risk around electric vehicles, cost cuts and labor, but also meaningful leverage to any improvement in auto demand and pricing.[2][7]
On the positioning side, options and ownership data show growing interest in using derivatives to express longer-term views on Ford. MarketBeat and GuruFocus have both flagged unusually high options activity in recent months, including heavy call volumes and notable long-dated call purchases, while also noting at least one insider buy totaling 140,000 shares in the past quarter.[8][9] A separate MarketBeat alert on Aug 25 highlighted institutional investors increasing stakes in Ford, reinforcing the sense that larger players are leaning into the name as it trades below consensus fair value estimates.[13]
Short interest remains modest, with ChartMill data showing a short float around 2.47% and days to cover near 1.5, which limits the potential for a classic squeeze but also suggests bears are not heavily committed at current levels.[2] Meanwhile, the options chain as of Aug 25 shows active trading across near-dated and longer-dated strikes, giving traders multiple ways to express views into the upcoming earnings report and the seasonal window that begins in late September.[11]
The chart below situates the latest move in its recent multi-month context alongside the median 60-day seasonal path.
What should traders watch as this Ford Motor Company seasonal window approaches?
First, the calendar: this 276-day Ford Motor Company trading window opens on Sep 22 and runs deep into the 2027 pre-election year, overlapping a phase that has historically been supportive for cyclicals. Traders will be watching whether the stock can hold above its 50-day moving average and start to close the gap toward the 52-week high as the window nears, or whether macro headwinds and commodity costs keep a lid on the tape.[2][7]
Second, earnings and guidance on Oct 21 will be critical for confirming or challenging the bullish historical seasonality. A clean follow-through on the Q2 beat, with evidence that cost controls and pricing power are offsetting commodity headwinds, would align with the pattern of strong midterm-to-pre-election windows. A guidance cut or renewed margin pressure would be a clear break from the historical script and could turn the upcoming window into a stress test rather than a tailwind.[3][7]
Third, options and flow signals deserve close attention. If the unusual call buying and elevated options activity documented in May through July continues or accelerates into the fall, it would suggest that institutional investors are leaning into the same window that the historical seasonality favors.[8][9] If, instead, call volumes fade, implied volatility drifts lower and insider or institutional buying cools, that would signal a more cautious stance even as the calendar moves into what has been a strong stretch for Ford in prior midterm election years.[11][13]
Finally, watch how Ford trades around macro and policy headlines tied to the midterm-election phase. Any shifts in tariffs, EV incentives, fuel standards or infrastructure spending could either reinforce or blunt the historical pattern, especially given management’s explicit sensitivity to commodity costs and regulatory frameworks.[3][7] The historical record is clear: this window has favored longs in 8 of 9 cycles, but how Ford behaves into and through the next one will depend on whether fundamentals and flows line up with that seasonal backdrop.
Sources
- Seeking Alpha - F Ford Motor Company SA Analyst's Rating
- ChartMill - F Fundamental Analysis & Valuation | Fair Value & Financial Strength
- CNBC - Ford Motor (F) earnings Q2 2026
- Zacks - Ford Pre-Q2 Earnings Analysis: Buy the Stock Now or Wait?
- CNBC - Ford Motor (F) earnings Q4 2025
- Seeking Alpha - Ford Motor Company (F) Stock Forecast, Price Target, and Price Chart
- Morningstar - After Earnings, Is Ford Stock a Buy, a Sell, or Fairly Valued?
- MarketBeat - Ford Motor Target of Unusually High Options Trading (NYSE:F)
- GuruFocus - Ford (F) Sees Notable Activity in Options Market
- Barchart - Institutional Investors Love Ford Stock - Buying Huge, Unusual Volume of Long-Term Call Options
- MarketBeat - Ford Motor (F) Options Chain & Prices 2026
- GuruFocus - Ford (F) Sees Increased Options Activity
- MarketBeat - Jones Financial Companies Lllp Increases Stake in Ford Motor Company $F
- Seeking Alpha - Ford options activity heats up as stock extends surge
About this seasonal analysis
Seasonal pattern data is sourced from TradeWave.ai, which analyzes historical price behavior across annual calendar windows going back up to 30 years. Read the full data methodology or the book The 100-Year Pattern by Afshin Moshrefi (2026 edition). Past performance of seasonal patterns does not guarantee future results. This article is for informational purposes only and does not constitute investment advice.