Costco (COST) Has Risen in 15 Straight Oct-Aug Runs, Averaging Nearly 20% Gains
Costco shares are hovering around $905 as the stock approaches an Oct 5 trading window that has delivered gains in every year of the past decade and a half, a rare streak that could shape expectations for the next 10 months.
Price as of Sep 23, 2026: $904.70 (last close).
What is the seasonal pattern for Costco (COST)?
Costco has risen in 15 of 15 years during the Oct 5 to Aug 5 window, with an average gain of 19.78% in winning years.
- 15 for 15 in this window, with Costco averaging 19.78% gains across all winning years.
- The upcoming seasonal window starts Oct 5 and runs 305 days through early August, covering most of Costco’s fiscal year.
- Percent Profitable is 100.0%, with 15 winners and 0 losers over the 15-year lookback.
- Average annualized return in the window is 19.32%, with a Sharpe ratio of 1.49 based on end-of-window outcomes.
- The TradeWave Ratio of 1.99 suggests Costco typically travels meaningfully in the long direction within this window before it closes.
- Individual years have still seen mid-window drawdowns, but every completed Oct–Aug stretch in this sample finished in positive territory.
According to historical data from TradeWave.ai, this long Costco window has behaved very differently from an average calendar stretch. The next section walks through how that pattern has played out and what it could mean for the coming year.
How has Costco (COST) traded in the Oct 5 to Aug 5 window?
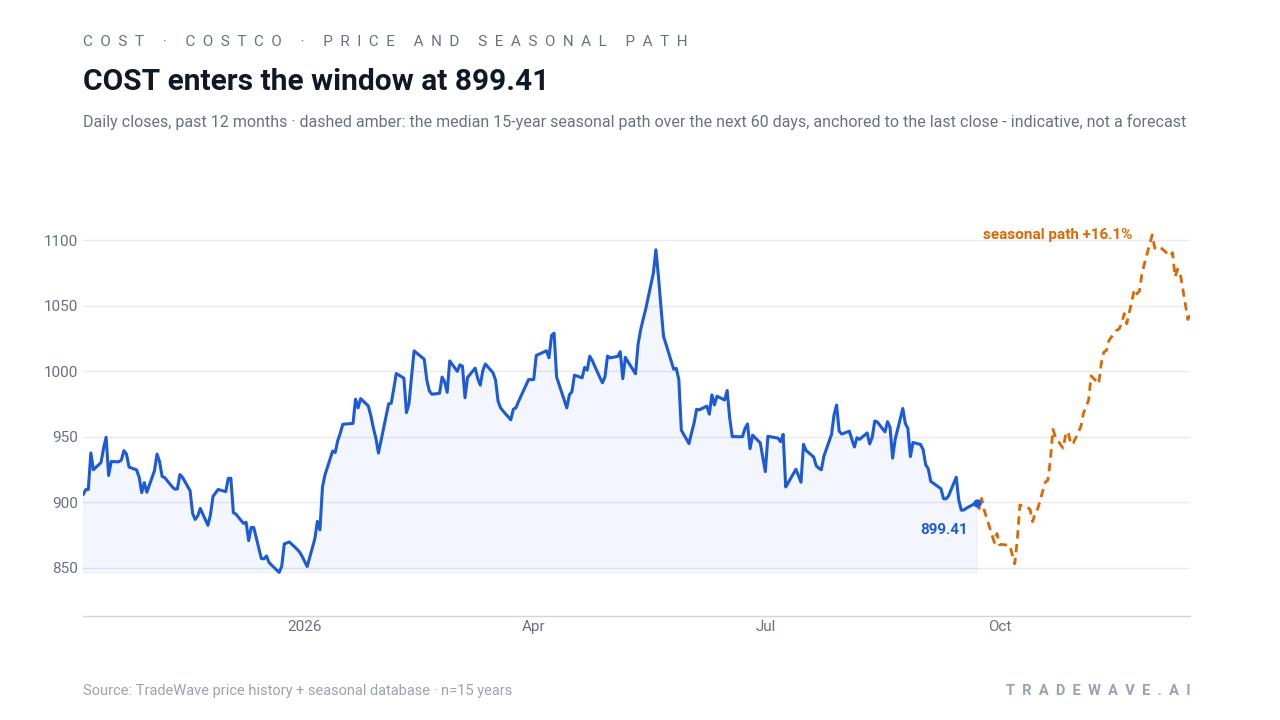
Costco has finished higher in every single Oct 5 to Aug 5 window for the past 15 years, averaging a 19.78% gain across those runs. The next iteration of that 305-day stretch begins Oct 5, with the stock last changing hands at $904.70 after a 0.6% gain in the prior session, sitting between its 52-week low near $836.66 and high around $1,093.02. That combination of a long winning streak and a still-elevated share price makes this Costco trading window one of the more striking large-cap seasonal patterns on the calendar.
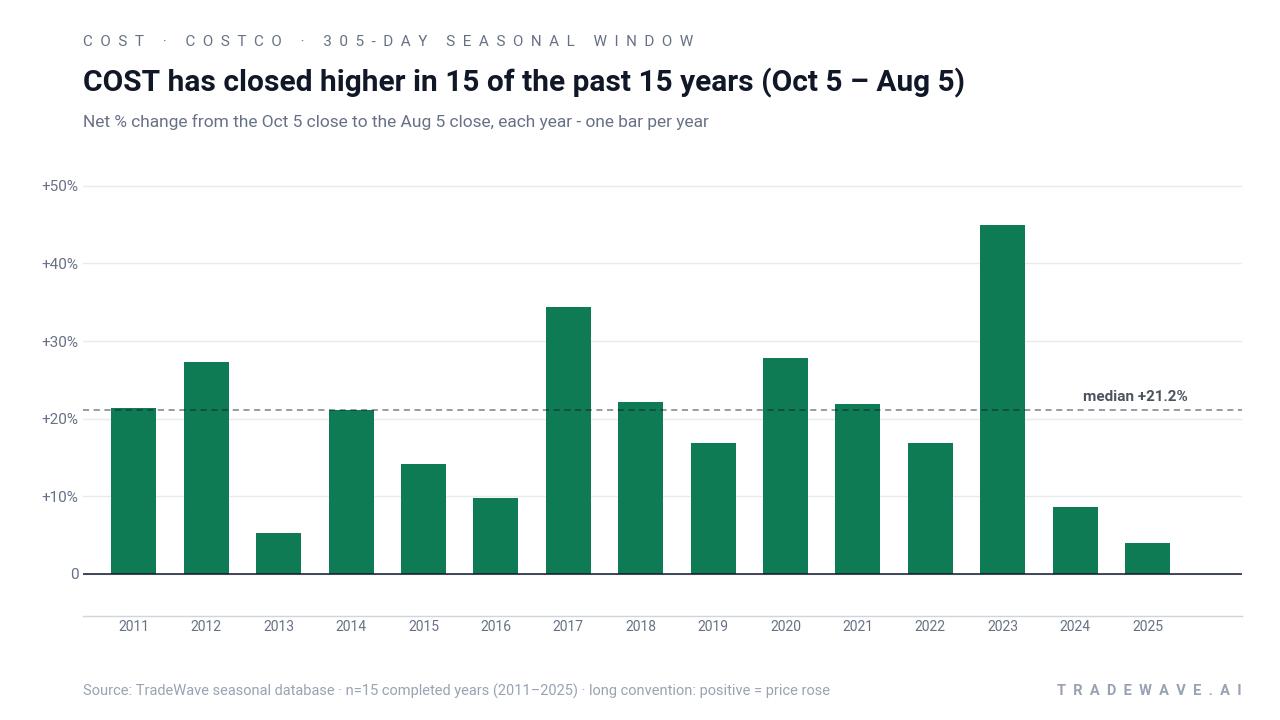
Across the 15-year sample, the strongest Oct–Aug run came in 2023, when Costco gained 44.91% from entry to exit, with a maximum favorable move inside the window of 61.82%. At the other end of the spectrum, 2016 and 2024 were the softest years, still finishing up 9.82% and 8.57% respectively, which shows how rarely this Costco seasonal trend has produced flat outcomes.
Intraperiod swings have been meaningful even in winning years. In 2018, for example, Costco’s best point-to-peak move inside the window reached 30.94%, but the worst drawdown from entry was a 13.19% slide before the stock recovered to finish up 22.09%. In 2020, the maximum favorable move was 27.93% with an 11.8% adverse excursion along the way, underscoring that this has been a long-biased but not low-volatility stretch.
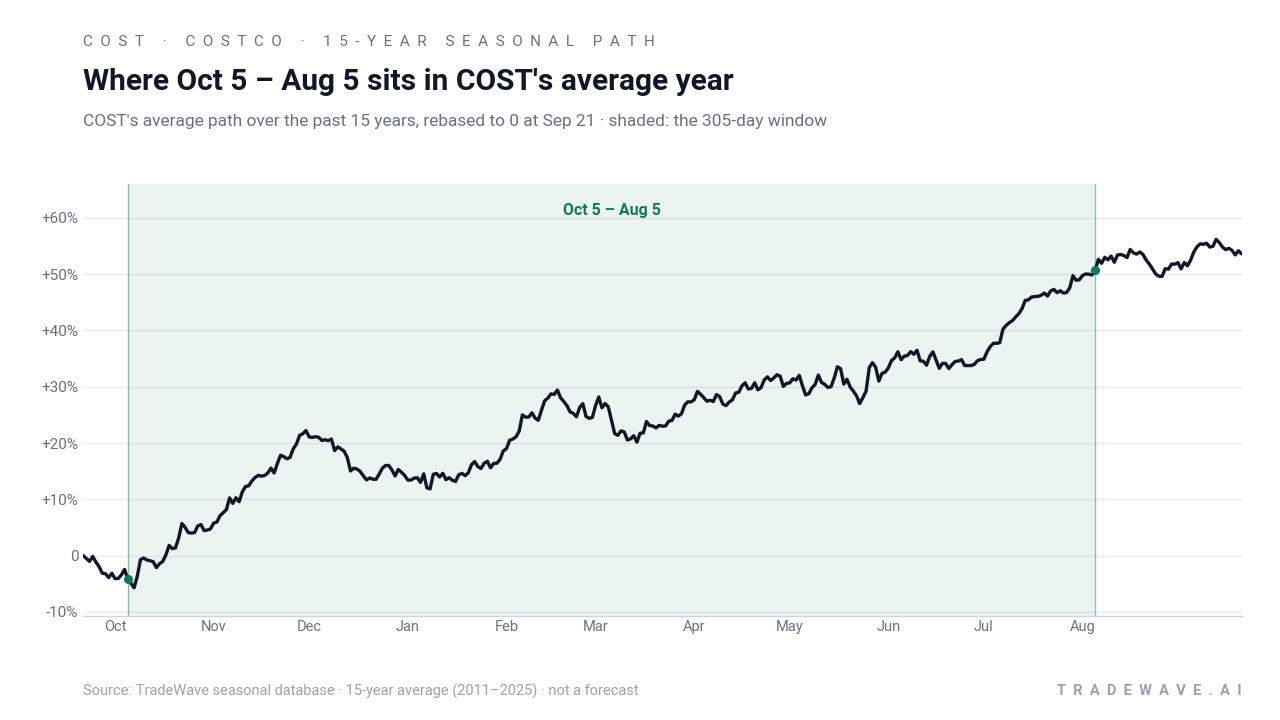
A second view combines yearly net results with the full intraperiod range between worst drawdown and best rally.
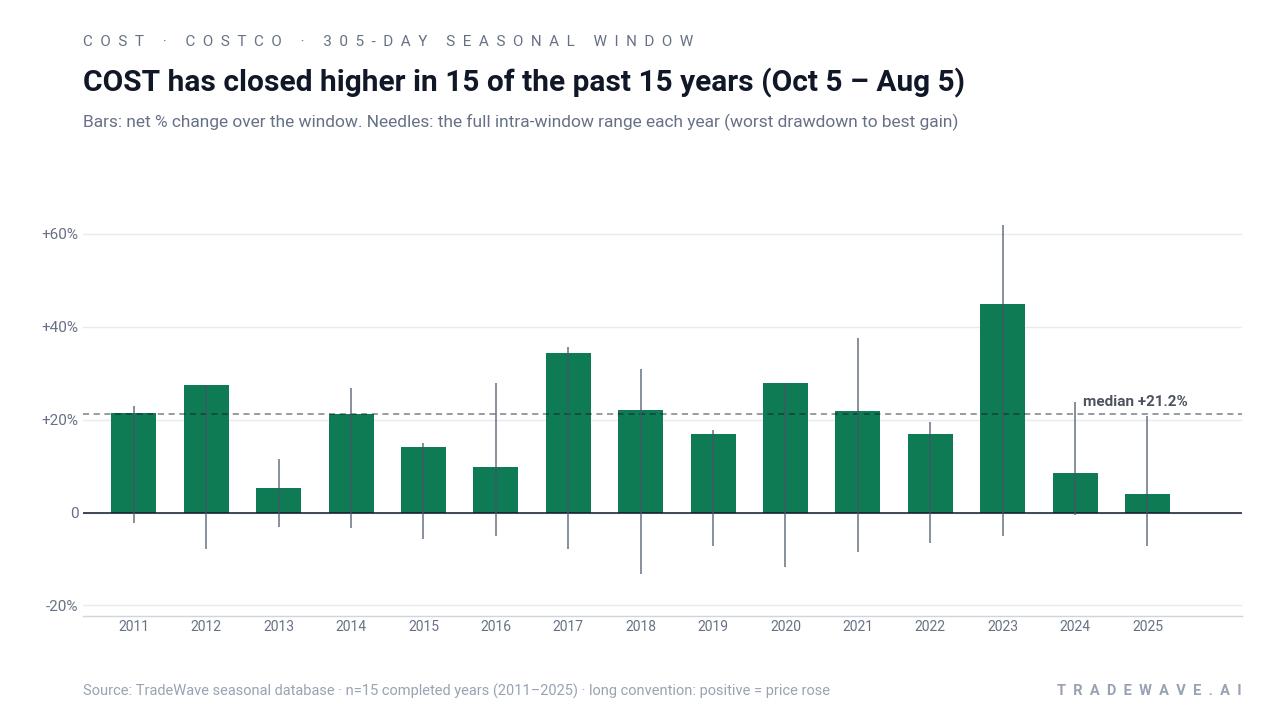
Viewed cumulatively, stacking this 305-day Costco trading window year after year compounds to a 1,314.66% gain over the 15-year sample. That is the math behind a 19.32% annualized return and a 1.49 Sharpe ratio for this specific slice of the calendar, which has historically favored long exposure in Costco even when the broader market was choppy.
History does not guarantee future results; adverse excursions can still be large inside the window even when the final outcome is positive.
Why does Costco (COST) follow this seasonal pattern?
One likely driver is Costco’s earnings and membership-fee calendar, which clusters key fiscal updates and renewal periods inside this Oct–Aug span, keeping investor focus on growth and retention. Analysts have also pointed to Costco’s role as a defensive retailer that benefits from holiday and back-to-school spending cycles, both of which sit squarely inside this window.[1] The pattern may also reflect institutional portfolio positioning, as long-only managers lean into Costco’s “inflation-fighter” reputation when they rebalance around year-end and midyear.[1]
What is driving Costco (COST) today?
Costco closed at $904.70 in the prior session, up 0.6% on the day, leaving the stock about 17.2% below its 52-week high near $1,093.02 and roughly 8.1% above its 52-week low around $836.66. That puts the shares in the upper half of their one-year range after a recent pullback, with a one-month return of -7.41% and the 50-day moving average sitting higher at about $935.17, a sign that momentum has cooled after a strong run.
In Sep 2025, Costco’s fiscal fourth-quarter report showed EPS of $5.87, ahead of FactSet estimates, while revenue of $84.4 billion and U.S. comparable sales came in softer than some forecasts, producing a mixed reaction in the stock.[2][3][5] Membership fees grew roughly 14% in that period, reinforcing the strength of the subscription model even as same-store sales slowed.[2][3] Later in Dec 2025, the company again beat quarterly revenue and profit expectations, helped by strong traffic heading into the holiday season, which supported the view that Costco continues to capture value-focused shoppers in an inflationary environment.[6]
Analysts have repeatedly highlighted Costco’s ability to hold share as consumers trade down, describing the warehouse chain as a rare retailer that can both defend margins and drive traffic when budgets are tight.[1][5] In Sep 2025, CNBC coverage noted that while one quarter “failed to impress,” many analysts still liked the underlying story, pointing to membership growth, steady renewal rates and the company’s reputation as an inflation hedge for households.[1] That backdrop helps explain why Costco has often traded as a premium multiple stock within the consumer defensive sector, even when near-term comps or traffic data have been uneven.
Positioning data also show limited outright bearishness. As of Sep 19, 2026, MarketBeat reported short interest at 1.71% of float, a relatively low level that suggests few investors are betting aggressively against the name.[8] For a stock with Costco’s size and liquidity, that kind of short-interest profile typically reflects a market that sees pullbacks as consolidation rather than the start of a structural downtrend.
The chart below situates the latest move against Costco’s past year of trading and a median 60-day seasonal path.
What should traders watch in this Costco (COST) seasonal window?
The first marker is the Oct 5 start of the 305-day window itself. Historically, Costco has tended to build gains across the full stretch rather than spike immediately, so how the stock behaves into late October and November will be an early test of whether this cycle is tracking the long-term seasonal trend.
Second, earnings and membership updates inside the window will matter. Prior years have shown that even when quarterly revenue or same-store sales disappoint, the stock has often recovered by the end of the Oct–Aug span as long as membership fees and renewal rates stay firm.[2][3][5] Traders will be watching for any break in that pattern, especially if consumer spending slows or inflation pressures ease and Costco’s “value” edge narrows.
Third, price levels around the 50-day moving average near $935 and the recent 52-week low around $836.66 are likely to act as reference points. A sustained move back above the 50-day line during the early part of the window would be consistent with the historical long-biased Costco seasonal trend, while a decisive break toward or below the low would signal that this cycle is diverging from the past 15 years.
Finally, even though short interest is modest at 1.71% of float, any sharp change in that figure would be a useful tell on sentiment.[8] A build in short positions during the window would show growing skepticism despite the historical pattern, while a further decline would suggest that investors are leaning into Costco’s established role as a defensive compounder in the retail sector.
Sources
- CNBC - Costco's quarter failed to impress. But there was still a lot we liked and a lot analysts liked - CNBC
- Seeking Alpha - Costco beats on top- and bottom-line but comparable stores sales slow (COST:NASDAQ) - Seeking Alpha
- MarketWatch - Costco’s stock slips despite profit beat, as same-store sales miss estimates again - MarketWatch
- Barron's - Costco Earnings Beat Expectations as Membership Model Shines
- Bloomberg - Costco’s Earnings Beat Estimates on Steady Consumer Demand - Bloomberg.com
- Reuters - Costco beats quarterly sales estimates on strong demand - Reuters
- SEC (EDGAR) - cost-20250831 - SEC.gov
- MarketBeat - Costco Wholesale (COST) Short Interest & Short Float | Updated Sep 2026
About this seasonal analysis
Seasonal pattern data is sourced from TradeWave.ai, which analyzes historical price behavior across annual calendar windows going back up to 30 years. Read the full data methodology or the book The 100-Year Pattern by Afshin Moshrefi (2026 edition). Past performance of seasonal patterns does not guarantee future results. This article is for informational purposes only and does not constitute investment advice.