Raised EPS Guidance and Tariff Tailwind Put HP Inc. (HPQ) in Prime Position for Oct-Feb Upside
HP Inc. is approaching a historically powerful October-to-February trading window just as shares cool off from recent highs and options activity picks up, raising the stakes for the next leg in the PC and printing giant’s stock pattern.
Price as of Sep 22, 2026: $32.04 (last close).

What is the seasonal pattern for HP Inc. (HPQ)?
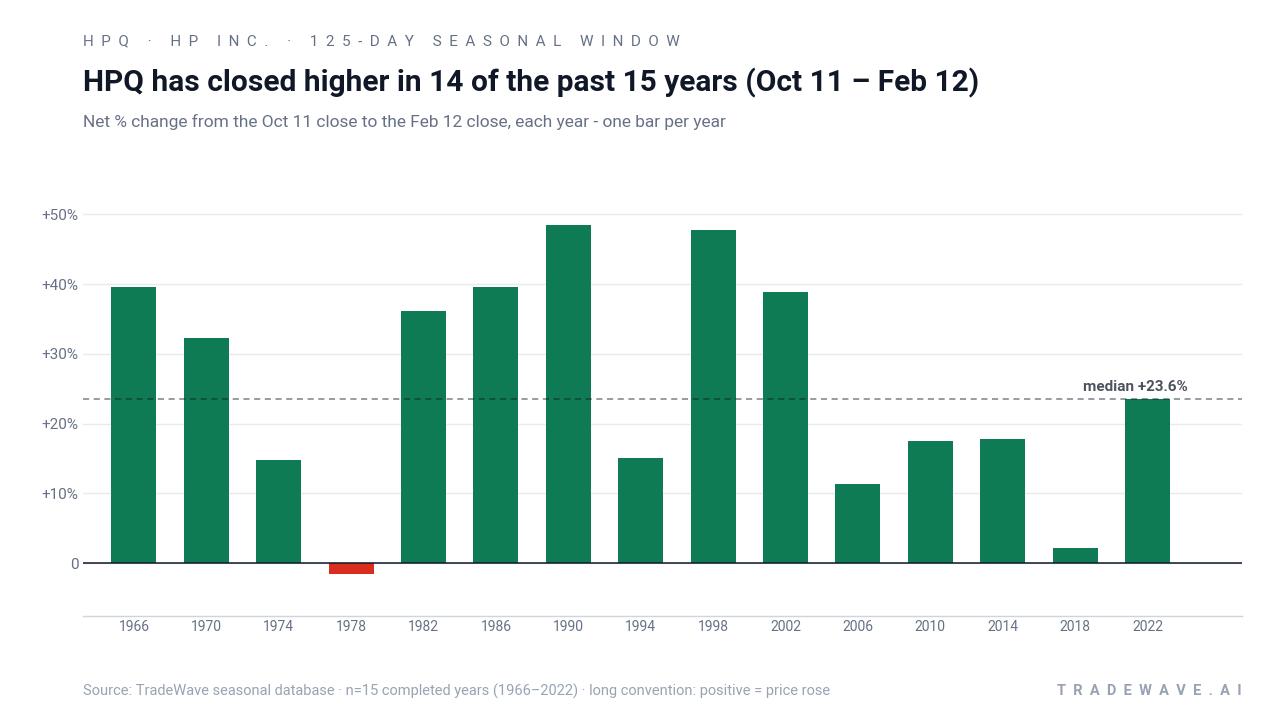
HP Inc. has risen in 14 of the last 15 midterm-year Oct 11–Feb 12 windows, with an average gain of 27.49% in winning years.
- 14 for 15 in this window, with winning years averaging 27.49% gains and only one losing year across the sample.
- The upcoming trading window runs from Oct 11 through Feb 12, spanning 125 days in the concluding midterm election year.
- Percent Profitable is 93.33%, with 14 winners and 1 loser across the last 15 midterm election years.
- Avg Profit in winning years is 27.49%, while Avg Profit - All, which includes the lone down year, is still a strong 25.55%.
- The pattern’s Sharpe ratio of 1.51 and TradeWave Ratio of 1.55 point to historically favorable risk-adjusted returns in this HPQ seasonal trend.
- Even in this bullish HP Inc. trading window, some years have seen notable drawdowns before recovering, underscoring the need to respect volatility.
According to historical data from TradeWave.ai, this specific midterm-year stretch has behaved very differently from an average quarter for HP Inc. The next section walks through how that election-cycle pattern has played out in prior years and what it implies for the coming Oct 11 start date.
How strong is the upcoming seasonal window for HP Inc. (HPQ)?
HP Inc. has closed higher in 14 of the past 15 midterm-year windows running from Oct 11 to Feb 12, a near-perfect seasonal record that stands out even in a volatile tech tape. Shares finished the prior session at 32.04, down 2.8% on the day and sitting about 11.6% below their 52-week high of 36.23, leaving room above if the historical pattern reasserts itself. On Sep 8, MarketBeat flagged unusually large call options activity in HP, with traders snapping up 110,665 contracts in a single session, a sign that derivatives desks are already positioning around the stock’s next act.[1]
The election calendar matters here. This HPQ seasonal trend is built only from the last 15 midterm election years, a phase that often features policy uncertainty, shifting fiscal priorities and choppy risk appetite before markets typically lean more constructive in the year before the presidential election. Grouping by this cycle isolates how HP has behaved when Washington is in the same part of the four-year rhythm that investors face today, rather than blending in very different policy backdrops.
This seasonal window begins on Oct 11 and spans 125 days into Feb 12. Historically, during this period in midterm election years, HP Inc. has shown a strong bullish tendency in line with the long trade direction. Percent Profitable sits at 93.33%, with 14 winners and just 1 loser, and even after including that down year the all-years average gain is 25.55%. In winning years alone, the stock has advanced an average of 27.49%, with a median outcome of 23.56%, suggesting the upside has not been driven by a single outlier.
The per-year breakdown shows how consistent that pattern has been. In 1990, HPQ gained 48.41% over the window, while 1998 delivered a 47.71% rise and 2002 added 38.87%. More moderate but still solid gains of 15.06% in 1994, 17.48% in 2010 and 17.85% in 2014 round out the profile. The lone soft year in this HP Inc. trading window was 2018, when the stock still finished up 2.2% but endured a much rougher ride along the way.
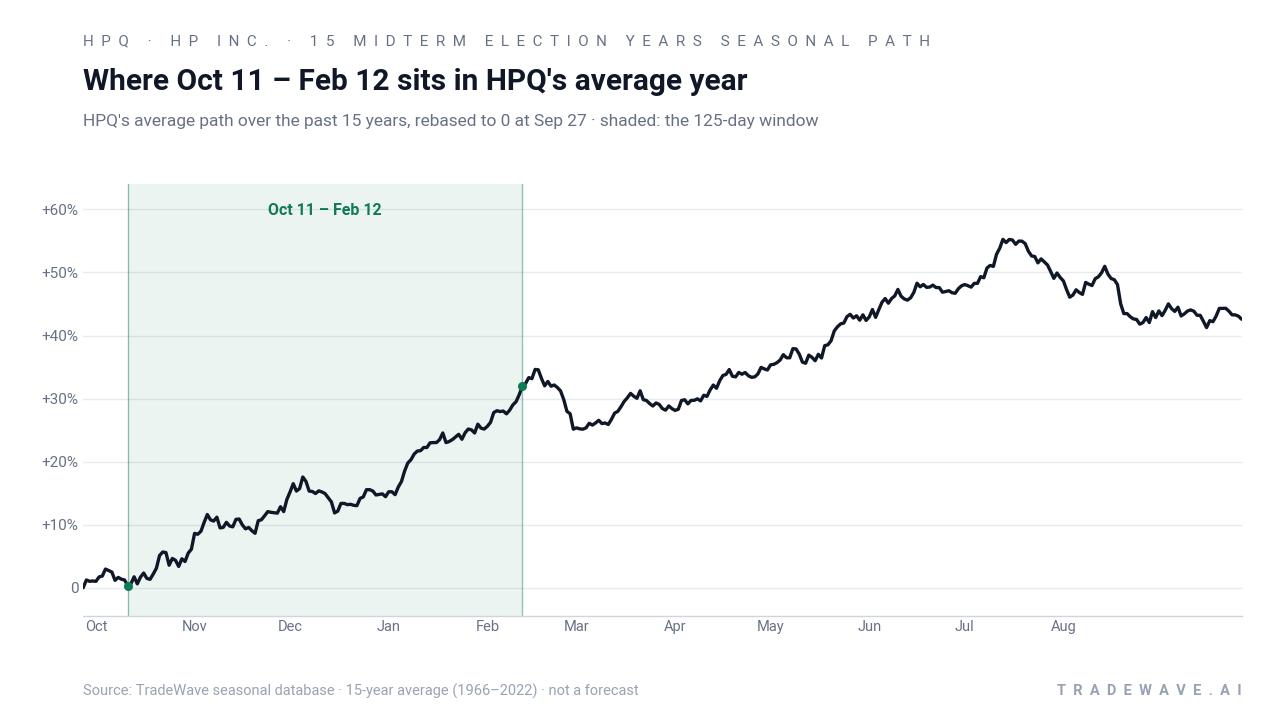
Yearly net and peak moves highlight upside persistence amid typical drawdowns.
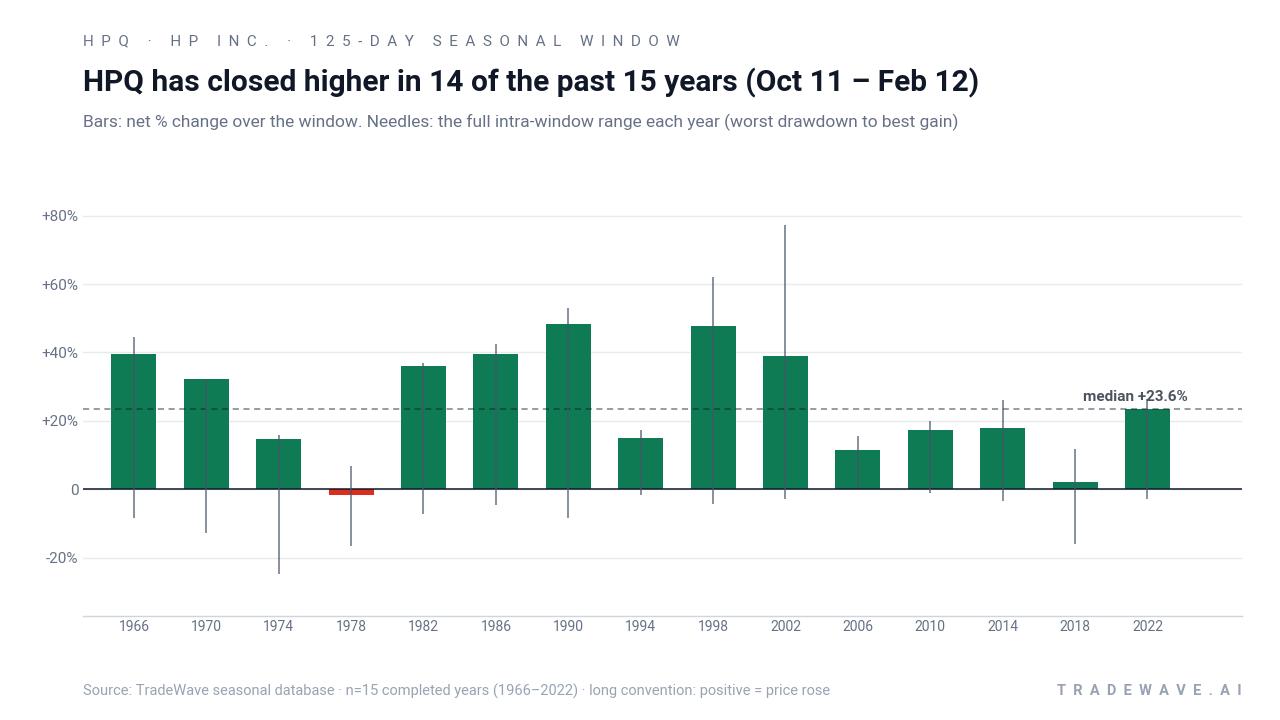
The maximum favorable move and maximum adverse move profile shows why this HPQ seasonal pattern has attracted attention. In strong years like 2002, the best point-to-peak rally inside the window reached 77.14%, while 1998 saw a 62.08% intraperiod gain and 1990 hit 53.03%. On the downside, the worst drawdowns from entry have usually been contained to single digits, such as -4.55% in 1986, -4.34% in 1998 and -3.27% in 2014, although 2018 stands out with a -15.87% slide before the stock clawed back to finish slightly higher. That mix of sizable upside excursions with mostly limited adverse moves aligns with the long trade direction and helps explain the pattern’s 1.51 Sharpe ratio.
Stacking the window year after year compounds into a 2603.66% cumulative return across the 15 midterm election years in the sample. Add it up: this is not a marginal edge but a long-running seasonal regime that has repeatedly rewarded long exposure in HPQ during late-year and winter months of the midterm cycle. History does not guarantee a repeat, but the record of 14 winners out of 15 is hard to ignore as Oct 11 approaches.
History does not guarantee future results; adverse excursions (MAE) can be large even in winning windows.
Why does HP Inc. (HPQ) follow this seasonal pattern?
One likely driver is the clustering of HP’s fiscal-year reporting and guidance updates around the late-year period, which can reset expectations and trigger re-rating in the stock. Analysts have also pointed to institutional portfolio repositioning into PC and printing names ahead of the calendar year-end, especially when corporate IT budgets and consumer holiday spending come into focus. This pattern may further reflect sector rotation into more value-oriented tech hardware as investors balance growth exposure during the midterm-to-pre-election transition.
What is driving HP Inc. (HPQ) today?
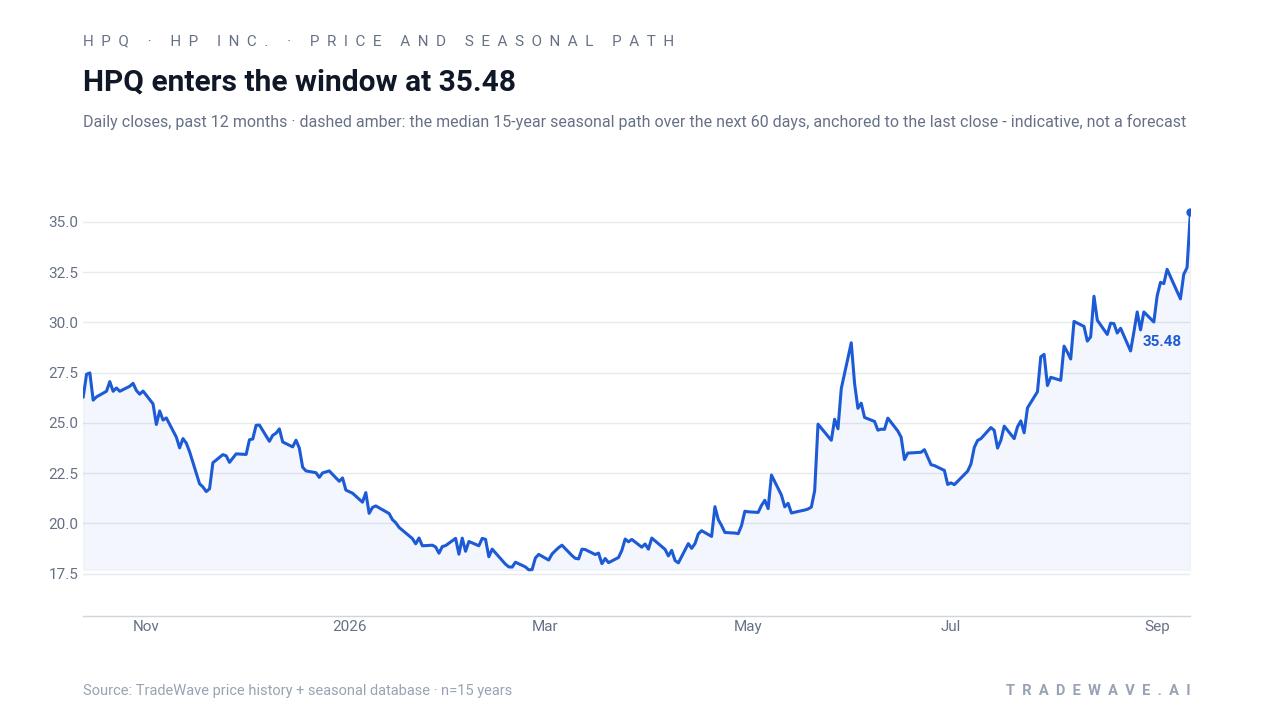
HPQ closed the latest session at 32.04, down 0.91 points or 2.8% after trading between 31.83 and 33.34 on volume of about 14.7 million shares, versus a 20-day average of roughly 18.3 million. That leaves the stock about 11.6% below its 52-week high of 36.23 and roughly 96.7% above its 52-week low near 16.28, a reminder of how far the name has already run off last year’s trough.
The pullback comes after a busy stretch of fundamental news. On Aug 26, HP reported a 16% drop in PC shipments for the quarter ended Jul 31 even as PC revenue rose 18%, reflecting a richer product mix and pricing power; printing revenue slipped 2% to $3.9 billion, and management raised full-year adjusted EPS guidance to a range of $3.19 to $3.29, helped by an estimated $0.19 in tariff refunds.[1] In May, CNBC highlighted a double-digit jump in the shares after HP beat on both earnings and revenue, underscoring how sensitive the stock remains to quarterly execution and guidance tone.[1]
Positioning around the name has also been active. MarketBeat reported on Sep 8 that investors acquired 110,665 HP call options in a single session, an unusually large burst of bullish derivatives flow that suggests traders are leaning into upside scenarios rather than hedging downside.[1] Short interest data from late August showed a short-interest ratio of 5.7 in one reading, indicating a meaningful but not extreme cohort of investors betting against the stock.[2] Meanwhile, MarketBeat’s insider-trading tracker lists multiple insider sales and buys through 2025 and 2026, including transactions by CEO Enrique Lores and executive David P. McQuarrie, signaling active insider portfolio management rather than a one-way signal.[3]
The chart below situates the latest move in its recent multi-month context alongside the median 60-day seasonal projection.
What should traders watch as HPQ approaches this seasonal window?
First, the calendar: the Oct 11 start date lands as markets wrap up the midterm election year and pivot toward the year before the presidential election, a phase that has often coincided with friendlier risk appetite. How HPQ behaves into and through that 125-day stretch will show whether the historical 14-for-15 record still has bite in the current macro and PC-cycle backdrop.
Second, price levels and volatility. Traders will be watching whether HPQ can hold above the low-30s and make a run back toward the mid-30s band that capped the stock earlier this year, or whether any break below the recent 31–32 area ushers in a deeper shakeout before the seasonal window even begins. Intraperiod history shows that even winning years have seen drawdowns, so a sharp dip early in the window would not automatically invalidate the pattern but would test conviction.
Third, the options tape and positioning. The early September burst of call buying is a clear Special Insight; if that bullish flow continues or builds as Oct 11 nears, it would signal that more traders are leaning into the historical upside tendency rather than fading it.[1] Conversely, a shift toward put-heavy activity or a jump in short interest would suggest that skeptics are using the seasonal strength as an opportunity to press the other side of the trade.[2]
Finally, earnings and policy headlines. HP’s next guidance update, any revisions tied to tariff refunds, and broader signals on corporate IT spending and consumer PC demand will all intersect with this HPQ seasonal trend. If fundamentals stay broadly supportive while the stock respects key support zones and options interest remains skewed to calls, history says this midterm-year window has often rewarded patience on the long side. If those pieces break the other way, it would mark one of the rare cycles where the pattern fails to deliver.
Sources
About this seasonal analysis
Seasonal pattern data is sourced from TradeWave.ai, which analyzes historical price behavior across annual calendar windows going back up to 30 years. Read the full data methodology or the book The 100-Year Pattern by Afshin Moshrefi (2026 edition). Past performance of seasonal patterns does not guarantee future results. This article is for informational purposes only and does not constitute investment advice.