10-for-10 Midterm Run: S&P Global (SPGI) Has Averaged 24.4% Gains From Oct 6 to Jun 15
S&P Global is trading well below its 52-week high as a historically powerful 253-day midterm-year seasonal window approaches, setting up a sharp contrast between weak 2026 performance and strong election-cycle seasonality.
Price as of Sep 30, 2026: $394.47 (last close).

What is the seasonal pattern for S&P Global (SPGI)?
S&P Global has risen in 10 of 10 midterm-election-year windows starting Oct 6 and lasting 253 days, with an average gain of 24.4% in winning years.
- 10 for 10 in this window, averaging 24.4% gains in winning years across the last 10 midterm election years.
- Seasonal window runs from Oct 6 through roughly Jun 15, spanning 253 calendar days in the midterm-to-pre-election transition.
- Percent Profitable is 100.0%, with 10 winners and 0 losers over the historical sample.
- Median profit of 25.58% and annualized return of 24.04% highlight a consistently strong SPGI seasonal trend.
- TradeWave Ratio of 1.88 indicates that price has typically traveled meaningfully in the long direction within the window, while a Sharpe ratio of 2.16 reflects strong risk-adjusted returns.
- Individual years still saw double-digit intraperiod drawdowns, so the historical pattern combines sizable upside with real downside swings.
According to historical data from TradeWave.ai, this midterm-election-year stretch has behaved very differently from an average year for S&P Global. The next section walks through how that election-cycle seasonality has lined up with past price action.
How has S&P Global (SPGI) traded in this midterm-year Oct 6 to Jun 15 window?
S&P Global has closed higher in every single Oct 6 to Jun 15 midterm-election-year window for the past 10 cycles, averaging 24.4% gains over 253 days. Shares finished the prior session at 394.47, up 0.5% on the day and about 19.1% below their 52-week high of 487.53, after a year-to-date slide of roughly 15% in 2026. That mix of a bruised stock and a spotless seasonal record gives this upcoming window unusual weight for investors trying to time entries and risk in a key financial data name.
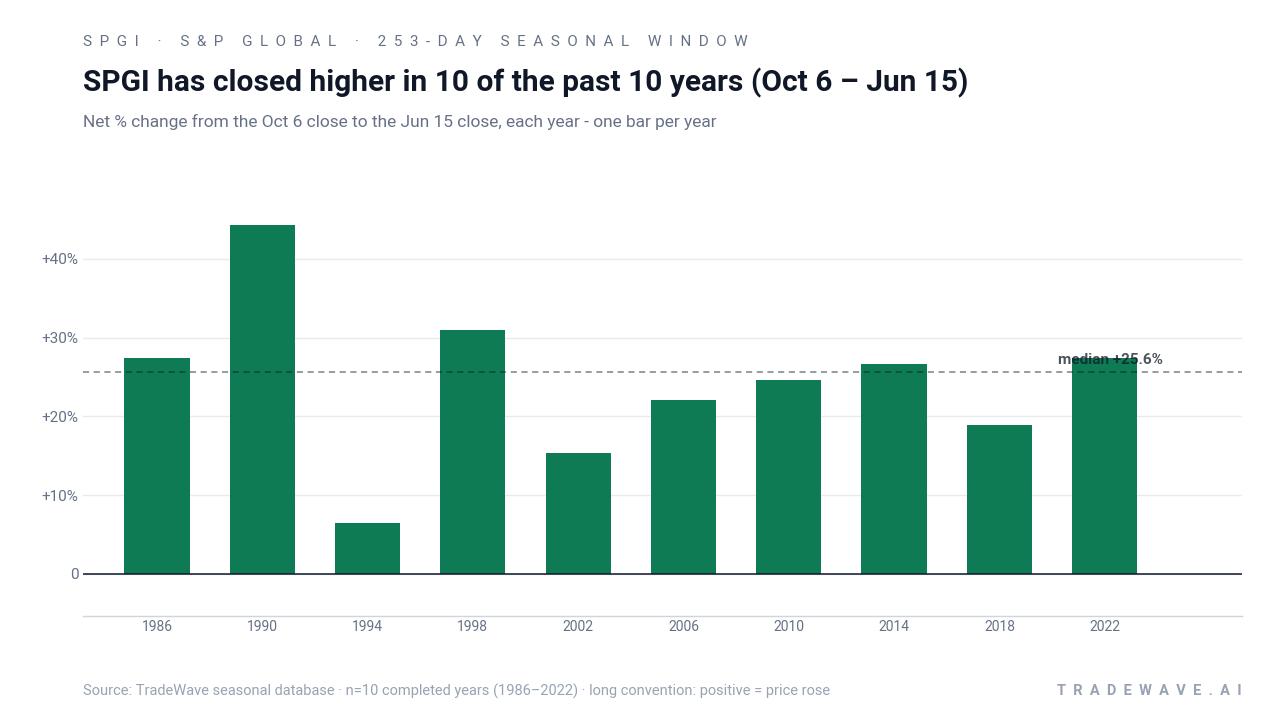
The pattern is built on the last 10 midterm election years, a phase where policy uncertainty, rate cycles and regulation often look very different from pre-election or post-election years. Grouping by the presidential election cycle matters here because midterm years have historically seen a two-playbook structure for equities: choppier action early in the year, then a stronger stretch as markets look ahead to the pre-election year.
Within that framework, this specific SPGI seasonal window begins on Oct 6 and runs 253 days into the following Jun 15. Historically, the trade direction has been long, with S&P Global posting a 100.0% win rate, 10 winners and 0 losers. Average profit across those winning years is 24.4%, with a median outcome of 25.58%, and the annualized return clocks in at 24.04%, which is high for a single-stock seasonal regime of this length.
The per-year table shows how that strength has played out in individual cycles. The weakest net gain came in 1994, when SPGI still added 6.4% between the Oct 6 entry and the Jun 15 exit. The strongest year was 1990, with a 44.25% net return over the window, followed closely by 2022 at 27.46% and 1986 at 27.4%. Add it up and stacking this window across the 10 midterm years compounds to a cumulative 762.24% gain.
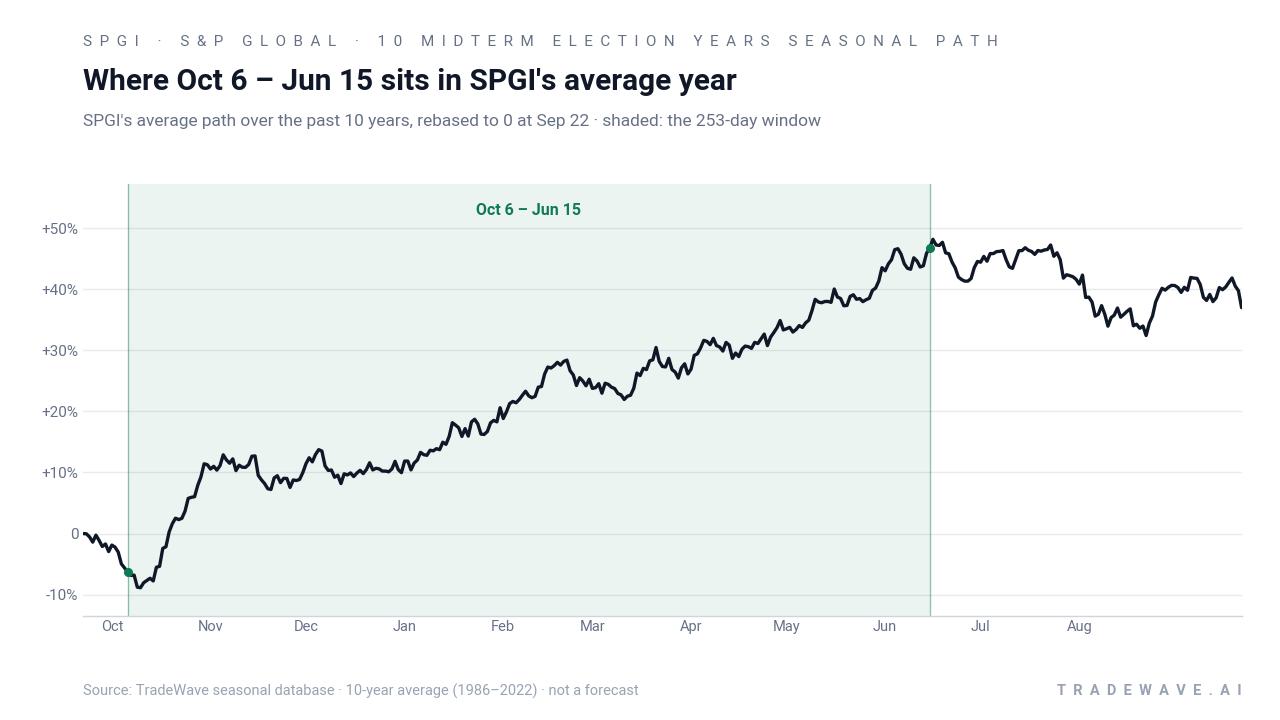
The historical seasonal trend chart suggests that gains have tended to build over the full span rather than arriving in one short spike. In several years, SPGI saw early strength after the October entry, then a pause or pullback, followed by another leg higher into late spring. That profile fits the broader midterm-to-pre-election pattern many investors watch in the S&P 500, where late-year and early pre-election periods have often been friendlier to risk assets.
Intraperiod ranges show how much SPGI has typically swung inside this window before finishing higher.
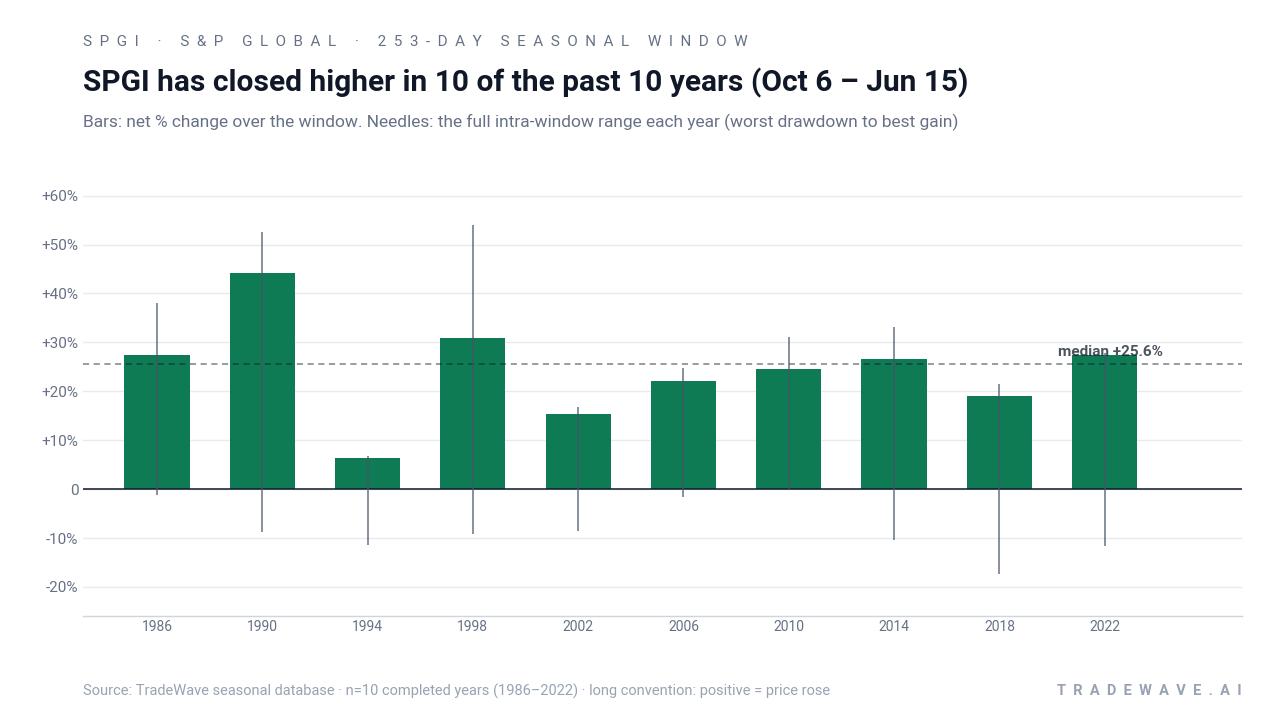
The intraperiod range data, which combines maximum favorable move and maximum adverse move for each year, underlines that this has been a high-conviction but not low-volatility window. In 1998, for example, SPGI’s best run-up within the window reached 53.91%, while the worst drawdown from entry was 9.26%. In 2018, the stock ultimately gained 18.96%, yet it endured an intraperiod drawdown of 17.31% before finishing higher. The TradeWave Ratio of 1.88 captures that tendency for price to travel a long way in the trade direction during the window, even when the final close is more modest than the peak.
History does not guarantee future results; adverse excursions can be large even in winning windows, and a 100% past win rate does not mean the next iteration will be profitable.
Why does S&P Global (SPGI) follow this seasonal pattern?
One likely driver is the way S&P Global’s earnings calendar and budget cycles line up with the broader midterm-to-pre-election policy backdrop. Corporate and government clients often lock in data and analytics budgets late in the year, then ramp usage and renewals into the following spring, which can support revenue and sentiment in this stretch.[3] Analysts have also pointed to sector rotation into quality financial data names as markets look ahead to the pre-election year, when risk appetite has historically improved for many equity benchmarks.
What is driving S&P Global (SPGI) today?
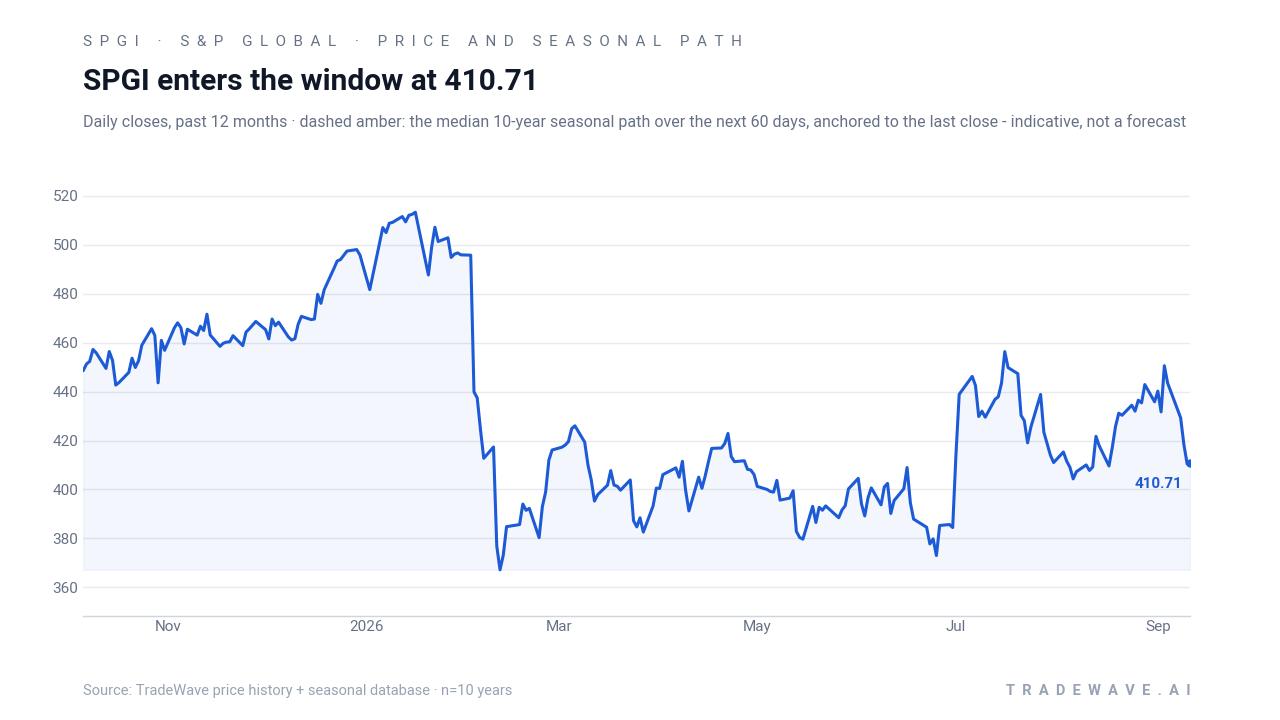
S&P Global closed the prior session at 394.47, up 0.5% on the day, leaving the stock about 19.1% below its 52-week high of 487.53 and roughly 17.1% above its 52-week low of 336.89. That level also caps a difficult 2026, with the shares down about 15% year to date as investors reassessed growth expectations and valuation for financial data and analytics providers.
The reset began in February 2026, when S&P Global issued full-year 2026 adjusted EPS guidance of $19.40 to $19.65, below analyst estimates that clustered around $19.94 to $20.02, and the stock dropped sharply in premarket trading after the announcement.[2] In April 2026, the company reported Q1 revenue of $4.17 billion, up 10% year on year, with Market Intelligence revenue rising about 8% to $1.3 billion and Ratings revenue up 13% to $1.3 billion, showing that demand for analytics and risk tools remained solid even as investors worried about AI-driven disruption to traditional data businesses.[3] In May 2026, S&P Global and its foundation launched the $10 million StepForward AI workforce initiative, tying the brand more closely to AI themes and long-term talent development rather than near-term product monetization.[4]
Sector-wide, geopolitical uncertainty and market volatility have supported demand for financial data, benchmarks and risk analytics, which has helped underpin revenue growth even as multiples compressed.[3] At the same time, concerns about AI-enabled competition in software and services have weighed on sentiment toward incumbents, with some investors questioning how much pricing power legacy data vendors will retain as generative AI tools spread.[2] That tension between resilient fundamentals and valuation pressure is the backdrop against which the Oct 6 seasonal window opens.
The chart below situates the latest move in its recent multi-month context and overlays the median 60-day seasonal path.
What should traders watch as this SPGI seasonal window opens?
First, the calendar: the window begins on Oct 6 and runs through mid-June, overlapping the transition from the concluding midterm election year into the pre-election year. Historically, that has been a friendlier backdrop for quality growth and financial data stocks, especially when policy uncertainty starts to clear and rate expectations stabilize.
Second, price behavior relative to the historical pattern will matter. If SPGI can hold above its recent 52-week low zone near 336.89 and start to build a series of higher lows into year-end, that would rhyme with prior midterm-year windows where early dips were bought and the stock trended higher over the full 253 days. A decisive break below that band, by contrast, would mark a clear departure from the 10-for-10 history and signal that macro or competitive pressures are overwhelming the usual seasonal tailwind.
Third, watch the earnings tape and guidance updates. In February 2026, conservative profit guidance triggered a sharp repricing of expectations.[2] Any shift in management’s tone on organic revenue growth, AI-related investment or margin trajectory in upcoming quarters could either reinforce the historical pattern by restoring confidence or undercut it if investors conclude that the business is entering a structurally slower phase.[3]
Finally, monitor sector flows into financial data and analytics as the pre-election year approaches. If volatility and geopolitical risk keep demand high for ratings, benchmarks and risk tools, SPGI’s historical midterm-year seasonal strength could again line up with a supportive macro and policy calendar.[3] If, instead, investors rotate aggressively into more cyclical or purely AI-native names, the stock may have to work harder to repeat its past 24.4% average gain in this window.
Sources
- Forbes - S&P Global Stock Now 32% Cheaper: Is It Time To Buy?
- Reuters - S&P Global forecasts 2026 profit below estimates, shares plunge
- Reuters - S&P Global reports higher first-quarter profit on demand for analytics products
- Yahoo Finance / Simply Wall St - S&P Global’s StepForward Ties AI Workforce Push To Long Term Story
About this seasonal analysis
Seasonal pattern data is sourced from TradeWave.ai, which analyzes historical price behavior across annual calendar windows going back up to 30 years. Read the full data methodology or the book The 100-Year Pattern by Afshin Moshrefi (2026 edition). Past performance of seasonal patterns does not guarantee future results. This article is for informational purposes only and does not constitute investment advice.