Amphenol (APH) Has Rallied in 8 of 8 Midterm Oct-Apr Windows, Averaging 14.51% Gains
Amphenol is heading toward a historically strong 193-day trading window just as shares hover near record highs and short interest spikes, setting up a rare clash between bullish seasonality and cautious positioning.
Price as of Sep 28, 2026: $84.62 (last close).

What is the seasonal pattern for Amphenol (APH)?
Amphenol has risen in 8 of 8 midterm-year Oct 20 to Apr 30 windows, with an average gain of 14.51% in winning years.
- 8 for 8 in this window, with Amphenol averaging 14.51% gains across all completed midterm-year Oct 20 to Apr 30 stretches.
- Percent Profitable is 100.0%, with 8 winners and 0 losers across the last 8 midterm election years.
- Trade Direction is long, with a TradeWave Ratio of 2.86 and a Sharpe ratio of 2.44 for this 193-day window.
- Cumulative return from stacking this specific window across cycles is 193.59%, highlighting a powerful recurring APH seasonal trend.
- Individual years have seen strong upside excursions, with maximum favorable moves reaching into the high teens and low 30s in % terms before the window closed.
- The upcoming window opens Oct 20, 2026 and runs into late April 2027, overlapping the transition from the midterm election year into the historically supportive pre-election year for risk assets.
According to historical data from TradeWave.ai, this midterm-year Oct-to-April stretch has behaved very differently from an average calendar period for Amphenol, and the next iteration is only weeks away.
How has Amphenol (APH) traded in past midterm-year Oct–Apr windows?
Amphenol has posted gains in every single Oct 20 to Apr 30 window across the last eight midterm election years, averaging 14.51% per cycle. Shares finished Monday at 84.62, up 0.63% on the day and about 1.2% below their 52-week high of 85.71, after a powerful 25.86% advance year to date. A sharp jump in short interest to 31,544,237 shares as of Sep 15, a 132.6% increase from late August, means more investors are leaning against the rally just as this historically strong seasonal regime approaches.[5]
Grouping the data by the presidential election cycle matters here because this window captures the late part of the midterm election year and runs into the start of the year before the presidential election. That transition has often coincided with clearer policy visibility, steadier fiscal planning and a friendlier backdrop for technology and electronic components stocks, which can amplify existing trends in names tied to AI infrastructure demand.[4]
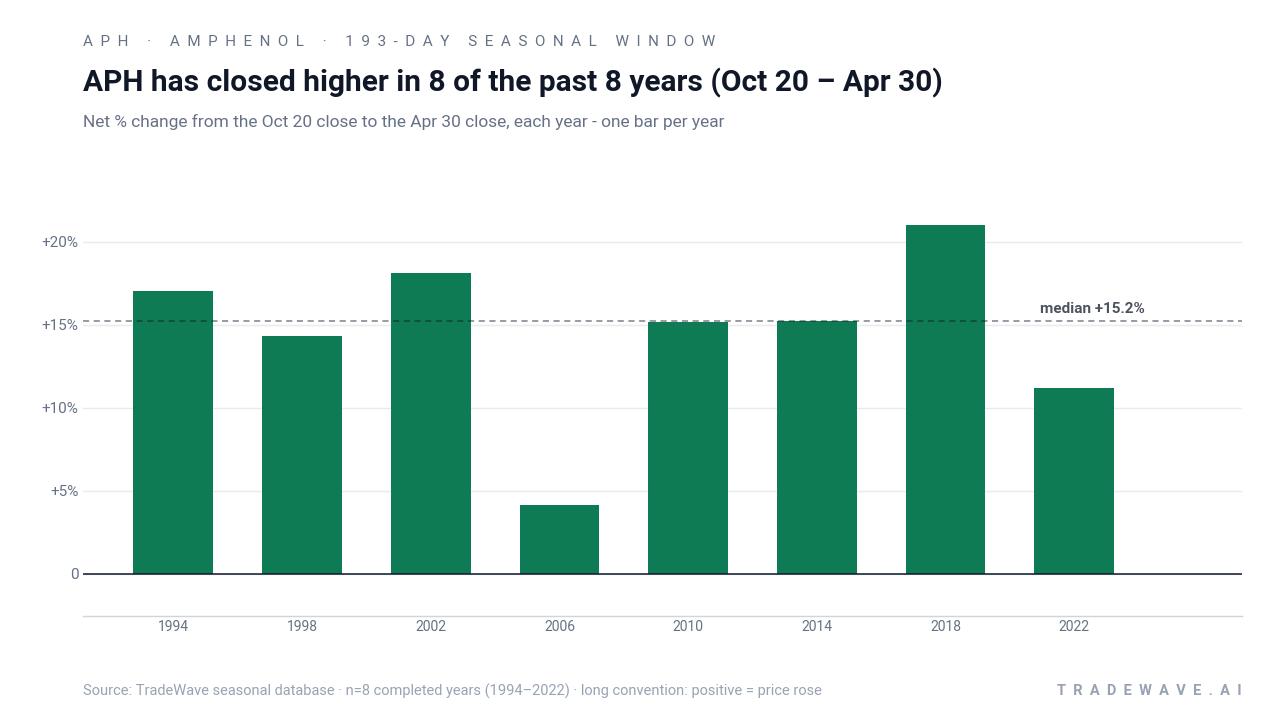
Across the eight completed midterm-year samples from 1994 through 2022, the pattern has been consistently favorable for long exposure. The strongest year in the sample was 2018, when the Oct 20 to Apr 30 window delivered a 20.98% net gain, while the softest was 2006, which still finished up 4.13%. Even the median outcome, at 15.2%, sits comfortably in double-digit territory, which is unusual for a single six-month slice of the calendar.
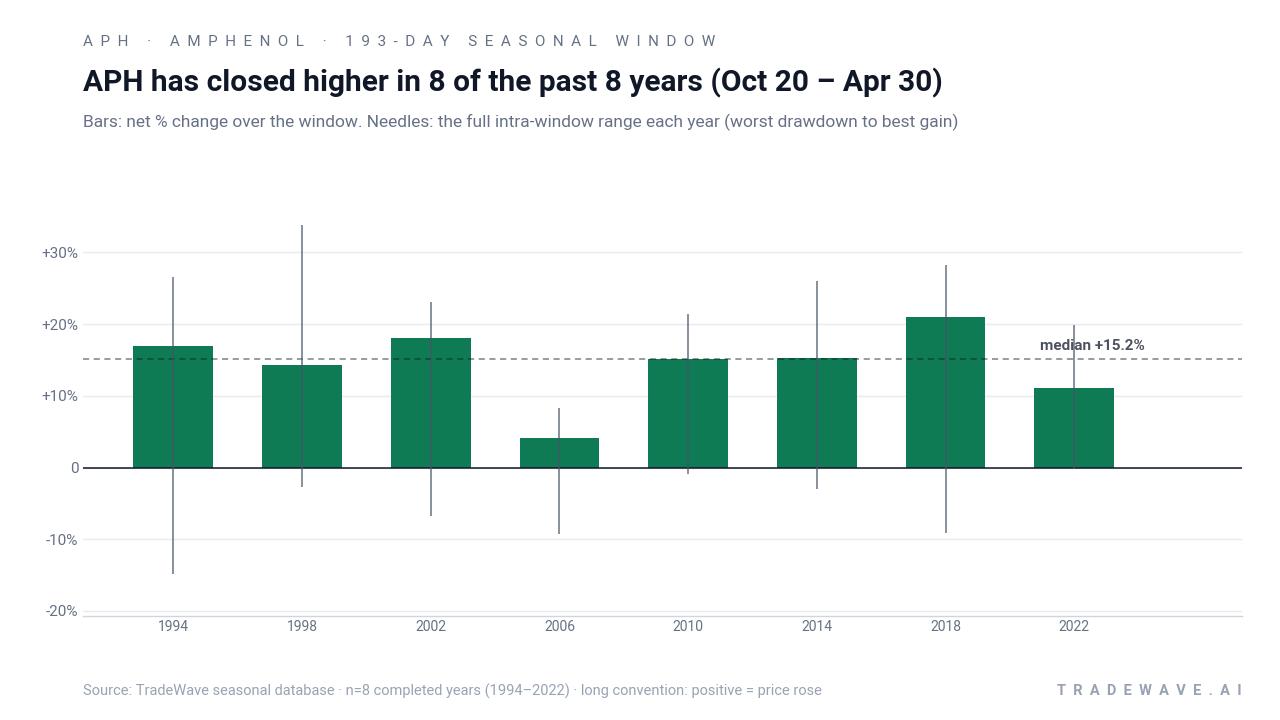
The intraperiod behavior has not been a straight line. In 1998, Amphenol’s best point-to-peak move within the window reached 33.78%, while the worst drawdown from entry was a relatively modest 2.68%. By contrast, 1994 saw a maximum favorable move of 26.6% but also a 14.83% adverse excursion at one point, showing that even winning years can involve sizable pullbacks before the trend reasserts itself. That mix of strong maximum favorable moves and sometimes deep maximum adverse moves is what the TradeWave Ratio of 2.86 is capturing: price has tended to travel meaningfully in the trade direction during this window.
A second view shows how yearly net results line up with the full intraperiod range of gains and drawdowns.
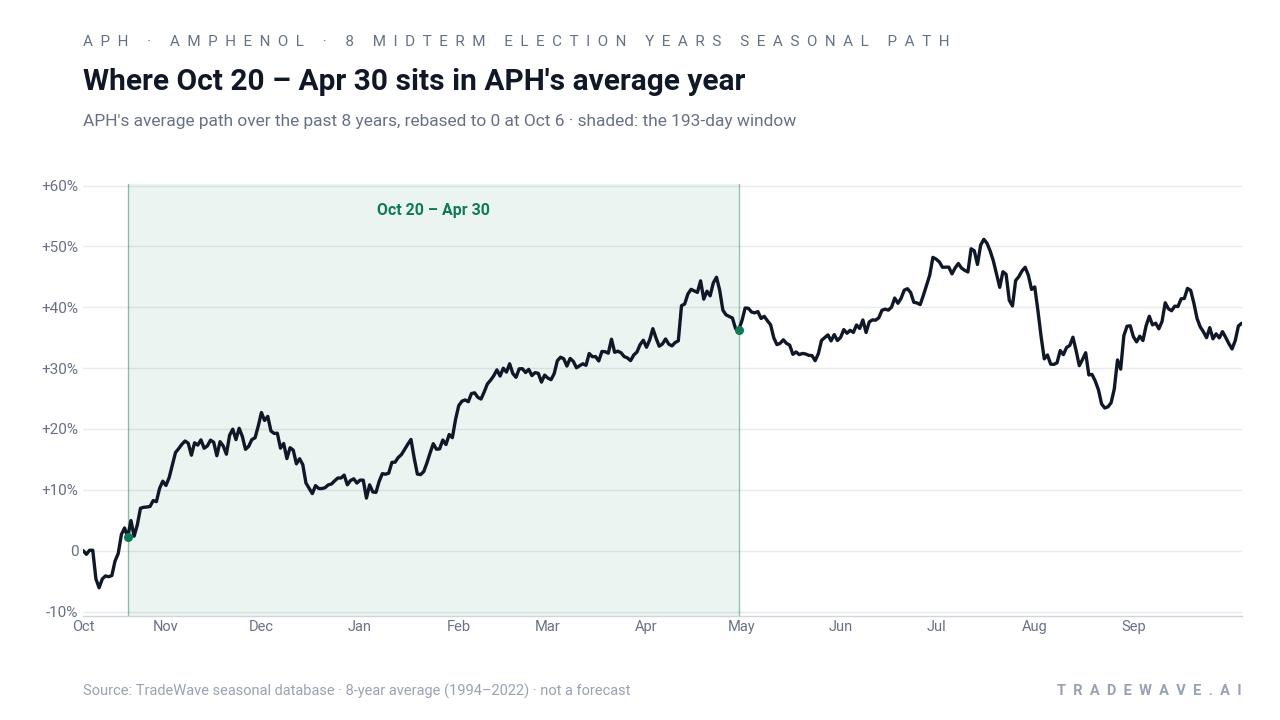
Viewed cumulatively, stacking this 193-day window across the eight midterm election years compounds to a 193.59% gain. Add it up: eight for eight, with every cycle contributing positively to that total. History does not guarantee a repeat, but the record heading into the 2026–2027 window is unusually clean for a single-stock seasonal pattern.
History does not guarantee future results; adverse excursions can be large even in winning windows, and traders should be prepared for volatility inside the pattern.
Why does Amphenol (APH) follow this seasonal pattern?
One likely driver is the way Amphenol’s earnings calendar clusters around late October and late January, which often sets the tone for the following quarters in technology hardware and electronic components.[3] Analysts have also pointed to institutional portfolio repositioning around the midterm-to-pre-election transition, when investors tend to lean back into growth and AI infrastructure themes as policy uncertainty clears.[4] The combination of earnings catalysts, sector rotation and a friendlier macro risk appetite in this phase may help explain why the Oct 20 to Apr 30 window has repeatedly favored long exposure in APH.
What is driving Amphenol (APH) today?
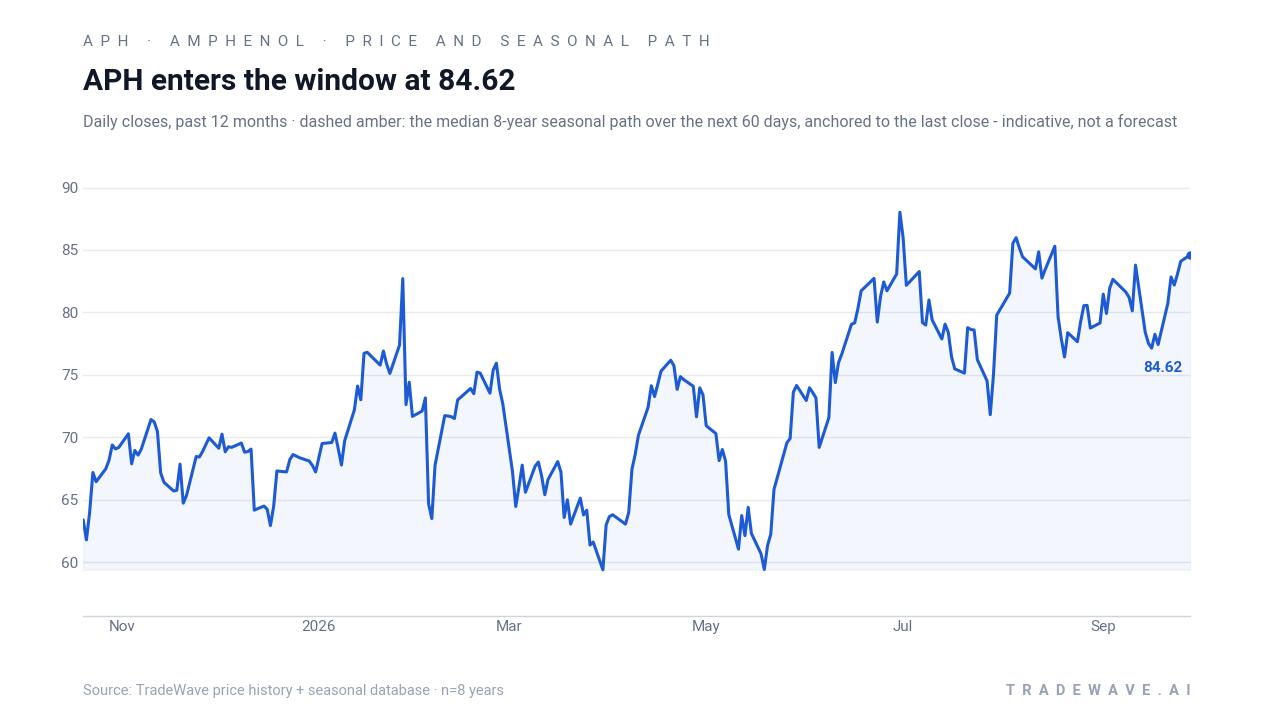
Amphenol closed Monday at 84.62, up 0.53 on the session, leaving the stock about 1.2% below its 52-week high of 85.71 and up 25.86% so far in 2026. The move comes against a backdrop of strong demand for AI infrastructure and data communications hardware, where Amphenol is widely cited as a key beneficiary within the electronic components sector.[4] Fresh research coverage keeps the stock in Buy territory on Wall Street, reflecting confidence that AI datacom spending and record order trends can support earnings into 2027.[3]
Positioning, however, has turned more cautious. MarketBeat data show short interest climbing to 31,544,237 shares as of Sep 15, a 132.6% jump from Aug 31, with a short-interest ratio of about 2.7 days and roughly 1.3% of the float sold short.[5] That shift follows a period of heavy trading, including a volume spike to 10,143,289 shares on a recent session versus average volumes around 11.5 million, and comes on top of a series of insider sales in 2025 and 2026 that totaled roughly $60.2 million in value.[5][6][9] Options markets are active as well, with detailed chains showing robust open interest across multiple strikes and expiries as traders calibrate exposure into the late-October earnings report and the upcoming seasonal window.[7]
The chart below situates the latest move in its recent multi-month context alongside the median historical seasonal path.
What should traders watch as the Oct 20 window approaches?
First, the calendar. The 193-day window opens on Oct 20 and runs through Apr 30, overlapping Amphenol’s scheduled Q3 2026 earnings on Oct 28 and the early months of the year before the presidential election.[1] Historically, that combination of earnings catalysts and a friendlier macro risk tone has lined up with the stock’s strongest seasonal stretch, so how APH trades around those dates will be an early tell on whether the pattern is repeating.
Second, levels. With the stock sitting just below its 52-week high, traders will be watching whether APH can sustain prices in the mid-80s and build a base above the prior high as the window opens, or whether any pullback resembles the deeper intraperiod drawdowns seen in years like 1994 and 2006. A quick rejection from the high with expanding volume would look more like those choppier historical years, even if the window ultimately finished higher.
Third, positioning. The recent surge in short interest means there is more fuel on the short side than earlier in the year.[5] If the stock starts to follow its historical seasonal pattern higher, traders will be watching whether shorts cover into strength, which could add momentum, or whether bearish bets continue to build, signaling skepticism about the AI infrastructure story despite the favorable seasonal backdrop.[4][5]
Finally, insider and options activity. Additional insider selling or a shift toward more aggressive downside hedging in the options market would suggest that corporate insiders and sophisticated traders are leaning against the historical pattern.[6][7][9] On the other hand, a cooling of insider sales and a tilt toward call buying or reduced put open interest would be more consistent with the eight-for-eight track record that has defined this Amphenol trading window so far.
Sources
- The Wall Street Journal - Amphenol Corp. Cl A (APH) Stock Price Today - The Wall Street Journal
- Yahoo Finance - Amphenol Corporation (APH) Stock Price, News, Quote & History - Yahoo Finance
- Barron's - Amphenol Corp. Cl A Research & Ratings | APH | Barron's
- Seeking Alpha - Amphenol Corporation (APH) Stock Price, Quote, News & Analysis | Seeking Alpha
- MarketBeat - Amphenol Corporation (NYSE:APH) Stock Short Interest Climbs 132.6%
- MarketBeat - Amphenol (APH) Insider Trading Activity 2026
- MarketBeat - Amphenol (APH) Options Chain & Prices 2026
- Yahoo Finance (article) - Is Amphenol Corporation (APH) A Good Stock To Buy Now?
- Yahoo Finance - Amphenol Corporation (APH) Recent Insider Transactions
- Barchart - APH Trader's Cheat Sheet for Amphenol Corp Stock - Barchart.com
About this seasonal analysis
Seasonal pattern data is sourced from TradeWave.ai, which analyzes historical price behavior across annual calendar windows going back up to 30 years. Read the full data methodology or the book The 100-Year Pattern by Afshin Moshrefi (2026 edition). Past performance of seasonal patterns does not guarantee future results. This article is for informational purposes only and does not constitute investment advice.