Advanced Micro Devices (AMD) Has Dropped in 10 of 10 Late-Sep Midterm Windows, Averaging 16.53% Short Profits
Advanced Micro Devices is sprinting higher on AI enthusiasm just days before a late-September midterm election-year window that has been reliably bearish for the stock.
Price as of Sep 17, 2026: $545.09 (last close).

What is the seasonal pattern for Advanced Micro Devices (AMD)?
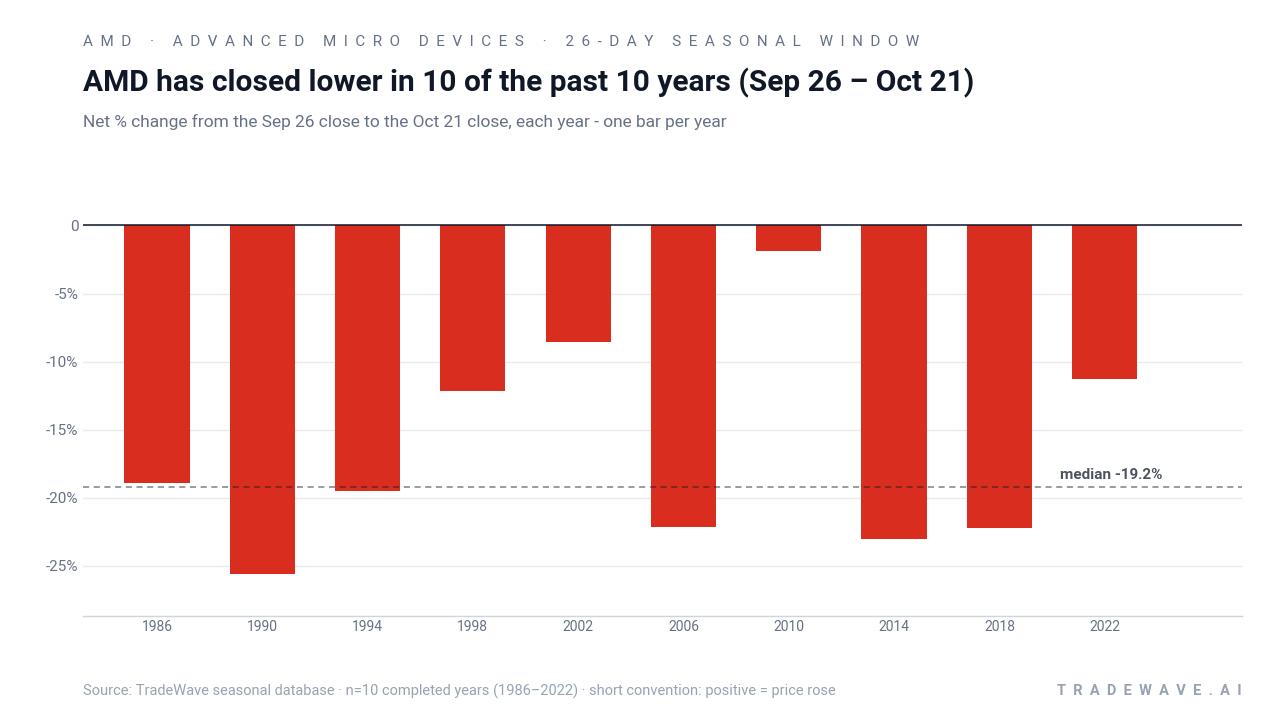
Advanced Micro Devices has fallen in 10 of 10 years during this late-September to late-October midterm election-year window, with an average gain of 16.53% in winning years for a short trade.
- 10 for 10 in this window for short trades, with an average profit of 16.53% across all years.
- Seasonal direction is bearish for AMD from Sep 26 through Oct 21 in the last 10 midterm election years.
- Percent Profitable is 100.0%, with 10 winners and 0 losers for the short-side pattern.
- Median profit on winning shorts is 19.22%, highlighting how often the stock has broken lower in this slice of the calendar.
- The TradeWave Ratio of 2.22 signals that price has typically traveled meaningfully in the trade direction within the window, while the Sharpe ratio of 2.12 reflects strong risk-adjusted returns for the pattern.
- Individual years have seen adverse moves against the short before working, so intraperiod drawdowns have been material even in ultimately profitable windows.
According to historical data from TradeWave.ai, this late-September stretch has behaved very differently from an average month for AMD in past midterm election years, and the next iteration is about to open again.
How has Advanced Micro Devices (AMD) traded in the late-September midterm window?
Advanced Micro Devices has dropped in every single late-September to late-October midterm election-year window across the last 10 cycles, with shorts averaging 16.53% profits over 26 days. Shares finished Friday at 545.09, up 6.4% on the day and about 6.8% below their 52-week high of 584.73, after a powerful AI-driven run that has pushed the stock far above its 50-day moving average of 495.03. Freshly, an AMD executive sold 17,261 shares on Sep 17, 2026, a reminder that some insiders are taking chips off the table into this strength.[9]
Because this pattern is grouped by the presidential election cycle, it only looks at AMD’s behavior in the year after the presidential election, which is the midterm election year. The current calendar is in the late part of that midterm year, just before markets transition into the historically more supportive pre-election year, so this window captures how AMD has traded as policy uncertainty around regulation, spending and rates peaks before the next phase of the cycle.
This seasonal window begins on Sep 26, 2026 and spans 26 days. Historically, during this period in midterm election years, AMD has been a weak spot, with the stock closing lower in all 10 prior windows when measured from the Sep 26 close to the Oct 21 close. The trade direction is short, so those negative returns represent profitable years for traders positioned for downside in this specific Advanced Micro Devices trading window.
The win-loss record is unusually clean. Percent Profitable is 100.0%, with 10 winners and 0 losers, and the median profit for the short trades is 19.22%. Average profit across all years is 16.53%, which means the typical midterm-year late-September seasonal pattern has delivered a double-digit move in favor of the short side.
The per-year table shows how consistent that has been. The strongest year for the pattern was 1990, when AMD fell 25.58% between the Sep 26 and Oct 21 closes, while the weakest year for shorts was 2010, when the stock slipped just 1.85% over the same dates. Even in that softer outcome, the short still finished ahead, which is why there are no losing years in this sample.
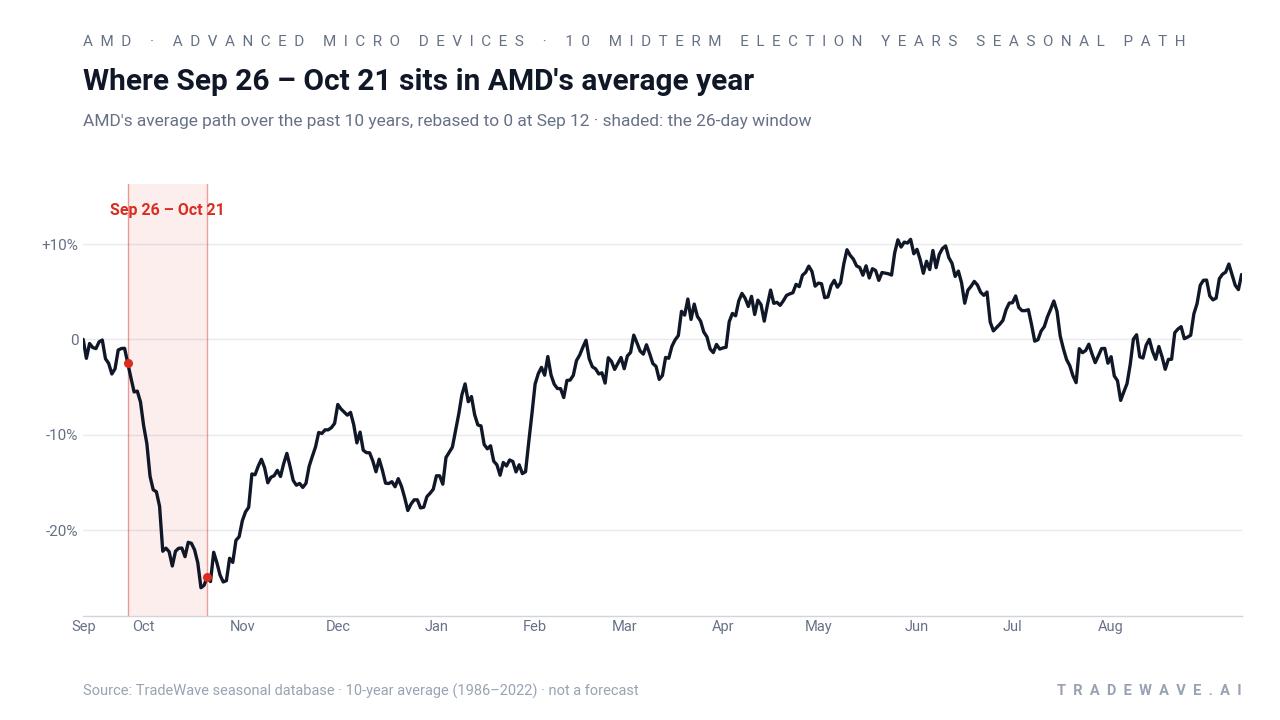
A second view of the same window highlights how far AMD has tended to swing inside the range before the final close.
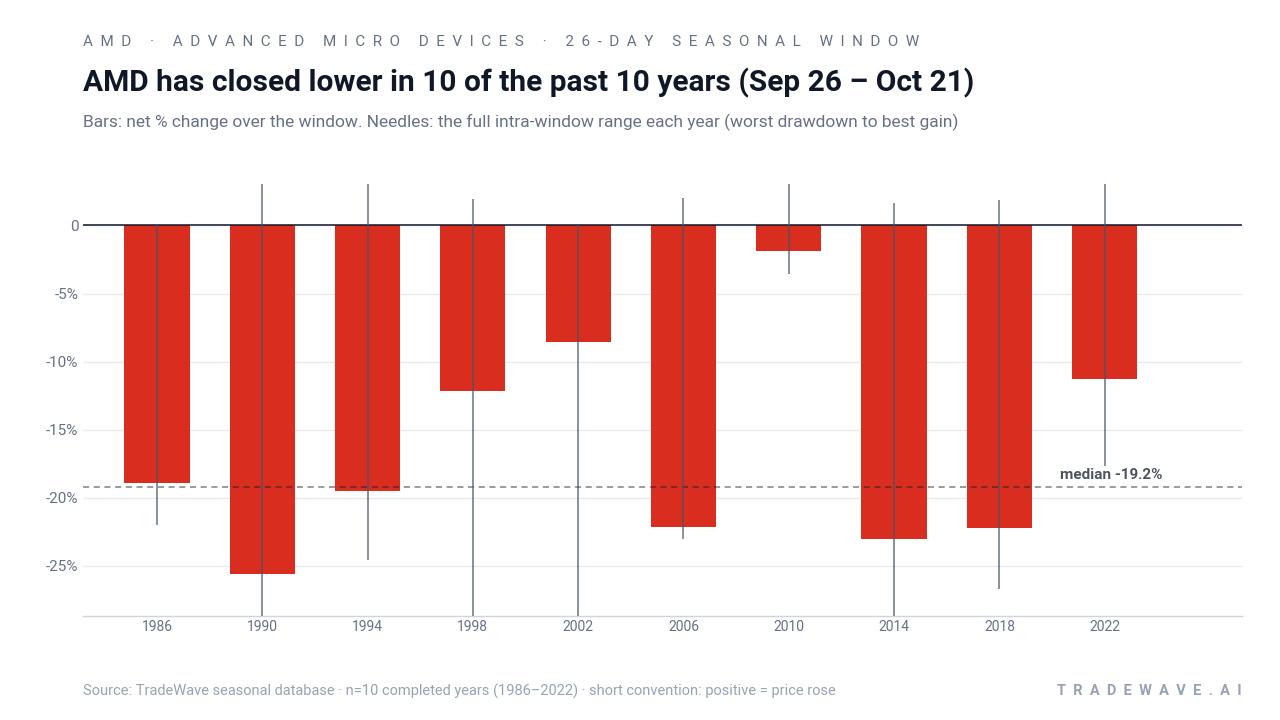
The maximum favorable move and maximum adverse move profile is what makes this AMD seasonal trend so striking. In 2002, for example, the stock’s worst drawdown from the entry during the window was 48.93%, while the final net decline was a more modest 8.57%, showing how deep the intraperiod swings can be even when the closing result is smaller. In stronger years like 1994 and 2018, AMD’s best point-to-peak moves in the trade direction lined up more closely with the final net returns, which is consistent with the TradeWave Ratio of 2.22 that signals meaningful travel in the short direction within the window.
Put together, the cumulative return chart for this window compounds to 352.42% across the 10 completed midterm election years. That is the effect of stacking a 26-day short pattern that has never lost money in this sample.
History does not guarantee future results; adverse excursions (MAE) can be large even in winning windows, and AMD’s intraperiod swings have at times been far larger than the final net move.
Why does Advanced Micro Devices (AMD) follow this seasonal pattern?
One likely driver is the way AMD’s earnings calendar and product launches cluster around the back half of the year, when guidance resets and data-center spending commentary can shift sentiment quickly.[3][4] Analysts have also pointed to broader semiconductor sector rotation in midterm election years, as investors rebalance AI and chip exposure ahead of potential policy or regulatory changes that tend to surface before the pre-election year.[4] This pattern may reflect that combination of earnings risk, portfolio repositioning and macro uncertainty converging in a tight late-September to late-October window.
What is driving Advanced Micro Devices (AMD) today?
AMD closed Friday at 545.09, up 6.4% on the session, after another burst of enthusiasm around its role in AI infrastructure, leaving the stock about 6.8% below its 52-week high of 584.73 and well above its 50-day moving average of 495.03. The move extends a powerful run that accelerated after AMD’s Q1 2026 report in May highlighted surging demand for MI450 accelerators and Helios systems tied to hyperscaler AI build-outs.[5]
In August, coverage ahead of AMD’s Q2 2026 earnings focused on whether the company could sustain that AI momentum and justify a rich valuation, with Wall Street watching data-center revenue and guidance closely.[3][4] The broader macro backdrop has been defined by investors crowding into AI and semiconductor leaders as a core growth theme, even as chip stocks have periodically wavered on rate and demand worries.[4]
At the same time, positioning around AMD has become more complex. MarketBeat’s short-interest data through late August 2026 shows that shares shorted have fluctuated over the past year, reflecting an active tug-of-war between bulls and bears.[7] On Sep 17, 2026, MarketBeat reported that an AMD executive vice president sold 17,261 shares, a modest but timely insider sale that lands just as the stock trades near the upper end of its recent range.[9]
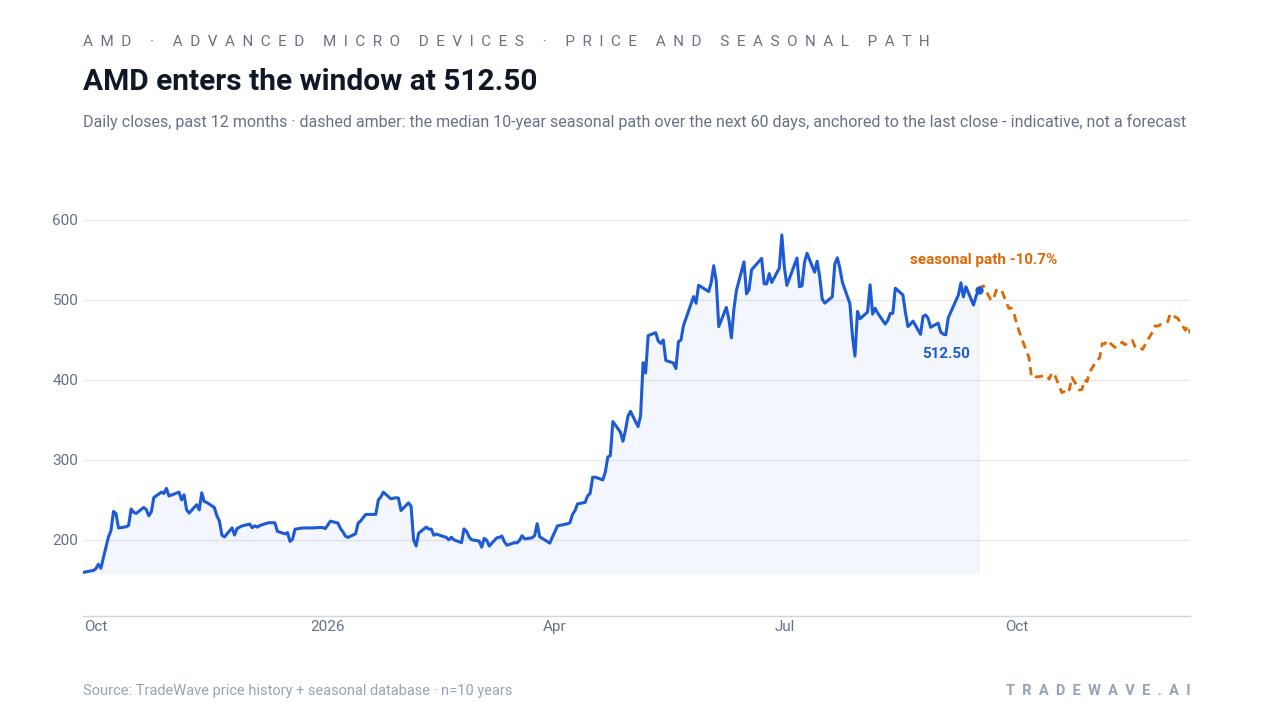
The chart below situates the latest move in its recent multi-month context alongside the historical seasonal projection.
How does the election cycle shape AMD’s seasonal outlook?
Pattern phase equals midterm election year, and the calendar is also in the midterm election year, but in the late part of that phase. Historically, midterm years have been “two-playbook” environments for equities: a choppier first half followed by a stronger stretch that begins in late September as markets look ahead to the pre-election year. For AMD, this specific late-September window has not been part of that relief rally; instead, it has been a pocket of weakness inside the broader transition, with the stock repeatedly sliding even as the wider market often starts to firm.
That tension matters because AMD is now a core component of the AI and semiconductor complex that helps drive major indices.[4] The stock’s current uptrend, powered by AI demand and aggressive revenue growth expectations, runs directly into a historical seasonality regime that has favored downside in every midterm cycle in the dataset. If volatility picks up in AMD during this window, it could ripple through AI peers and broader tech benchmarks that have leaned heavily on chip leaders for performance.
What should traders watch in this AMD seasonal window?
First, the calendar: the 26-day window from Sep 26 to Oct 21 has been a cleanly negative stretch for AMD in the last 10 midterm election years, with shorts profitable every time. Traders watching this AMD seasonal pattern will be focused on whether the stock continues to respect that historical bias or whether the current AI-driven bull run overwhelms it.
Second, price levels and behavior relative to the 52-week band and the 50-day moving average matter. A break back below the 50-day line near 495 during the window would look more like prior midterm-year patterns, while a sustained push toward or through the 52-week high around 584.73 would mark a clear departure from the historical script.
Third, the policy and macro calendar into October is important. Any shifts in guidance from AMD’s peers, changes in AI capex commentary, or macro headlines that alter expectations for regulation or fiscal support into the pre-election year could either reinforce or blunt the usual midterm-year pressure on high-multiple chip names.[4]
Finally, traders should keep an eye on positioning and insider activity. The recent insider sale is small in absolute terms but timely, landing just ahead of a window that has historically been unfriendly to AMD’s share price.[9] If that is followed by heavier insider selling, a rebuild in short interest, or a cooling of the aggressive options activity that has surrounded AMD in 2026, it would align with the historical seasonal pattern; if instead bullish positioning accelerates and insiders step back from selling, it would signal that this cycle may diverge from the past.
Sources
- The Motley Fool - AMD Stock Slips Despite 30% Earnings Growth and Stronger-Than-Expected Guidance - The Motley Fool
- Seeking Alpha - AMD stock rating split: Quant still sees Buy, but SA analysts are on Hold (AMD:NASDAQ)
- Yahoo Finance / The Motley Fool (republished) - AMD Reports Tuesday. One Number Decides Whether 54 Times Forward Earnings Was Ever Defensible.
- Yahoo Finance - AMD to report Q2 earnings as chip stocks continue to waver - Yahoo Finance
- Yahoo Finance (GuruFocus republished) - AMD Jumps on AI Surge, Profit Nearly Doubles
- Seeking Alpha - AMD options traders price ~9% post-earnings move (AMD:NASDAQ)
- MarketBeat - Advanced Micro Devices (AMD) Short Interest & Short Float | Updated Sep 2026
- Barchart - Heavy Advanced Micro Devices Call Options Volume Today - Is AMD Undervalued?
- MarketBeat - Insider Selling: Advanced Micro Devices (NASDAQ:AMD) EVP Sells 17,261 Shares
About this seasonal analysis
Seasonal pattern data is sourced from TradeWave.ai, which analyzes historical price behavior across annual calendar windows going back up to 30 years. Read the full data methodology or the book The 100-Year Pattern by Afshin Moshrefi (2026 edition). Past performance of seasonal patterns does not guarantee future results. This article is for informational purposes only and does not constitute investment advice.