S&P Global (SPGI) Has Risen in 10 of 10 Midterm Oct-Jun Windows, Averaging 24.4% Gains
S&P Global is heading toward an Oct 6–Jun 15 window that has been quietly powerful in past midterm election years, even as the stock trades well below its recent peak after a sharp pullback.
Price as of Sep 8, 2026: $429.31 (last close).

What is the seasonal pattern for S&P Global (SPGI)?
S&P Global has risen in 10 of 10 midterm-year Oct 6–Jun 15 windows, with an average gain of 24.4% in winning years.
- 10 for 10 in this window, with S&P Global averaging 24.4% gains across all completed Oct 6–Jun 15 midterm-year cycles.
- Percent Profitable is 100%, with 10 winners and 0 losers in the historical sample for this SPGI seasonal trend.
- The strongest year in this S&P Global trading window delivered a 44.25% gain, while the weakest still finished up 6.4%.
- Intraperiod swings have been meaningful, with worst drawdowns inside the window reaching as deep as about 17% in some years.
- The TradeWave Ratio of 1.88 signals that price has typically traveled far in the long direction within the window, while the Sharpe ratio of 2.16 points to strong risk-adjusted returns.
- This 253-day stretch runs from Oct 6 through mid-June of the following year and lines up with the transition from the midterm election year into the historically supportive pre-election year for equities.
According to historical data from TradeWave.ai, this long Oct 6–Jun 15 stretch has behaved very differently from an average calendar period for S&P Global, especially in midterm election years.
How has S&P Global (SPGI) traded in the Oct 6–Jun 15 midterm-year window?
S&P Global has closed higher in every single Oct 6–Jun 15 midterm-year window across the last 10 cycles, averaging a 24.4% gain for long positions. Today the stock finished at 429.31, down 3.2% on the session and sitting about 11.9% below its 52-week high of roughly 487.53, after a volatile year that has already seen a deep pullback and partial recovery.
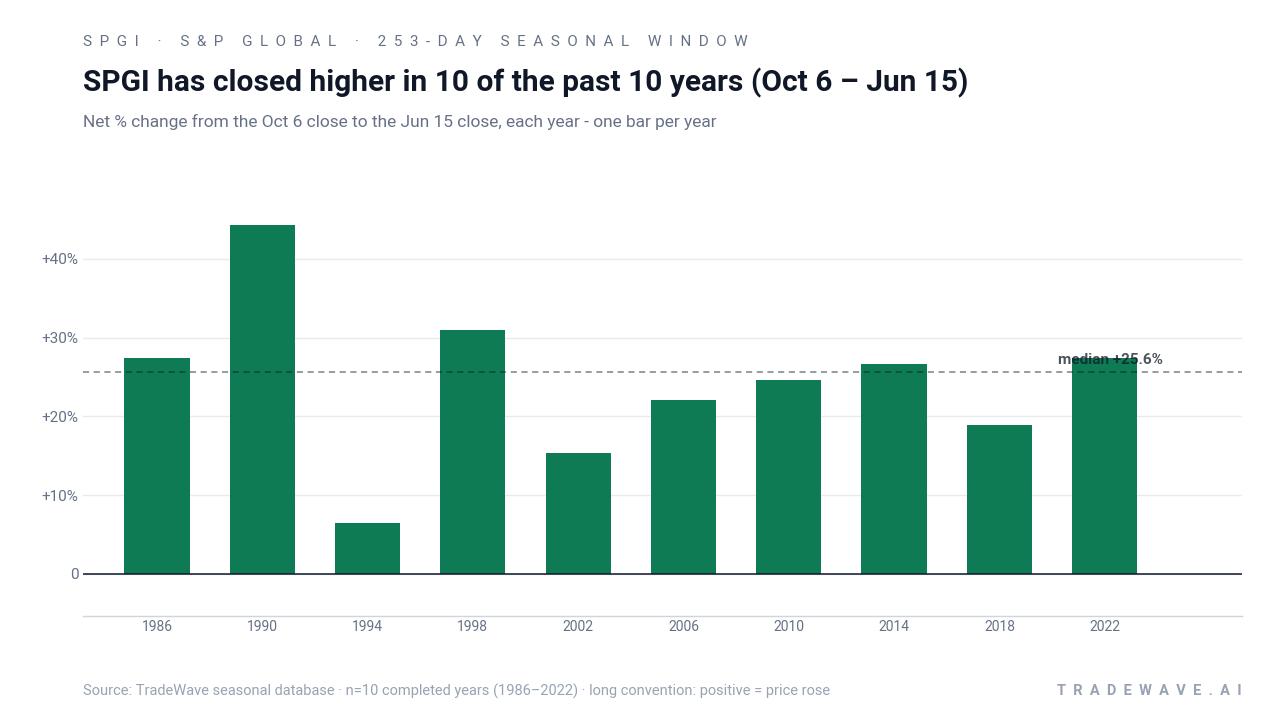
The Oct 6–Jun 15 window spans 253 calendar days and, in this dataset, covers the last 10 midterm election years, from 1986 through 2022. The trade direction is explicitly long, and every one of those 10 windows finished with a positive net return, from a low of 6.4% in 1994 to a high of 44.25% in 1990. Average profit across all years is 24.4%, with a median outcome of 25.58%, which means the typical winning year has delivered a mid‑20s gain rather than being skewed by a single outlier.
Intraperiod behavior has been more volatile than the clean win‑loss record suggests. Maximum favorable moves inside the window have ranged from about 6.76% in 1994 to more than 53.91% in 1998, showing that in strong years SPGI has often pushed well beyond its eventual close before consolidating. On the downside, maximum adverse moves have reached as deep as roughly 17.31% in 2018, and several other years saw drawdowns of 8% to 12% before the stock recovered into a positive finish.
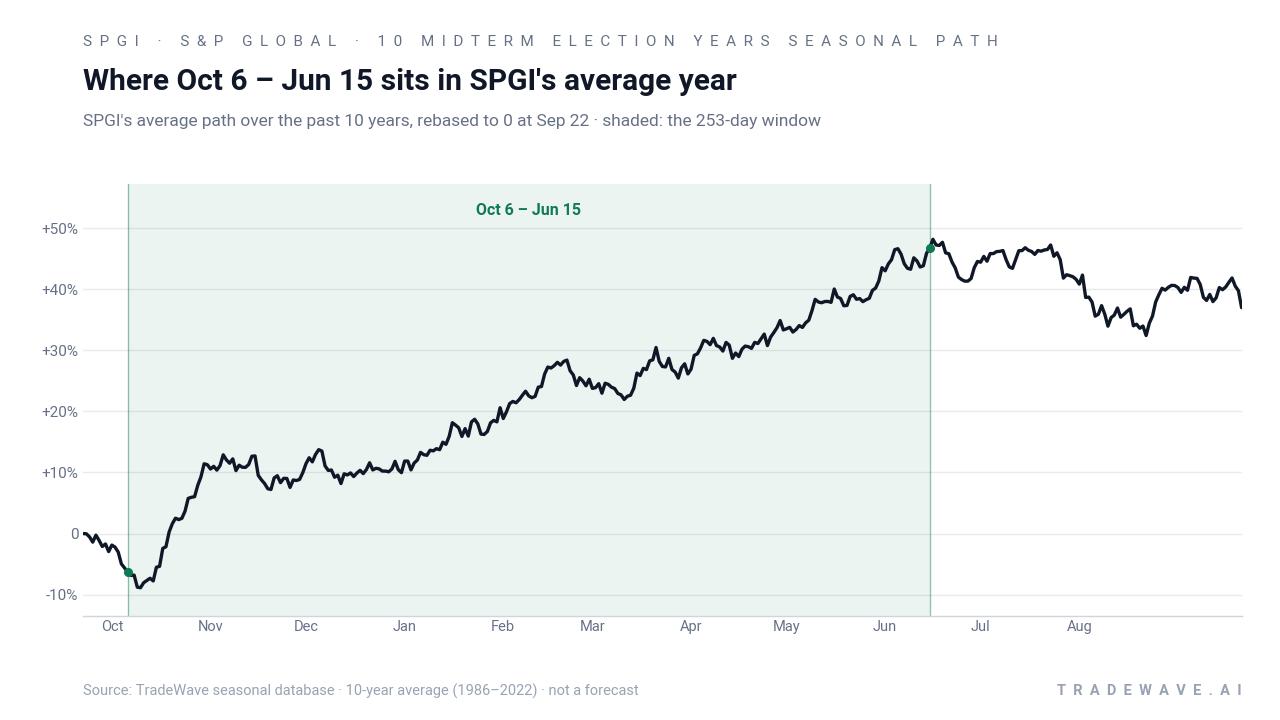
A second view shows how each year’s best rally and worst drawdown have stacked up inside this same window.
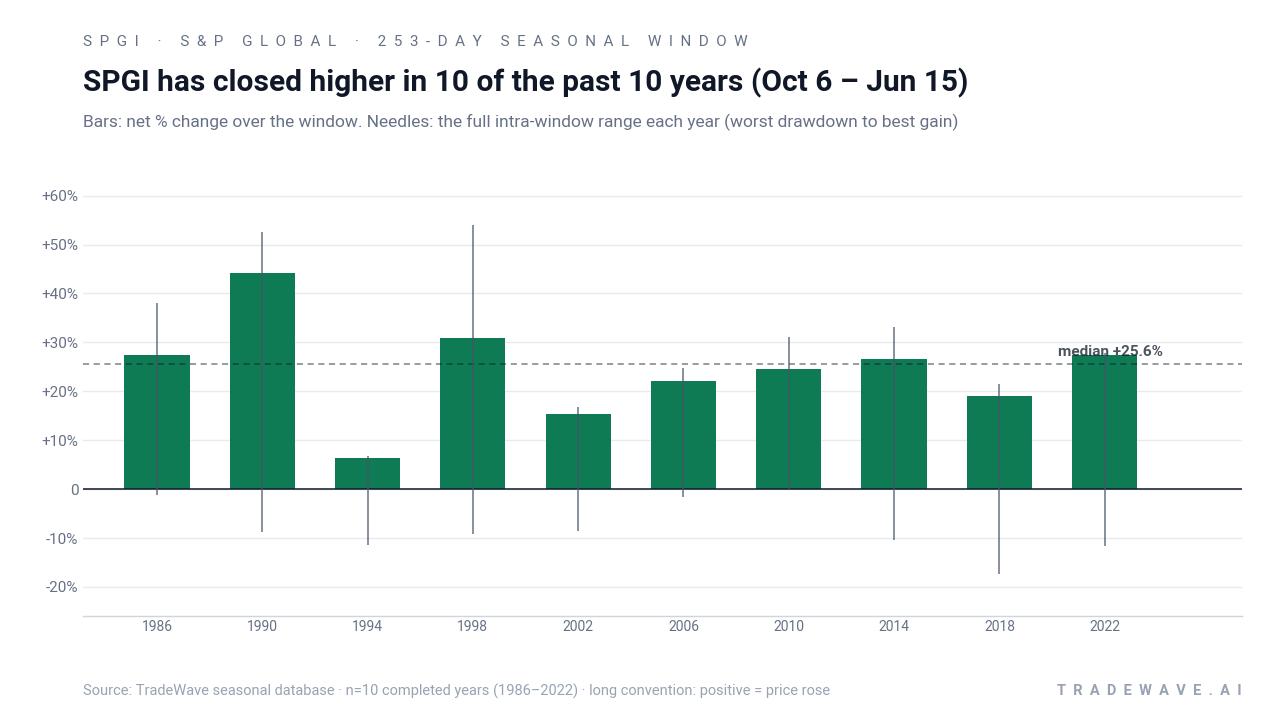
The combined net, best‑case and worst‑case profile shows a window that has historically rewarded patience but not complacency. Years like 1998 and 2022 paired 27% to 31% net gains with intraperiod rallies that briefly ran into the 28% to 54% zone, while still enduring drawdowns of roughly 9% to 12%. Add it up and the pattern is clear: this has been a long‑biased regime where SPGI has tended to trend higher across the midterm‑to‑pre‑election bridge, but with enough volatility inside the window to test conviction.
History does not guarantee future results; adverse excursions (MAE) can be large even in winning windows.
Why does S&P Global (SPGI) follow this seasonal pattern?
One likely driver is the way the presidential election cycle shapes risk appetite, with investors often de‑risking early in midterm years and then adding exposure as policy uncertainty clears into the pre‑election year. For a financial data and analytics provider like S&P Global, that shift can coincide with stronger issuance, more demand for ratings and benchmarks, and renewed interest in equity‑linked products. The pattern may also reflect institutional portfolio rebalancing and budget cycles, which tend to support recurring subscription and analytics spending from late autumn through mid‑year.
What is driving S&P Global (SPGI) today?
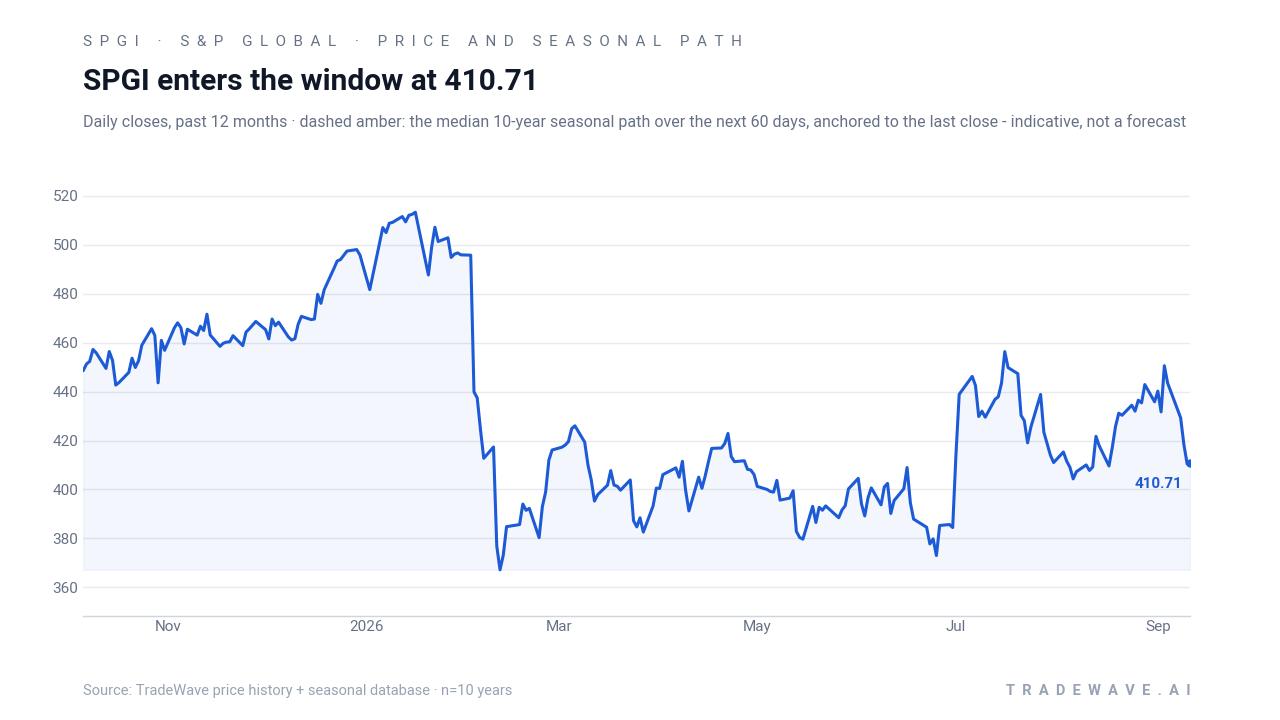
S&P Global closed at 429.31 on Sep 9, down 3.2% on the day, after trading between 429.07 and 442.53 in a heavy session that saw volume near its recent 20‑day average of about 1.84 million shares. The stock is roughly 11.9% below its 52‑week high near 487.53 and still well above its 52‑week low around 336.89, with the 50‑day moving average sitting close by at 424.88, a sign that price has been consolidating after a strong rebound from last year’s lows.
In February 2026, the company issued full‑year 2026 profit guidance of $19.40 to $19.65 per share, below analyst estimates at the time, and the stock sold off sharply as investors recalibrated growth expectations.[2] Later, in April 2026, S&P Global reported first‑quarter revenue of $4.17 billion, up 10% year on year, and earnings of $4.69 per share, helped by strong demand for analytics products and risk tools as market volatility and geopolitical uncertainty kept clients engaged.[3] In February 2026, sector commentary also highlighted S&P Global’s expansion into private markets and AI‑powered products as a key support for organic revenue growth and margin expansion, even as investors weighed the broader impact of AI disruption across software and services.[1][2]
In February 2026, market coverage noted S&P Global among stocks making large intraday moves after its guidance update, underscoring how sensitive the shares can be to shifts in earnings expectations and macro tone.[4] In July 2026, filings compiled by Yahoo Finance showed multiple insider transactions, including derivative conversions and sales by officers during late 2025 and mid‑2025, which investors often read as routine portfolio management rather than a clear directional signal for the stock.[5]
The chart below situates the latest move in its recent multi-month context alongside the median 60‑day seasonal path.
What should traders watch as the Oct 6 seasonal window approaches?
First, the calendar. The upcoming Oct 6–Jun 15 stretch sits in the concluding phase of the midterm election year and runs deep into the pre‑election year, a part of the presidential cycle that has historically been supportive for risk assets. For S&P Global, the last 10 midterm‑year iterations of this window have all finished positive, so traders will be watching whether the stock can stabilize above its 50‑day moving average and build a base into early October that resembles prior cycles.
Second, earnings and guidance updates. While the next formal earnings date is not yet set, the February 2026 guidance reset and April 2026 results showed how quickly sentiment can swing when management tweaks its outlook or when demand for analytics and ratings accelerates or cools.[2][3] Any fresh commentary on AI‑driven products, private‑markets expansion or the impact of geopolitical volatility on client demand could influence how investors lean into or away from this historically strong seasonal window.[1][3]
Third, price levels and volatility inside the window. Historically, even winning years have seen drawdowns of 8% to 17% before recovering, so traders may focus on how SPGI behaves on pullbacks once the window opens. A pattern of shallow dips that hold above key moving averages would rhyme with the stronger historical years, while a deeper break that undercuts the 52‑week low would mark a clear departure from the past seasonal script.
Finally, broader policy and macro headlines. Because this window bridges the end of the midterm election year and the start of the pre‑election year, shifts in fiscal policy, regulation of financial markets and the pace of rate moves can all feed into issuance volumes and demand for S&P Global’s data and ratings. If policy developments support continued capital‑markets activity and risk appetite, that would align with the historical pattern of strong SPGI performance in this stretch; a more restrictive or shock‑driven backdrop could test how durable that 10‑for‑10 record really is.
Sources
- Forbes - S&P Global Stock Now 32% Cheaper: Is It Time To Buy?
- Reuters - S&P Global forecasts 2026 profit below estimates, shares plunge
- Reuters - S&P Global reports higher first-quarter profit on demand for analytics products
- CNBC - Stocks making the biggest moves midday: Ferrari, Incyte, S&P Global, Datadog, BP and more
- Yahoo Finance - S&P Global Inc. (SPGI) Recent Insider Transactions - Yahoo Finance
About this seasonal analysis
Seasonal pattern data is sourced from TradeWave.ai, which analyzes historical price behavior across annual calendar windows going back up to 30 years. Read the full data methodology or the book The 100-Year Pattern by Afshin Moshrefi (2026 edition). Past performance of seasonal patterns does not guarantee future results. This article is for informational purposes only and does not constitute investment advice.