Near 52-Week Lows, Amphenol (APH) Enters a Historically Powerful 202-Day Midterm Run
Amphenol is approaching a historically strong 202-day midterm-election seasonal window even as the stock trades just above its 52-week low after a steep pullback.
Price as of Sep 10, 2026: $80.25 (last close).

What is the seasonal pattern for Amphenol (APH)?
Amphenol has risen in 8 of 8 midterm-election-year Sep 18 to Apr 7 windows, with an average gain of 11.66% in winning years.
- 8 for 8 in this window, with Amphenol averaging 11.66% gains in winning years across the last 8 midterm election cycles.
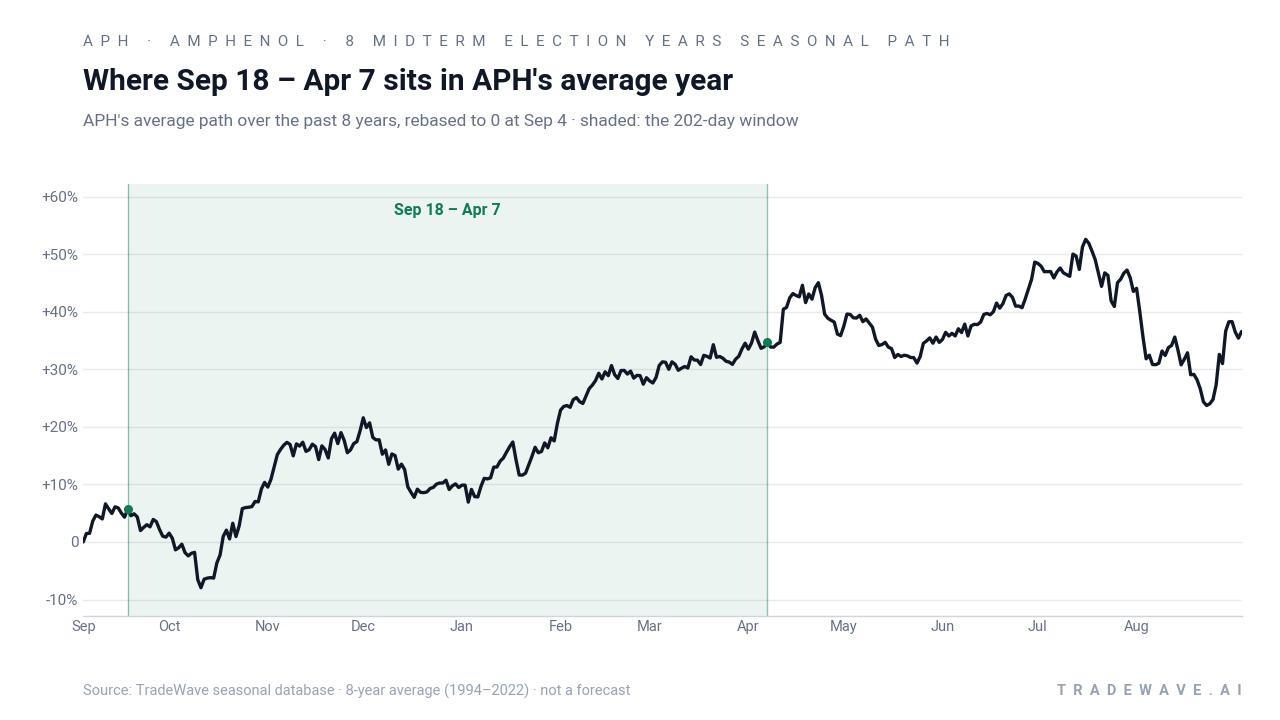
- The upcoming seasonal window runs from Sep 18 to Apr 7, spanning 202 days and aligning with the late part of the midterm election year.
- Percent Profitable is 100%, with 8 winners and 0 losers in the historical sample for this Amphenol trading window.
- Average profit of 11.66% comes with a Sharpe ratio of 3.08, indicating unusually strong risk-adjusted returns for a single recurring slice of the calendar.
- The TradeWave Ratio (TWR) of 2.46 suggests price has typically traveled meaningfully in the long direction within the window, even before the final close.
- Individual years have still seen double-digit drawdowns inside the window, so the historical edge has come with real volatility along the way.
According to historical data from TradeWave.ai, this specific midterm-election stretch has behaved very differently from an average six-month period for Amphenol, and the next iteration is about to start.
How has Amphenol (APH) traded in the Sep 18 to Apr 7 midterm-year window?
Amphenol has closed higher in every single Sep 18 to Apr 7 window across the last 8 midterm election years, averaging 11.66% gains with no losing cycles. Shares finished the prior session at 80.25, down 1.3% on the day and sitting about 1.2% above their 52-week low of 79.33 while more than 50% below the 52-week high of 178.52. That combination of a strong historical seasonal trend and a stock pinned near the bottom of its one-year range gives this upcoming window unusual tension.
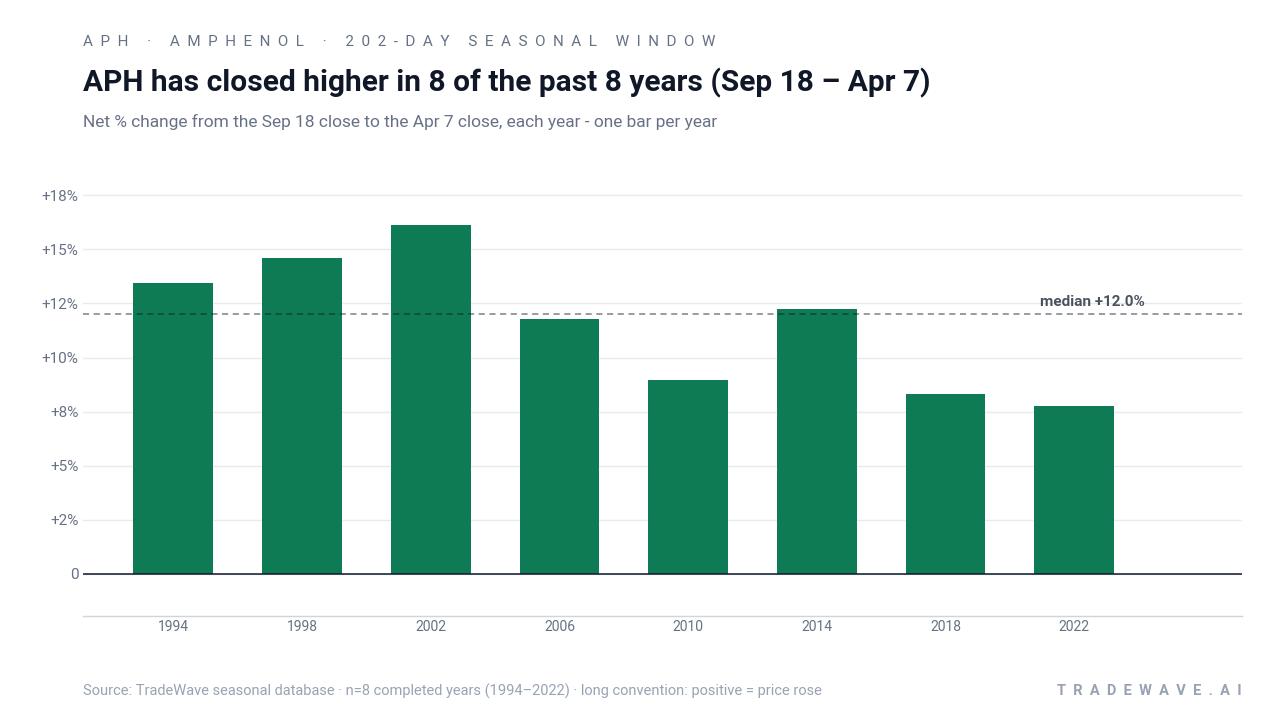
The pattern is built on the last 8 midterm election years, so it lines up with the same phase of the presidential cycle that markets are concluding today. Grouping by the election cycle matters here because policy uncertainty, fiscal debates and rate expectations tend to cluster in midterm years, and that backdrop has historically shaped how growth and AI-adjacent hardware names like Amphenol trade across the turn into the pre-election year.
Across those 8 midterm-year samples, the trade direction is long and the record is clean: 8 winners, 0 losers, for a Percent Profitable of 100%. Average profit across all years is 11.66%, with a median outcome of 12.01%, which means the typical year has delivered a low double-digit gain over the 202-day stretch rather than relying on one outlier. The annualized return of 11.62% and a Sharpe ratio of 3.08 point to a window that has historically offered both strong returns and relatively consistent payoff for long exposure.
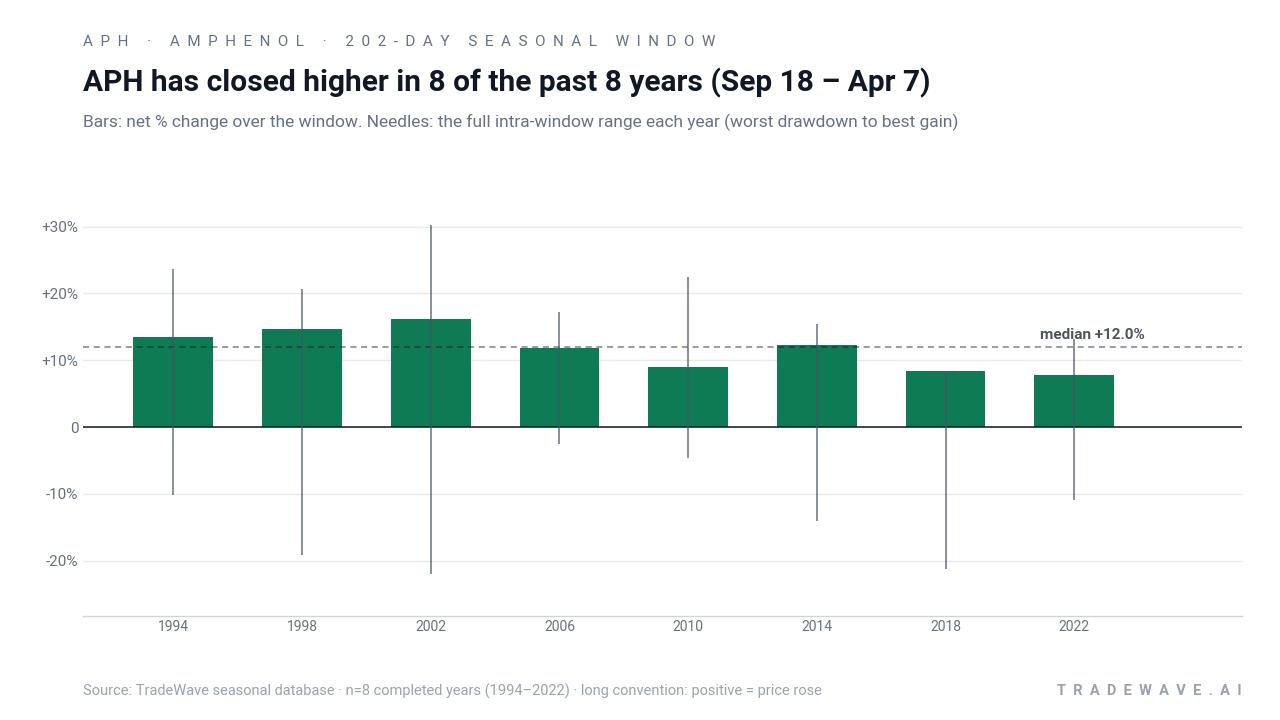
Under the surface, the intraperiod swings have been real. Maximum favorable excursions, or the best point-to-peak moves within each window, have ranged from high single digits to more than 30%, showing that in strong years the stock has often pushed well beyond the final close before consolidating. Maximum adverse excursions, the worst drawdowns from the entry, have reached into the mid-teens and even low 20s in several cycles, reminding traders that even a “perfect” win record has come with sharp pullbacks along the way.
The per-year breakdown shows how that plays out. In 2002, Amphenol logged a net gain of 16.11% in the window, but the stock first endured a drawdown of about 21.95% from the entry before recovering to a maximum favorable move of 30.18%. In 2018, the net gain was a more modest 8.33%, yet the worst intraperiod drop still reached roughly 21.2%, underscoring that this midterm-year window has historically been a grind higher rather than a straight line.
Trend statistics back up that picture of persistent upside with pockets of stress. The “Trend Long” and “Trend Long1” counts are higher than their short counterparts, which means more of the daily path segments inside the window have leaned upward than downward. At the same time, the standard deviation of 3.07% across end-of-window outcomes shows that while results have clustered in a relatively tight band, the path to get there has varied from year to year.
A second view stacks net returns with the full intraperiod range, highlighting how upside and downside have coexisted inside this window.
The cumulative chart of this Amphenol trading window compounds those outcomes into a striking picture: stacking the 202-day midterm-year window across 8 cycles adds up to roughly 140% cumulative gains. Add it up and you get a pattern that has quietly delivered a full doubling-plus of capital for investors who were long only during this specific slice of the calendar.
History does not guarantee future results, and the worst intraperiod drawdowns in this window have been deep enough that even winning years would have tested risk limits.
Why does Amphenol (APH) follow this seasonal pattern?
One likely driver is the way Amphenol’s earnings calendar and capital spending cycles line up with the midterm-to-pre-election transition, when data center and AI infrastructure budgets often get clearer. Analysts have also pointed to institutional portfolio rebalancing and sector rotation into quality growth hardware names as the macro and policy backdrop stabilizes after midterm votes. This pattern may reflect that combination of improving visibility and renewed risk appetite flowing into AI-linked industrial technology stocks across the late midterm and early pre-election months.
What is driving Amphenol (APH) today?
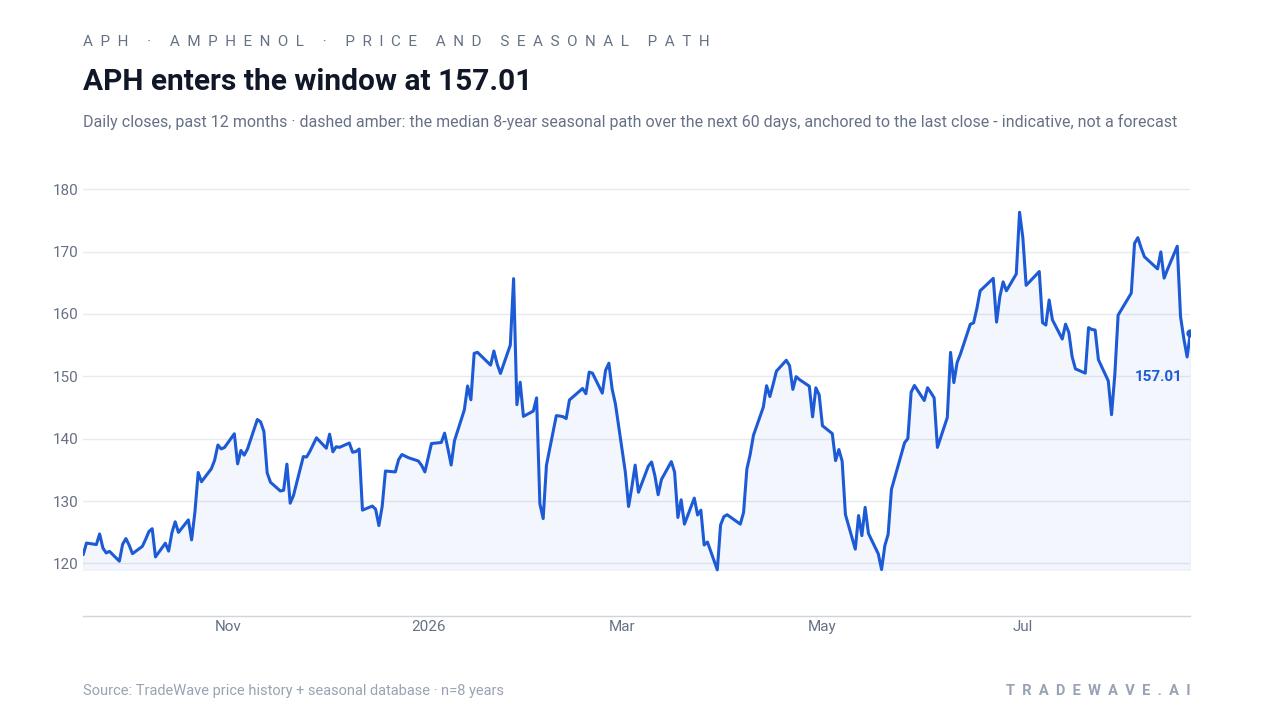
Amphenol closed the latest session at 80.25, down 1.3% on the day, with roughly 11.9 million shares changing hands versus a 20-day average volume of about 6.6 million. The stock sits about 1.2% above its 52-week low of 79.33 and roughly 55.0% below its 52-week high of 178.52, a reset that has left it trading well under its 50-day moving average of 154.39. That backdrop means the upcoming seasonal window is arriving with sentiment already cooled off after a powerful run earlier in the cycle.
Fundamentally, Amphenol remains tied to one of the market’s core themes: AI data center buildout. Bank of America has highlighted the company as a “derivative AI play,” citing expectations for triple-digit AI revenue growth into 2026 and upside from increased connector and cabling content in new Nvidia architectures and potential M&A activity. Sector commentary has framed Amphenol as a key supplier of electrical connectors and copper and fiber cables into data centers, positioning it squarely in the plumbing of AI infrastructure rather than the headline chip names.
Earlier coverage has also flagged Amphenol as a “beat-and-rally” stock, with one screen showing it topping earnings expectations about 91% of the time and historically gaining around 1.9% in the session after results. That kind of post-earnings behavior matters for this seasonal window because the 202-day stretch typically captures at least two reporting cycles, giving multiple chances for earnings surprises to interact with the historical pattern.
The chart below situates the latest pullback against the past year of trading and overlays the median 60-day seasonal path for context.
What should traders watch as this Amphenol seasonal window opens?
First, the calendar: the 202-day window begins on Sep 18 and runs through Apr 7, bridging the end of the midterm election year into the early pre-election year. Historically, that has been a constructive phase for risk assets, and Amphenol’s 8-for-8 record in this slice suggests it has often been a beneficiary of that shift. Traders will be watching whether the stock can stabilize above the recent 52-week low and reclaim the low- to mid-80s as the window opens, which would align more closely with the historical pattern.
Second, earnings and AI spending updates will be key catalysts inside the window. Any confirmation that data center and AI-related orders are tracking toward the triple-digit growth narrative could reinforce the historical seasonal bias, while signs of capex delays or digestion could test it. Price action around those events, especially if it lines up with the typical seasonal inflection points, will offer an early read on whether this cycle is tracking the prior eight.
Finally, volatility inside the window matters as much as the end result. Past cycles have seen intraperiod drawdowns of 15% to 20% even in winning years, so traders may focus on how Amphenol behaves on sharp down days: does dip-buying appear near prior support, or do breaks below the recent low of 79.33 stick? A path that features rallies on strong volume and contained downside would rhyme with the historical pattern, while persistent weakness or failed bounces would signal that this midterm-year iteration is diverging from the script.
Sources
About this seasonal analysis
Seasonal pattern data is sourced from TradeWave.ai, which analyzes historical price behavior across annual calendar windows going back up to 30 years. Read the full data methodology or the book The 100-Year Pattern by Afshin Moshrefi (2026 edition). Past performance of seasonal patterns does not guarantee future results. This article is for informational purposes only and does not constitute investment advice.