IBM Enters Historically Strong Oct-Apr Trading Window
IBM is heading into a historically strong Oct 12–Apr 9 trading window just months after a brutal earnings shock left the stock about 24.0% below its 52-week high, setting up a sharp clash between long-term seasonality and recent volatility.
Price as of Sep 14, 2026: $249.09 (last close).

What is the seasonal pattern for IBM (IBM)?
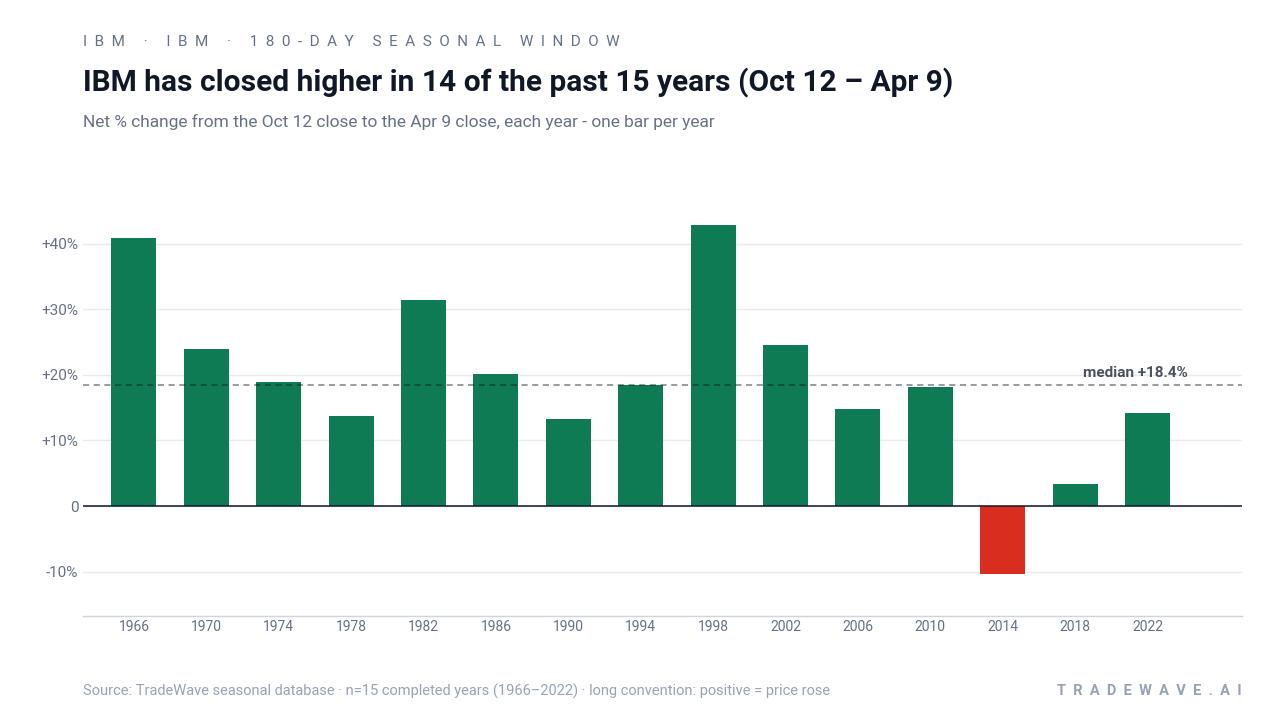
IBM has risen in 14 of 15 years during the Oct 12–Apr 9 midterm-year window, with an average gain of 21.31% in winning years.
- 14-for-15 record in this window, with winners averaging 21.31% gains and only one losing year across the sample.
- The upcoming seasonal window runs from Oct 12, 2026 through Apr 9, 2027 and is grouped across the last 15 midterm election years.
- Percent Profitable stands at 93%, with 14 winners and 1 loser for this long-direction IBM seasonal trend.
- Avg Profit - All, which includes both up and down years, is still a strong 19%, underscoring how powerful this IBM trading window has been.
- Even in this bullish stretch, some years saw double-digit intraperiod drawdowns, so downside swings have been part of the pattern.
- The historical IBM seasonal trend in this midterm-year fall–spring window has compounded to a 1,174% cumulative return across the 15-sample history.
According to historical data from TradeWave.ai, this midterm-year fall–spring stretch has behaved very differently from an average six-month span for IBM, with a clear long-side bias that most investors never see laid out in one place.
How has IBM (IBM) traded in the Oct–Apr midterm-year window?
IBM has closed higher in 14 of the past 15 midterm election years during the Oct 12–Apr 9 window, averaging 21.31% gains in winning seasons. Today the stock finished at 249.09, up 2.4% on the session and sitting about 24.0% below its 52-week high of roughly 327.74, after a turbulent summer that reset expectations.
Because this pattern is grouped by the presidential election cycle, it reflects how IBM has behaved specifically in the year before the presidential election, not just in any random six-month stretch. The market is wrapping up the midterm election year phase and about to transition into the pre-election year, a period that has often coincided with more supportive fiscal and regulatory backdrops for large-cap tech and enterprise software spending.
Across those 15 midterm-year iterations, the long-side IBM seasonal trend has delivered a 1,174% cumulative return when the Oct 12–Apr 9 window is stacked year after year. The median outcome is an 18.4% gain, which is only slightly below the 21.31% average profit in winning years, suggesting the distribution of positive seasons has been fairly tight rather than driven by a single outlier.
The lone losing year in the sample came in 2014, when IBM dropped 10.31% over the window and suffered a worst intraperiod drawdown of 17.97% from the entry point. That stands in contrast to years like 1998, when the stock rallied 42.76% with a best intraperiod run-up of 52.47%, or 2002, when IBM gained 24.58% and at one point was up 41.32% before giving back some of the move.
Looking at more recent cycles, the 2018 window finished with a modest 3.37% gain but still saw IBM trade down as much as 23.83% from the starting level before recovering. In 2022, the stock advanced 14.16% over the window, with a maximum favorable move of 31.87% and only a shallow 1.72% worst drawdown, a cleaner ride that lines up with the broader shift toward enterprise AI and hybrid cloud spending in that period.
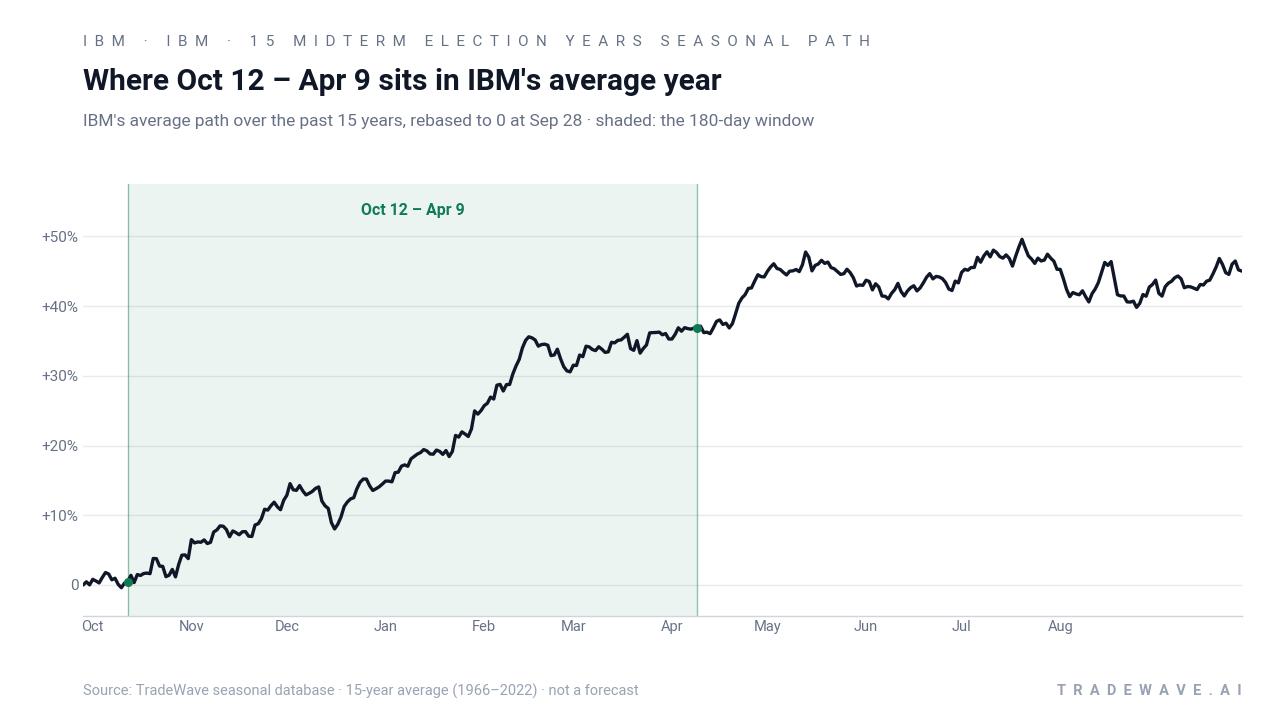
Yearly net and peak moves highlight upside persistence amid typical drawdowns.
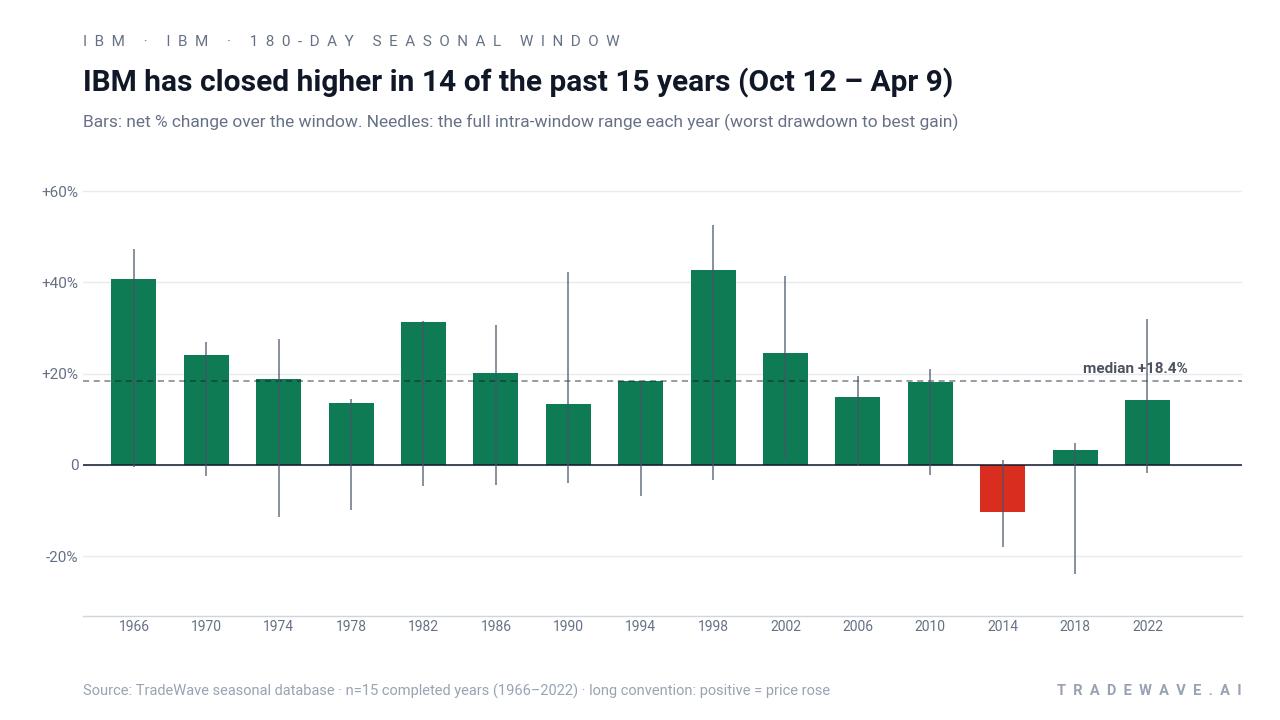
The stacked net, best-case and worst-case excursions underline how this IBM trading window has combined strong upside with real volatility. In many years the maximum favorable move has run well ahead of the final net gain, while the maximum adverse move has often involved mid-teens drawdowns before the stock recovered into the close of the window.
History does not guarantee future results; adverse excursions (MAE) can be large even in winning windows.
Why does IBM (IBM) follow this seasonal pattern?
One likely driver is the way IBM’s earnings calendar and enterprise IT budgets line up with the political cycle. The Oct–Apr stretch captures year-end spending flush, new fiscal-year budgets, and often a friendlier policy tone in the year before a presidential election, when Washington has historically leaned toward growth-supportive messaging. For a company tied to long-cycle corporate and government tech projects, that combination can cluster deal signings and investor optimism into this specific part of the calendar.
What is driving IBM (IBM) today?
IBM closed Tuesday at 249.09, up 2.4% on the day, as the stock continues to stabilize after a historic summer collapse that left it well below its early-June record highs. On Jul 14, 2026, IBM preannounced second-quarter results well below expectations, citing a customer shift of spending toward servers, storage and memory along with supply constraints, and the stock plunged more than 25% in a single session as volume spiked and investors digested the reset in guidance.[2]
In late July 2026, IBM followed that warning by cutting its revenue outlook, reinforcing the message that the near-term growth path would be slower than investors had priced in during the first half of the year.[6] That came only weeks after IBM had notched its highest close on record in early June, driven by enthusiasm around software, hybrid cloud and quantum-related narratives rather than the legacy hardware story that once defined the stock.[5]
The current setup is unusual: IBM is entering its historically strongest seasonal window for midterm election years with sentiment still bruised from a guidance reset and a violent repricing. The July volume spike and intraday collapse marked one of the sharpest single-day moves in the company’s modern history, and analysts have been reassessing how much of the enterprise AI and software growth story should be capitalized into the share price after the shock.[2][6]
The chart below situates the latest move in its recent multi-month context, alongside the median 60-day seasonal path.
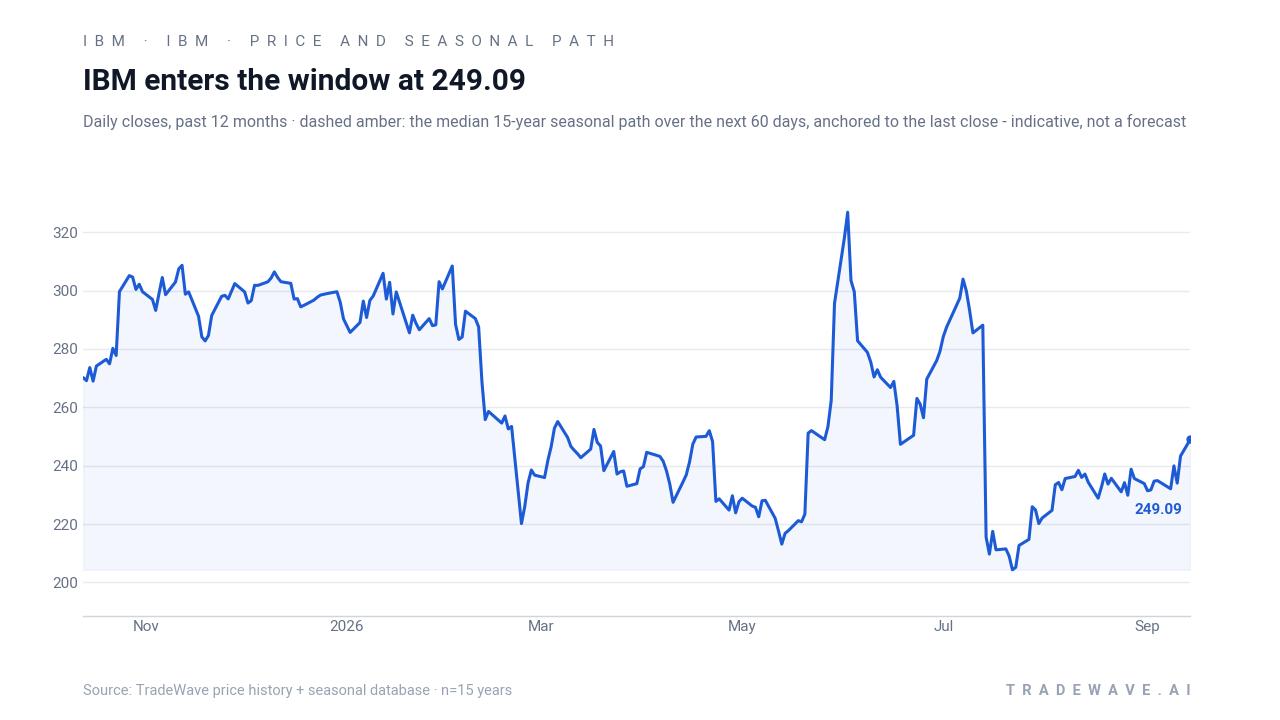
Looking back to 2025, IBM had been riding a very different narrative. In Oct 2025 the company topped third-quarter estimates, raised revenue guidance to more than 5% growth and lifted its free cash flow outlook to $14 billion, while highlighting that its AI book of business had surpassed $9.5 billion, up from $7.5 billion earlier that year.[3] Around the same time, IBM’s partnership with Anthropic to integrate its models into IBM software added fuel to the enterprise AI story and helped drive a strong run in the shares.[4]
By Oct 2025, analysts and investors were debating whether IBM’s AI and software momentum justified the stock’s rally, even as the shares initially slipped after earnings before recovering.[1] The subsequent record close in Jun 2026 showed how far sentiment had swung toward the bullish side before the July warning snapped that optimism and forced a reset.[5][6]
All of this leaves IBM in a classic tension point heading into the Oct 12 seasonal window. The historical IBM seasonal trend in midterm election years has been strongly bullish, but the company is coming off a guidance cut, a major one-day collapse and a more cautious outlook on near-term demand for some of its hardware-linked businesses.[2][6] How the stock behaves inside this window will show whether the long-standing pattern can reassert itself in the face of a very different fundamental backdrop.
What should traders watch in this IBM (IBM) window?
First, the calendar: the Oct 12 start date drops IBM into a six-month stretch that historically lines up with year-end budget flush, early-year IT spending decisions and the transition from the midterm election year into the year before the presidential election. If IBM begins to rebuild momentum into and through its next earnings updates, that would rhyme with the prior 14 winning seasons in this window.
Second, price levels and volatility: traders will be watching whether IBM can hold above the July panic lows and start carving out higher highs and higher lows as the window progresses. A pattern of rallies that quickly get sold and push the stock back toward those summer troughs would look more like the rare 2014-style losing season than the typical midterm-year path.
Third, follow-through on the July volume shock: the July 14 collapse was accompanied by a surge in trading activity as investors rushed to reprice the stock.[2] If volume remains elevated on down days and fades on up days, it would suggest lingering distribution and a tougher road for the seasonal pattern; if the opposite develops, with strong volume on rebounds and quieter pullbacks, it would signal that long-term buyers are leaning into the historical window despite the earnings reset.[2][6]
Finally, the policy and macro backdrop into the year before the presidential election will matter. Any signs that corporate IT budgets, AI-related capex or government tech spending are stabilizing or reaccelerating would fit the historical script for this IBM trading window, while further negative surprises on demand or guidance could be the catalyst that turns this rare midterm-year season into another outlier.
Sources
- CNBC - IBM is trying to rebound after results disappointed initially. What analysts and investors are saying
- Yahoo Finance - IBM stock plummets more than 25% on Q2 earnings warning
- CNBC - IBM tops third-quarter estimates and lifts guidance, but stock drops
- Forbes - What’s Happening With IBM Stock?
- Barron's - IBM Stock Notches Highest Close on Record. This Time It’s Not About Quantum.
- Barron's - IBM Cuts Revenue Outlook Following Historic Stock Drop
- Barron's - IBM Earnings Beat Estimates. The Stock Is Still Falling.
- Barron's - What’s Next for IBM Stock After 25% Collapse
About this seasonal analysis
Seasonal pattern data is sourced from TradeWave.ai, which analyzes historical price behavior across annual calendar windows going back up to 30 years. Read the full data methodology or the book The 100-Year Pattern by Afshin Moshrefi (2026 edition). Past performance of seasonal patterns does not guarantee future results. This article is for informational purposes only and does not constitute investment advice.