McDonald's (MCD) Has Finished Higher in All 10 Midterm Fall Runs, Averaging 9.05% Gains
McDonald's heads toward an October 10 seasonal window that has never been negative in midterm election years, even as consumer pressure and softer U.S. traffic keep the stock below its highs.
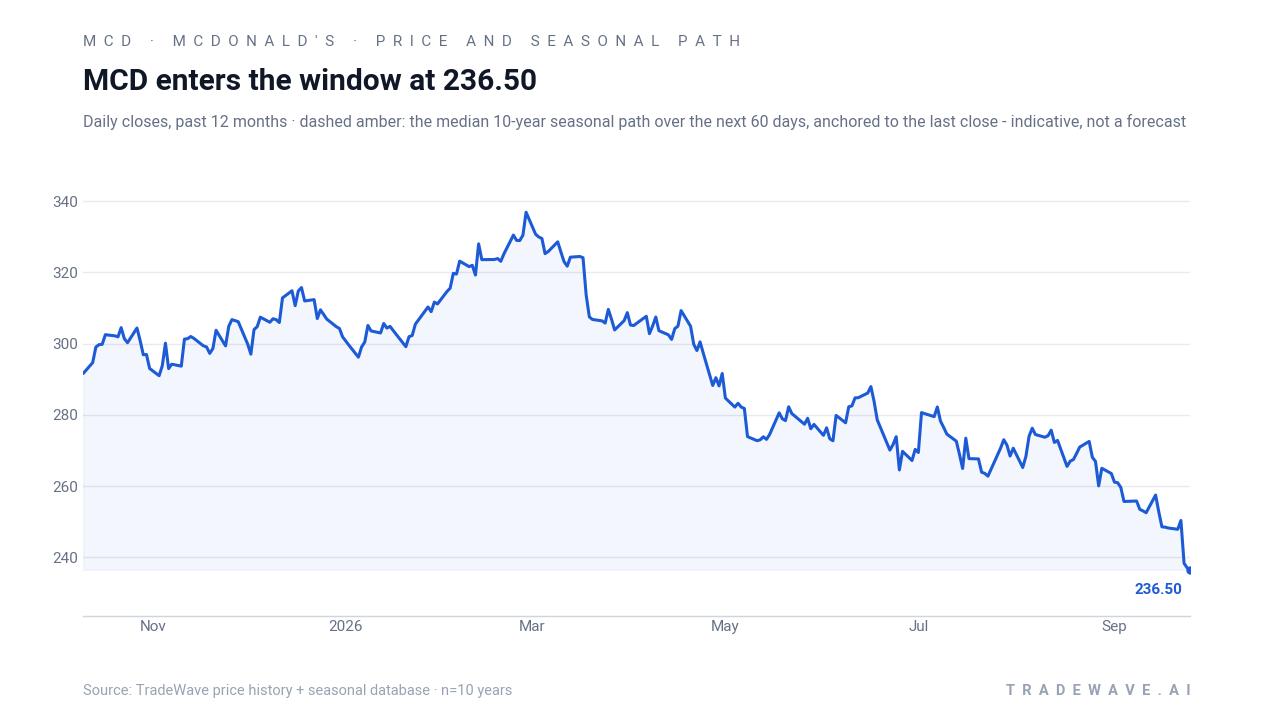
Price as of Sep 25, 2026: $236.50 (last close).

What is the seasonal pattern for McDonald's (MCD)?
McDonald's has risen in 10 of 10 midterm-year Oct 10 to Dec 4 windows, with an average gain of 9.05% in winning years.
- 10 for 10 in this window, with McDonald's gaining an average 9.05% across the last 10 midterm election years.
- Seasonal window runs from Oct 10 through Dec 4, spanning 56 calendar days late in the midterm election year.
- Percent Profitable is 100.0%, with 10 winners and 0 losers in the historical sample.
- Average winner profit of 9.05% stacks to a 136.87% cumulative gain when the window is repeated across all 10 years.
- TradeWave Ratio of 2.54 signals that price has typically traveled meaningfully in the long direction within the window, while a Sharpe ratio of 2.52 points to strong risk-adjusted returns.
- Intraperiod swings have included notable drawdowns in some years, so the path has not been a straight line even in a perfect win record.
According to historical data from TradeWave.ai, this late-year stretch for McDonald's behaves very differently from an average month on the calendar. The next section walks through how that pattern has played out across past midterm election years and what it means as the 2026 window approaches.
How has McDonald's (MCD) traded in past midterm-year fall windows?
McDonald's has finished higher in every single Oct 10 to Dec 4 window across the last 10 midterm election years, averaging a 9.05% gain with no losing seasons. The stock last closed at 236.50, leaving it about 29.1% below its 52-week high of roughly 333.43 and just above its 52-week low of 234.04. That combination of a clean seasonal win streak and a stock sitting near the bottom of its one-year range is what makes this upcoming 56-day window stand out on the calendar.
The pattern is grouped by the presidential election cycle, so the sample covers the last 10 midterm election years rather than 10 consecutive calendar years. Today the market is concluding the current midterm election year and about to transition into the year before the presidential election, a phase that has often seen investors lean back into risk as policy uncertainty clears and fiscal support tends to be more visible.
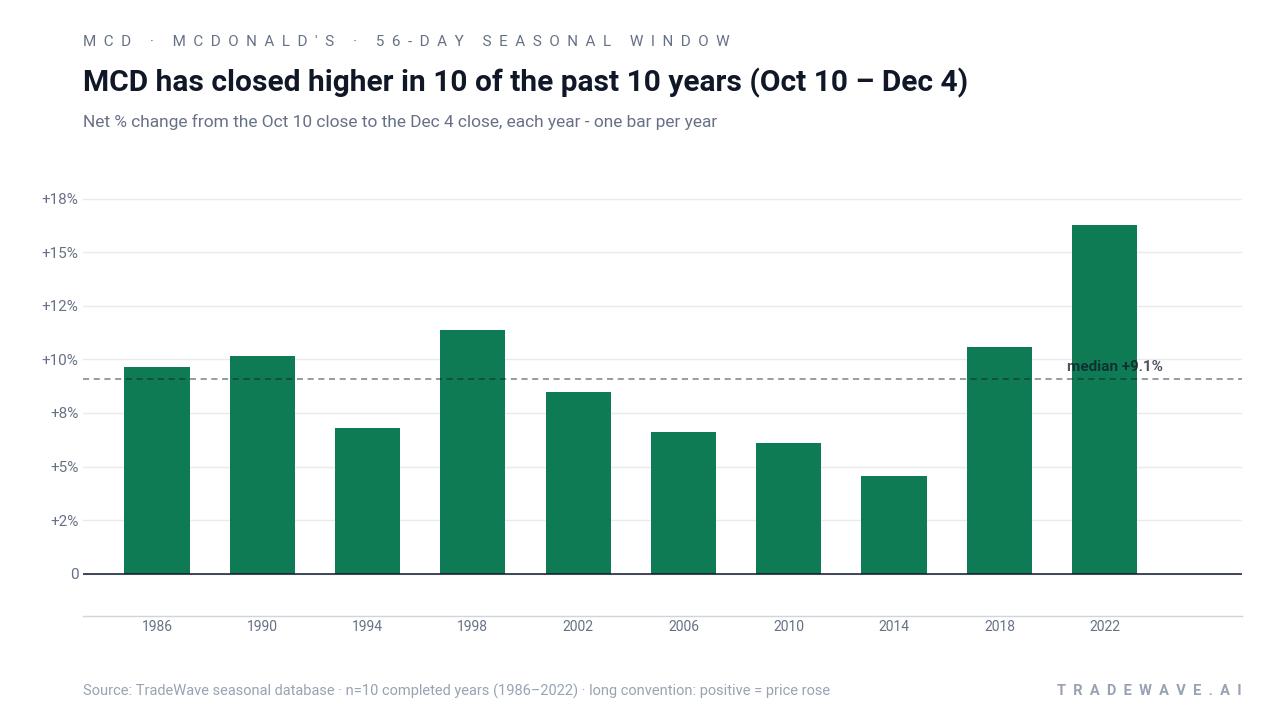
For a long trade direction, every one of the 10 historical windows counts as a favorable outcome. The strongest year in the sample was 2022, when McDonald's gained 16.25% between the Oct 10 entry and the Dec 4 exit, with a best intraperiod run-up of 19.89% and only a shallow 0.43% drawdown from the starting level. At the other end of the range, 2014 still delivered a 4.56% net gain but did so with a 3.21% worst drawdown along the way, a reminder that even winning windows can feel uncomfortable in real time.
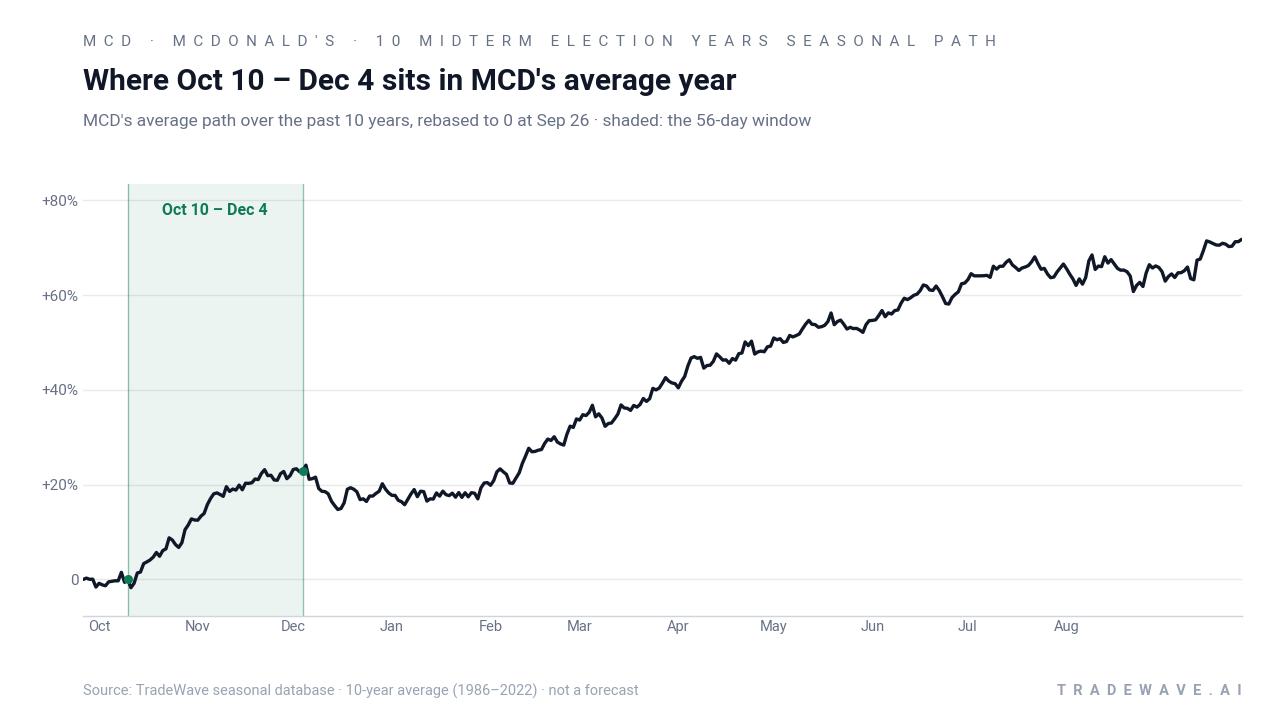
The historical seasonal average shows the stock tending to grind higher through the bulk of the 56 days rather than spiking early and stalling. That fits with the idea of a late-year consumer and portfolio positioning tailwind in midterm election years, as investors digest policy risk and lean into defensive growth names like McDonald's ahead of the year before the presidential election.
A closer look at yearly ranges shows how much room there has been between best-case rallies and worst-case drawdowns inside the window.
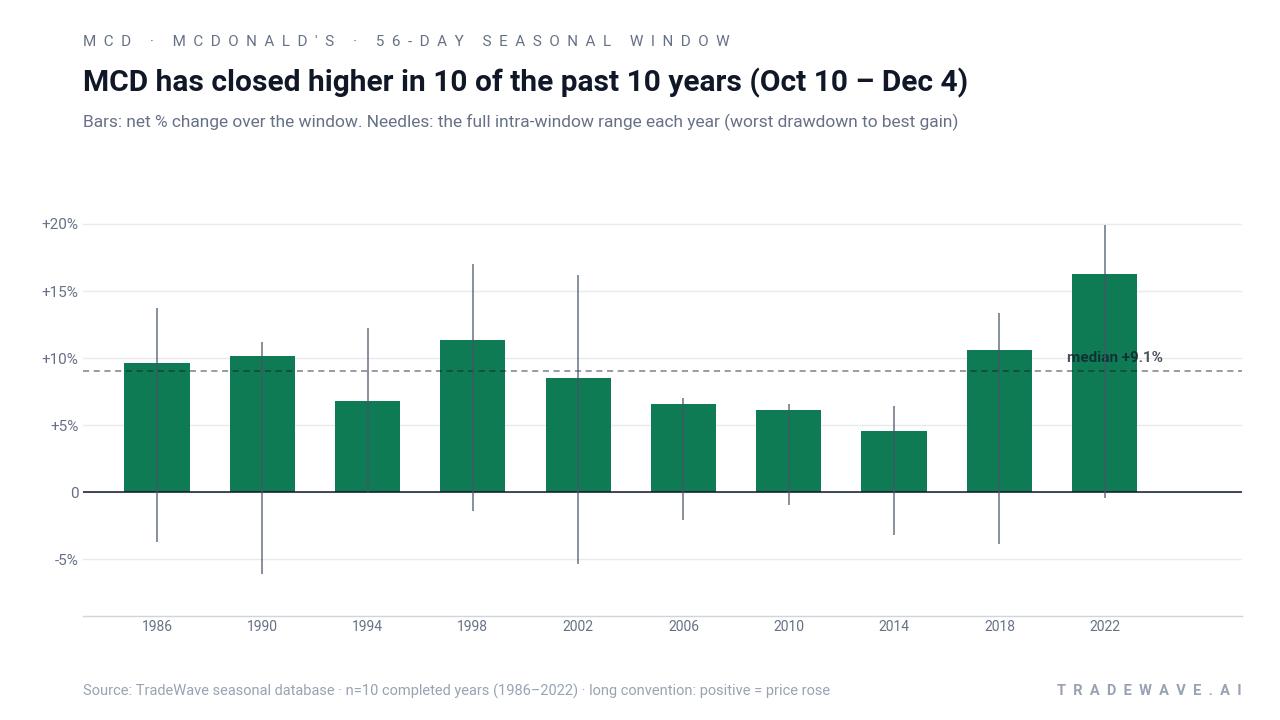
Across the 10-year sample, maximum favorable moves inside the window have often stretched into the low to mid-teens in percentage terms, while maximum adverse moves have typically stayed in the low single digits. That mix of sizable upside excursions and more contained drawdowns is what drives the 2.54 TradeWave Ratio and the 2.52 Sharpe ratio for this pattern, both unusually strong for a 56-day slice of the calendar. Add it up and repeating this specific McDonald's trading window across the last 10 midterm election years would have compounded to a 136.87% cumulative gain.
History does not guarantee future results; adverse excursions can still be large inside the window even when the final outcome has been positive in every past year.
Why does McDonald's (MCD) follow this seasonal pattern?
One likely driver is the way the presidential election cycle shapes both consumer behavior and institutional positioning late in midterm election years. Analysts have pointed to a tendency for investors to rotate into defensive, cash-generative names like McDonald's as policy risk peaks and then fades, while holiday-season traffic and value-focused promotions can support fundamentals into early December. This pattern may also reflect portfolio rebalancing and window-dressing flows as managers lock in exposure to stable large-cap consumer stocks ahead of the stronger year-before-the-election phase.
What is driving McDonald's (MCD) today?
McDonald's shares last changed hands at 236.50, down 0.22% on the day, leaving the stock roughly 29.1% below its 52-week high and only about 1.1% above its 52-week low as investors weigh slowing U.S. sales growth against solid global profits. In early August, the company reported second-quarter adjusted earnings of $3.38 per share, ahead of FactSet estimates, on revenue of $7.1 billion that came in just shy of expectations, with U.S. same-store sales up 0.8% as higher costs and softer lower-income demand took a toll.[3] On the same day, Reuters reported that value deals had not drawn enough diners to offset pressure from higher fuel and grocery prices, underscoring how macro headwinds are intersecting with the fast-food giant's value-driven strategy.[4]
Those cross-currents sit on top of a year that has already featured a strong fourth-quarter 2025 beat and a push into new menu and beverage initiatives, including the Big Arch burger and expanded value offerings, which earlier coverage framed as key levers to support traffic in a tougher consumer backdrop.[1][6] The result is a stock that has delivered resilient earnings but faces a more cautious U.S. consumer, just as the calendar approaches a historically strong McDonald's trading window in the final stretch of the midterm election year.
The chart below shows how that tension between earnings strength, consumer pressure and the upcoming seasonal window has played out in price over the past year, alongside a median seasonal projection.
In August, both AP News and CNBC highlighted that McDonald's still posted strong second-quarter profits and named a new chief of U.S. operations, even as management acknowledged that higher energy and grocery prices were squeezing lower-income customers.[3][7] Reuters separately noted that value deals had not fully offset that pressure, a reminder that even a global brand with a powerful value proposition is not immune to macro shocks.[4] For traders watching the upcoming Oct 10 to Dec 4 seasonal window, the key question is whether those headwinds ease enough to let the historical pattern reassert itself or whether this midterm election year finally breaks the streak.
Sources
- CNBC - Wall Street sees more upside for McDonald’s after strong earnings beat - CNBC
- CNBC - McDonald's is about to report earnings. Here's what to expect - CNBC
- AP News - McDonald’s posts strong second quarter profit, names new chief of US operations - AP News
- Reuters - McDonald's US sales growth slows as value deals fail to draw enough diners - Reuters
- CNBC - McDonald's is about to report earnings. Here's what to expect - CNBC
- Yahoo Finance - McDonald's to report Q1 earnings as value push, viral burger launch may offset consumer softness - Yahoo Finance
- CNBC - Stocks making the biggest moves premarket: McDonald's, Caterpillar, Palantir, Merck & more - CNBC
About this seasonal analysis
Seasonal pattern data is sourced from TradeWave.ai, which analyzes historical price behavior across annual calendar windows going back up to 30 years. Read the full data methodology or the book The 100-Year Pattern by Afshin Moshrefi (2026 edition). Past performance of seasonal patterns does not guarantee future results. This article is for informational purposes only and does not constitute investment advice.