Bank of America (BAC) Has Rallied in 11 of 12 Late-October Midterm Windows Into Election Turn
Bank of America is trading just below its 52-week high as it heads toward a late-October seasonal window that has quietly delivered gains in most midterm election years.
Price as of Sep 23, 2026: $56.00 (last close).
What is the seasonal pattern for Bank of America (BAC)?
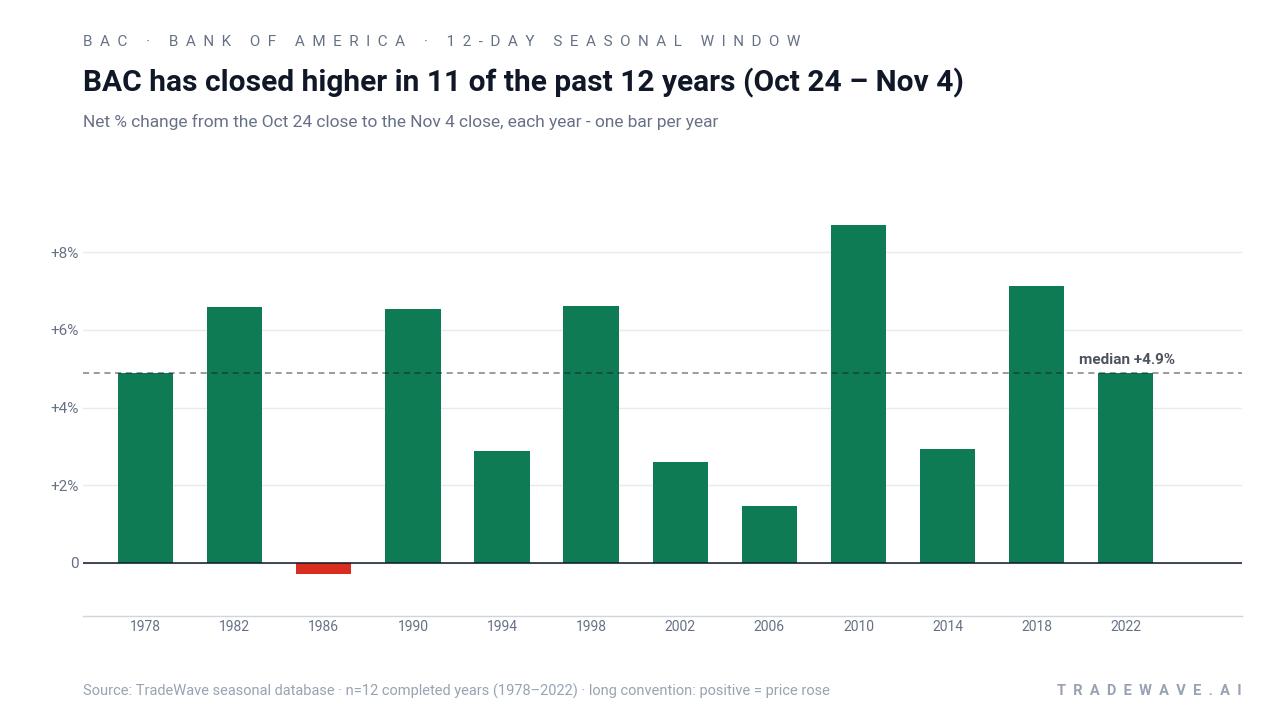
Bank of America has risen in 11 of 12 midterm-year late-October windows, with an average gain of 5.02% in winning years.
- 11-for-12 record in this Oct 24–Nov 4 window, with winning years averaging 5.02% gains.
- Percent Profitable of 91.67%, with 11 winners and just 1 loser across the last 12 midterm election years.
- Including the lone down year, Avg Profit - All still comes in at 4.58%, showing the BAC seasonal trend has been consistently positive.
- The worst year in the sample lost only 0.28%, while the strongest late-October runs topped 8% over just 12 days.
- TradeWave Ratio of 2.13 and a Sharpe ratio of 1.67 point to a historically favorable long setup in this Bank of America trading window.
- The upcoming window begins Oct 24 and lasts 12 calendar days, aligning with the final stretch of the midterm election year before the pre-election year kicks in.
According to historical data from TradeWave.ai, this specific late-October stretch has behaved very differently from an average month for Bank of America. The next section walks through how that pattern has played out across past midterm election years without making any prediction about what comes next.
How has Bank of America (BAC) traded in the late-October midterm window?
Bank of America has closed higher in 11 of the past 12 midterm-year windows running from Oct 24 to Nov 4, averaging 5.02% gains in the winning years. Today the stock finished at 56.00, leaving it about 4.9% below its 52-week high of 65.23 and roughly 22.7% above its 52-week low of 45.64. That combination of a strong historical seasonality slice and a price sitting near the upper end of its one-year range gives this upcoming window more weight than a typical calendar quirk.
The pattern is grouped by the presidential election cycle, so the 12-year sample covers the last 12 midterm election years rather than consecutive calendar years. That matters because midterm years often feature a distinct policy and volatility profile, followed by a historically stronger pre-election year for risk assets. This late-October slice sits right at that handoff, which is when Bank of America’s historical seasonality has tended to tilt bullish.
Across those 12 midterm-year windows, the long trade direction has been clearly defined. Bank of America finished higher in 11 years and lower in just one, giving a Percent Profitable of 91.67% with 11 winners and 1 loser. The average gain in winning years is 5.02%, while the single losing year in 1986 saw only a 0.28% decline, which keeps the Avg Profit - All at a still-robust 4.58%.
The strongest late-October runs came in 2010 and 1998, when the stock gained 8.69% and 6.62% respectively over the 12-day window. At the other end of the spectrum, the weakest positive years such as 2006 and 1994 still delivered 1.46% and 2.87% gains. Add it up and the cumulative return from stacking this window across the 12 midterm years reaches 70.5%, which is unusually high for such a short slice of the calendar.
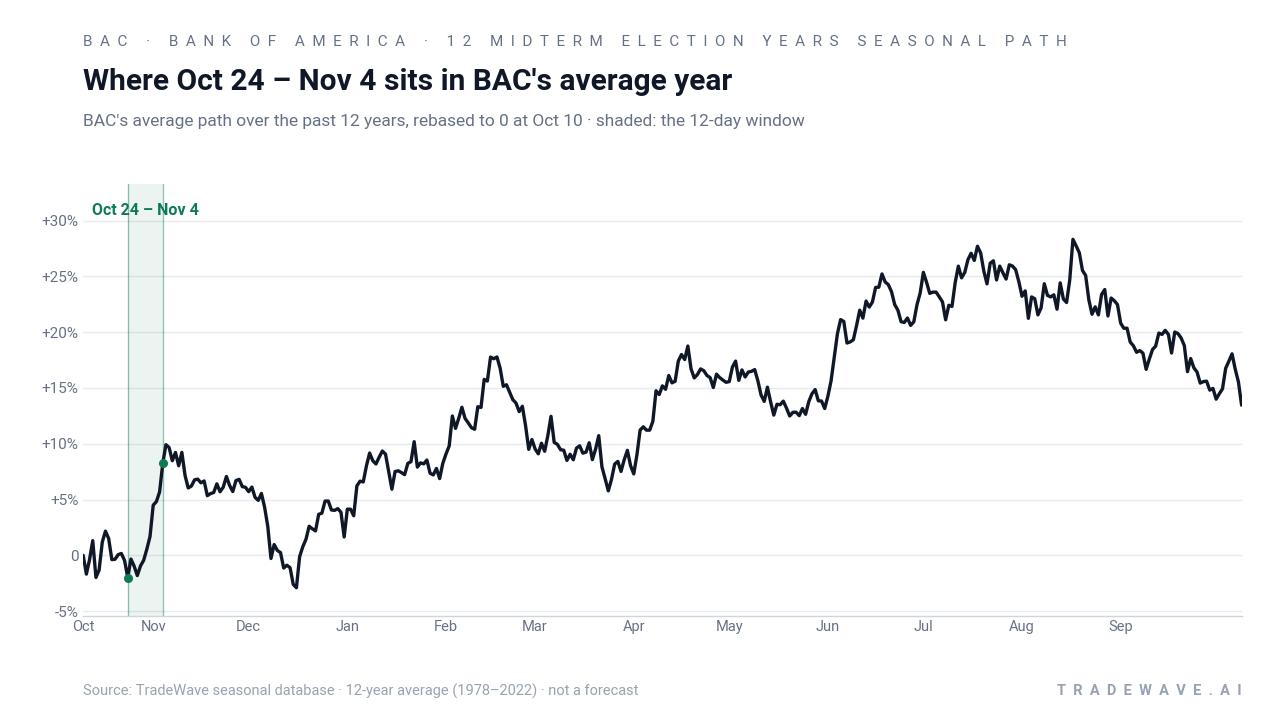
The historical seasonal average path suggests that much of the move tends to occur inside the window itself rather than before it. In many years, the stock has drifted or chopped into late October, then pushed higher during the 12-day stretch, which fits a pattern of investors repositioning into the pre-election year. The TradeWave Ratio of 2.13 indicates that, on average, price has traveled meaningfully in the long direction within the window, not just at the close.
Yearly net and intraperiod swings show how upside and downside have both appeared inside this short window.
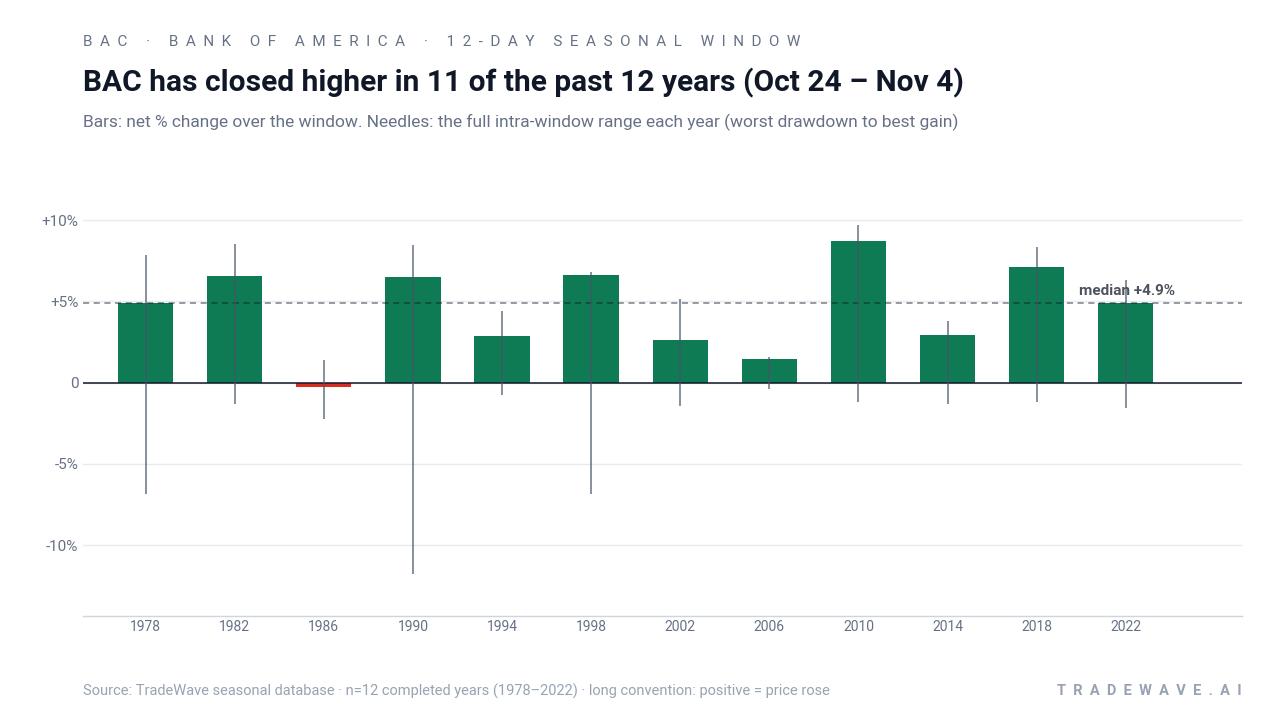
Intraperiod behavior has not been one-way traffic. In the standout 1990 window, for example, Bank of America finished up 6.53% but first saw a worst drawdown of 11.76% before recovering, while the best run-up reached 8.49%. In 1998, the stock gained 6.62% with both the maximum favorable move and maximum adverse move hitting 6.84%, underscoring how sharp swings can coexist with a positive close. Even in milder years like 2014 and 2018, the worst drawdowns of around 1% to 1.5% were part of the ride.
History does not guarantee future results; adverse excursions can be large even in winning windows, and a strong seasonal bias does not remove stock-specific or macro risk.
Why does Bank of America (BAC) follow this seasonal pattern?
One likely driver is the way the presidential election cycle shapes policy expectations and risk appetite around late October of midterm years. Analysts often point to institutional portfolio repositioning into the historically stronger pre-election year, which can favor large financials as investors lean back into cyclicals. For a bank like Bank of America, that timing also lines up with year-end capital planning, regulatory clarity and expectations for the following year’s interest-rate and dealmaking backdrop, all of which can cluster flows into this short window.
What is driving Bank of America (BAC) today?
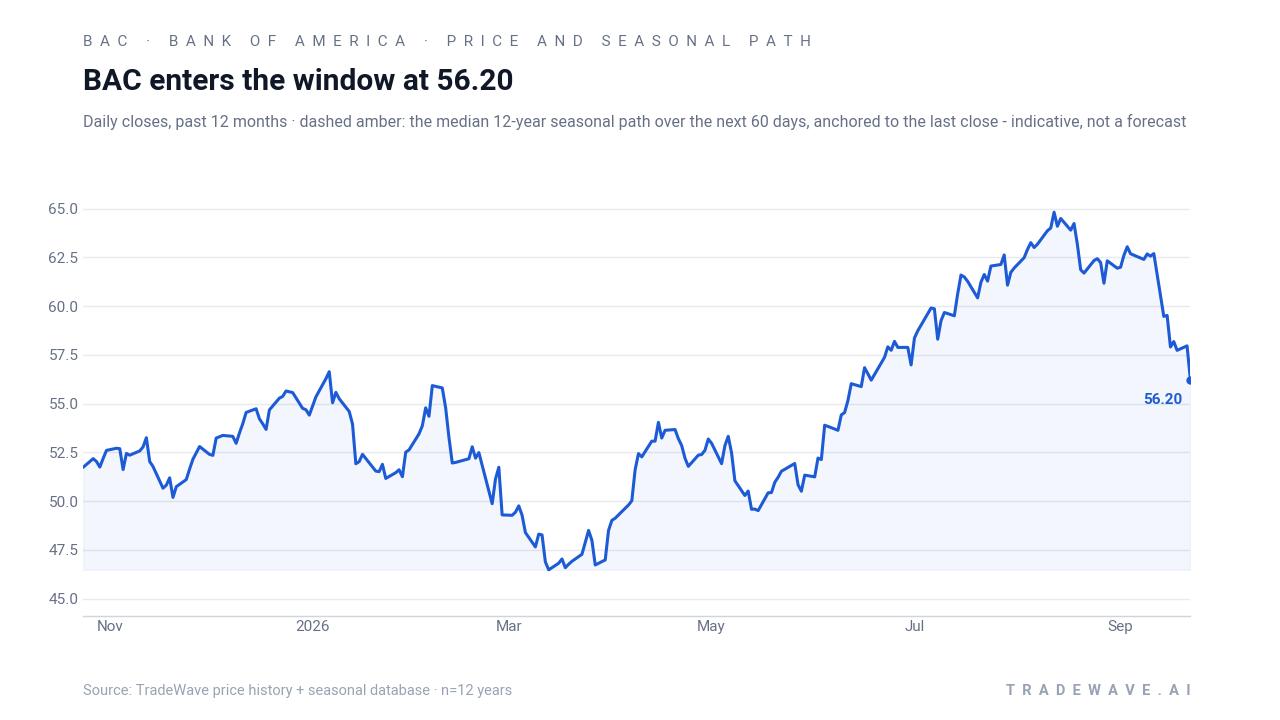
Bank of America closed Thursday at 56.00, down 0.36% on the day, with roughly 35.97 million shares changing hands versus a 20-day average volume of about 36.52 million. The stock sits about 4.9% below its 52-week high of 65.23 and roughly 22.7% above its 52-week low of 45.64, leaving it near the upper third of its one-year range as investors weigh the rate path and trading conditions.
In April 2026, the bank reported that trading and investment banking helped lift profit in the first quarter, with net income rising to $8.6 billion, or $1.11 per share, from $7.4 billion, or $0.89, a year earlier.[2] Management highlighted $1.8 billion in investment banking fees, underscoring how dealmaking and markets activity have become key earnings levers alongside net interest income.[2] Earlier, in October 2025, Bank of America raised the lower end of its net interest income forecast and beat profit estimates, again citing strong investment banking results and the benefit of higher rates on its loan book.[3]
Those earnings beats came against a macro backdrop where higher Federal Reserve policy rates supported net interest income but also introduced more volatility into fixed income and equity markets.[3] For a large lender and trading house like Bank of America, that mix has meant fatter spreads on loans and deposits, but also more sensitivity to swings in client activity and risk appetite. The bank’s recent commentary has pointed to healthy client engagement, even as management has flagged the possibility that sales and trading revenue could flatten if volatility cools.
On the regulatory front, the firm has also been in the headlines for governance-related issues. On Aug 21, 2026, the Financial Times reported that the SEC accused an ex-Bank of America utilities banker of insider trading, an enforcement case that, while focused on an individual, keeps attention on compliance and conduct risk at large institutions.[4] For equity investors, such stories rarely move the stock on their own, but they can influence how regulators and boards think about oversight and controls.
The chart below situates the latest move in its recent multi-month context and overlays the median seasonal path for the next 60 days.
What should traders watch in the upcoming BAC seasonal window?
The key test for this late-October pattern will be how Bank of America behaves as the Oct 24 window opens while the market wraps up the midterm election year and looks ahead to the pre-election year. Historically, the stock has tended to grind or chop into the window, then post most of its gains during the 12-day stretch, so traders will be watching whether price can hold above the mid-50s and push toward the 60 area in line with prior midterm cycles.
Macro catalysts will matter. The next earnings report, currently estimated for Jan 14, 2027, sits just beyond the window, but guidance chatter around net interest income, loan growth and trading conditions could surface in conferences or regulatory filings before then.[1] Any shift in expectations for Federal Reserve policy or credit quality could either reinforce or blunt the historical seasonality, especially given how much of Bank of America’s earnings power is tied to rates and dealmaking.[2][3]
On the risk side, traders should monitor intraperiod swings as closely as closing levels. Past windows have seen maximum adverse moves of several percentage points even in years that finished solidly higher, so a sharp dip early in the window would not automatically contradict the pattern. What would challenge the historical BAC seasonal trend is a sustained break lower that fails to recover by early November, particularly if accompanied by softer commentary on trading or investment banking activity.
Finally, governance and regulatory headlines, including any follow-through from the insider trading case involving a former banker, remain a background watch item rather than a primary trading driver.[4] If such stories were to escalate into broader scrutiny, they could add an idiosyncratic layer of risk on top of the usual macro and seasonal forces. For now, the main focus into late October is whether Bank of America’s strong midterm-year late-October record can hold as the stock trades near the top of its 52-week range.
Sources
- CNBC - Check out Bank of America Corp's stock price (BAC) in real time - CNBC
- Reuters - Bank of America profit rises as trading, investment banking shine | Reuters
- Reuters - Bank of America raises NII forecast, beats profit estimates on dealmaking strength
- Financial Times - SEC accuses ex-Bank of America utilities banker of insider trading
About this seasonal analysis
Seasonal pattern data is sourced from TradeWave.ai, which analyzes historical price behavior across annual calendar windows going back up to 30 years. Read the full data methodology or the book The 100-Year Pattern by Afshin Moshrefi (2026 edition). Past performance of seasonal patterns does not guarantee future results. This article is for informational purposes only and does not constitute investment advice.