Realty Income (O) Has Risen in 7 of 7 Midterm Oct 10-24 Windows, Averaging 4.19% Gains
Realty Income is heading into an October 10–24 stretch that has never been down in the last seven midterm election years, just as the REIT trades below recent highs and investors weigh guidance and credit strength.
Price as of Sep 28, 2026: $55.35 (last close).

What is the seasonal pattern for Realty Income (O)?
Realty Income has risen in 7 of 7 midterm-year October 10–24 windows, with an average gain of 4.19% in winning years.
- 7 for 7 in this window, averaging 4.19% gains across the last seven midterm election years.
- Seasonal bias is bullish for longs from Oct 10 through Oct 24, based on a long trade direction.
- Percent Profitable is 100.0%, with 7 winners and 0 losers across the historical sample.
- Average profit of 4.19% over the 15-day window comes with relatively low dispersion, with standard deviation of 0.93%.
- The TradeWave Ratio of 4.16 signals meaningful travel in the trade direction within the window, while the Sharpe ratio of 4.35 points to strong risk-adjusted returns.
- Intraperiod drawdowns have occurred in every year, so even a historically strong window has required sitting through some downside before the gains locked in.
According to historical data from TradeWave.ai, this mid-October stretch for Realty Income behaves differently from an average month on the calendar. The next section walks through how that pattern has lined up with the presidential election cycle and what it has meant for past investors.
How has Realty Income (O) traded in the midterm October 10–24 window?
Realty Income has closed higher in every single October 10–24 window across the last seven midterm election years, averaging a 4.19% gain for long positions. Shares finished Monday at 55.35, down 0.3% on the day and sitting below their 52-week high of about 66.01, with the upcoming window set to open in less than two weeks.
This seasonal pattern is grouped by the presidential election cycle, focusing on the last seven midterm election years rather than consecutive calendar years. That matters because REITs like Realty Income often feel policy and rate shifts most acutely in mid-cycle periods, when fiscal priorities and central bank paths are clearer but not yet reset by a new administration.
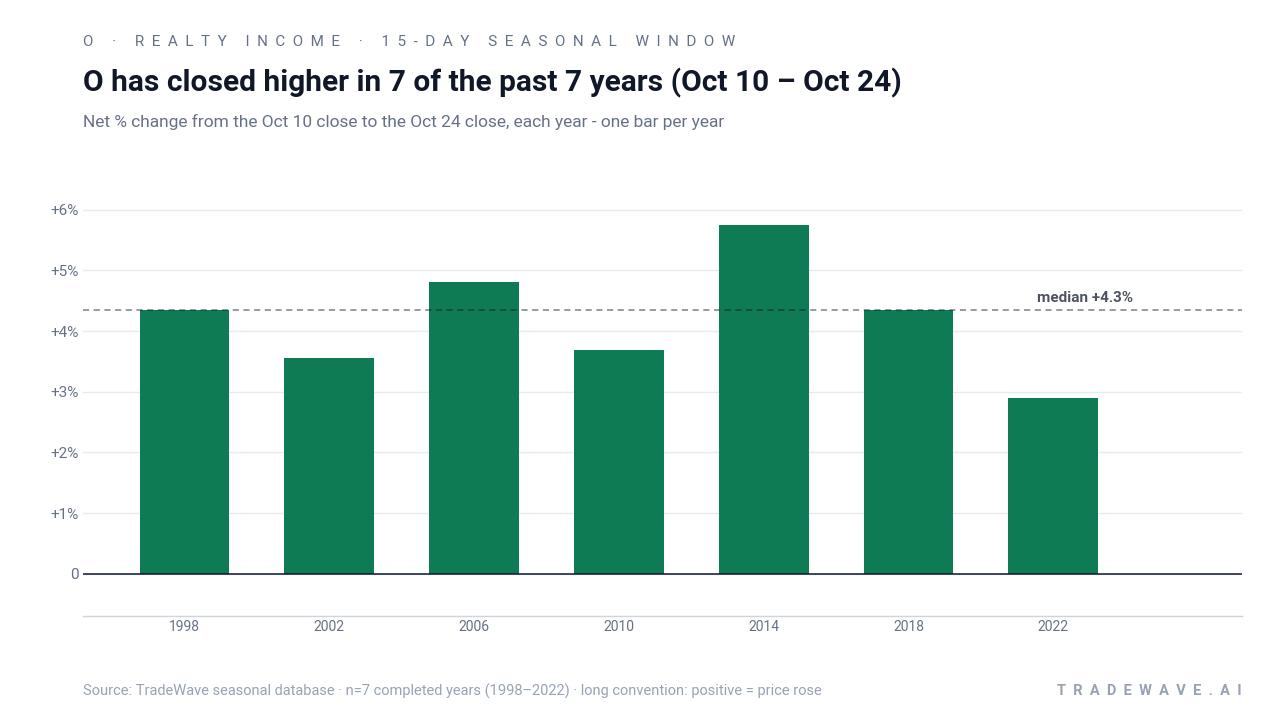
Across the seven completed midterm-year samples from 1998 through 2022, every October 10–24 window finished positive for a long trade. The strongest year in this O seasonal trend was 2014, when the stock gained 5.74% over the 15 days, while the softest was 2022 with a still-positive 2.89% move. Average profit of 4.19% lines up closely with the median outcome of 4.34%, which suggests a tight cluster of results rather than a pattern driven by one outlier year.
For a long setup, the key question is how much upside has typically been available and how much downside investors have had to sit through. The maximum favorable move inside the window has ranged from 3.1% to 6.76% across years, while the worst intraperiod drawdowns have run between about 0.4% and 3.23% from the entry. In plain English, the historical record shows that Realty Income has usually offered a few percentage points of upside in this stretch, but it has not delivered that path in a straight line.
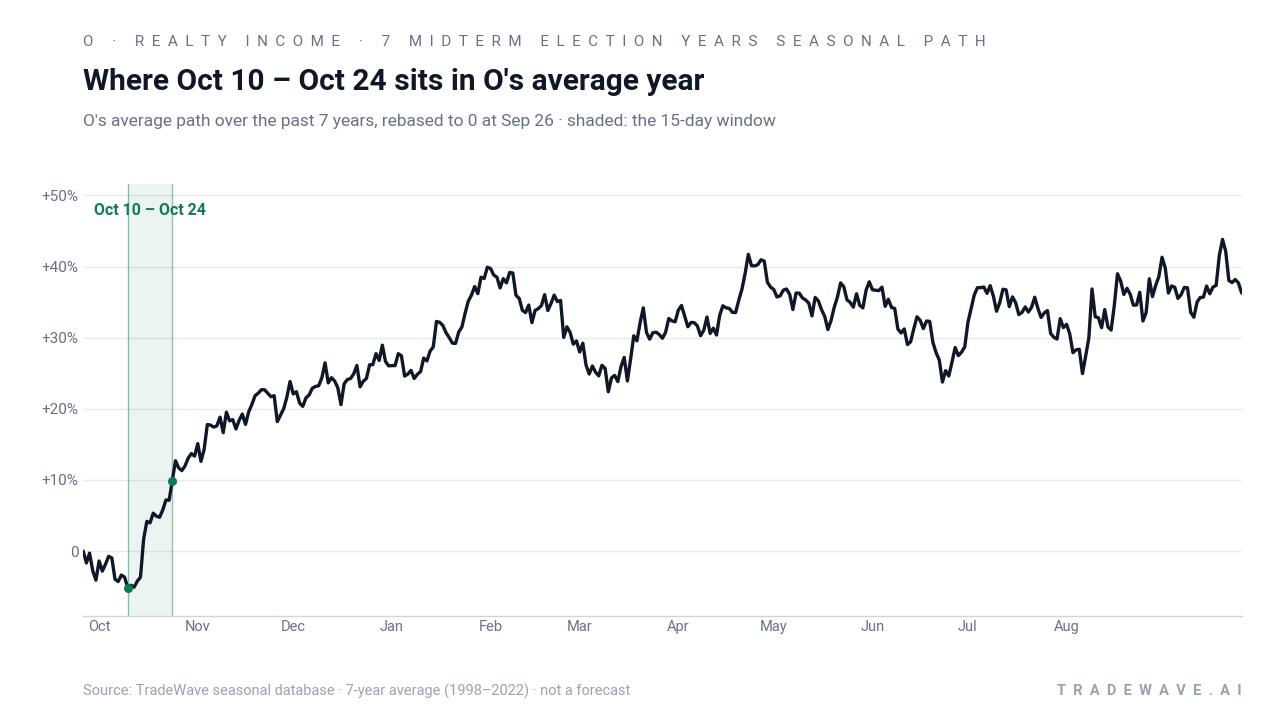
The historical seasonal average shows the October 10–24 window acting as a late-year bump in midterm election years, with gains tending to accrue steadily rather than in a single spike. That fits the profile of a defensive REIT that often benefits when investors rotate toward yield and stability as the year winds down and the policy calendar shifts toward the pre-election year.
Year-by-year ranges show how much Realty Income has swung inside the window before settling at those positive closes.
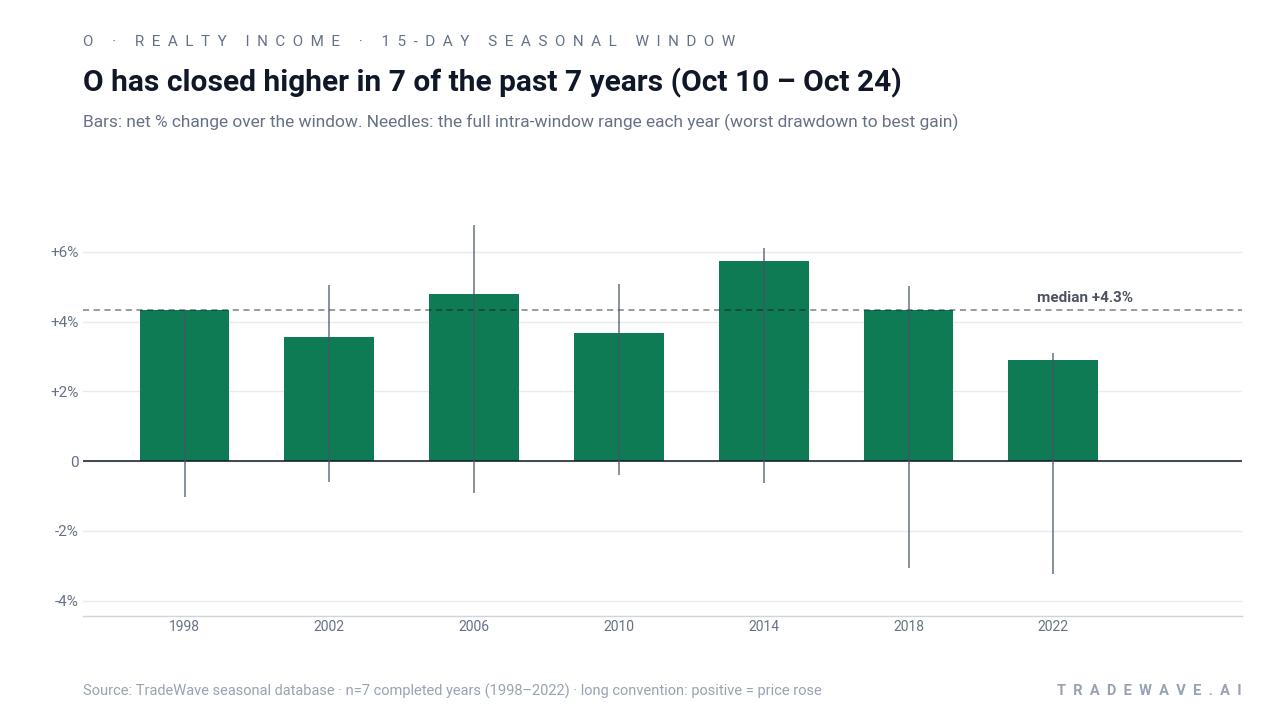
The combined net / maximum favorable / maximum adverse chart shows a consistent pattern: every bar ends above zero, but the needles extend both higher and lower, capturing the full swing from worst drawdown to best gain each year. In 2018 and 2022, for example, Realty Income still finished the window higher, yet the stock saw intraperiod drawdowns of roughly 3% before recovering, a reminder that even a strong seasonal edge has required some risk tolerance.
Add it up: seven for seven, mid-single-digit average gains, and a track record of upside that has outweighed the typical 1% to 3% pullbacks inside the window. History does not guarantee a repeat, but the consistency across these midterm election years is hard to ignore.
History does not guarantee future results, and intraperiod drawdowns can still be meaningful even in windows where every historical sample finished higher.
Why does Realty Income (O) follow this seasonal pattern?
One likely driver is the way REITs sit at the intersection of interest-rate expectations and year-end portfolio positioning. Analysts have pointed to midterm autumns as periods when rate paths are clearer, credit spreads often stabilize, and income-focused investors rebalance toward higher-quality yield, which can favor names like Realty Income. This pattern may also reflect sector rotation into defensive, cash-flow-heavy assets as the market transitions from the midterm election year into the historically stronger pre-election year.
What is driving Realty Income (O) today?
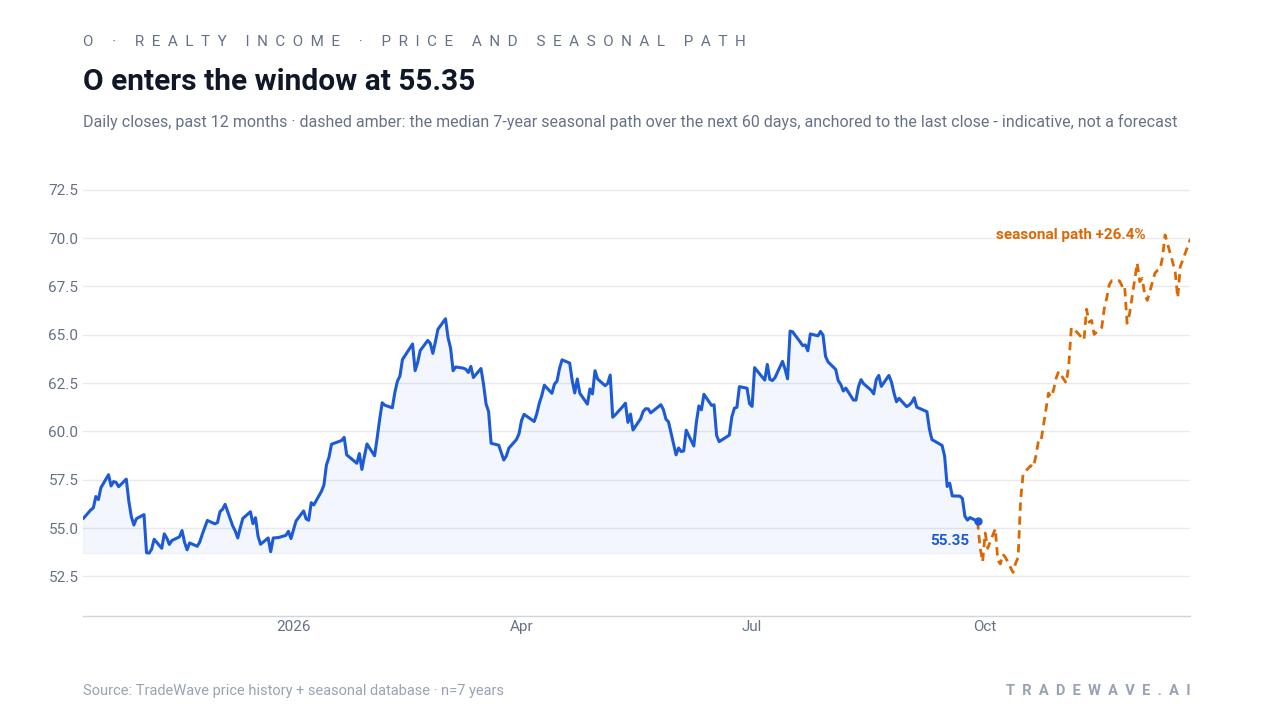
Realty Income closed Monday at 55.35, down 0.34% on the session, leaving the stock about 16.1% below its 52-week high near 66.01 and modestly above its 52-week low around 51.23. The shares have also slipped roughly 9.9% over the past month, trading below their 50-day moving average of about 61.04 on volume that has recently run near a 20-day average of 8.2 million shares.
The fundamental backdrop has been shaped by August guidance and a supportive credit story. On Aug 5, 2026, Realty Income reaffirmed its status as a steady cash-flow REIT, updating 2026 guidance to net income per share of $1.59 to $1.60 and adjusted funds from operations of $4.44 to $4.45, alongside same-store rent growth of 1.1% to 1.3% and occupancy around 98.5%.[1] Management framed those numbers as consistent with a diversified portfolio of single-tenant net lease properties, with tenants concentrated in categories like dollar stores, quick-service restaurants, drug stores and grocery chains that tend to be resilient across cycles.[1]
Credit quality has been another anchor. On Aug 3, 2026, Fitch assigned Realty Income a Long-Term Issuer Default Rating of “A” with a Stable Outlook, citing durable cash flow and portfolio diversification.[1] That rating helps keep the company’s cost of capital competitive, which matters as it continues to fund acquisitions and joint ventures in a higher-rate world.
Strategic moves earlier in the year also speak to how Realty Income is positioning into this phase of the cycle. In March 2026, the company and Apollo announced a $1.0 billion partnership in which Apollo-managed funds will acquire a 49% interest in a joint venture expected to own roughly 500 single-tenant retail properties, with Realty Income managing the portfolio and retaining a call option to redeem Apollo’s stake after year seven through year fifteen.[2] That structure gives the REIT fee income and growth exposure while sharing capital commitments with a large institutional partner.
The chart below situates the latest pullback against the past year of trading and the typical seasonal path into late October.
What should traders watch as the October window approaches?
First, the calendar: the 15-day window opens on Oct 10, right as markets transition from the concluding midterm election year into the pre-election year, a phase that has often been friendlier to risk assets. For Realty Income, behavior inside that window will be telling. A move that tracks the historical pattern, with steady gains and contained drawdowns, would reinforce the idea that income-focused investors are leaning back into high-quality REITs as policy uncertainty fades.
Second, watch the price levels. The 52-week low near 51.23 and the 50-day moving average around 61.04 bracket a wide range that has defined trading in recent months. If the stock holds above the low and begins to reclaim the 60s during or shortly after the window, it would echo prior midterm-year patterns where the October 10–24 stretch marked a pivot from weakness to stabilization.
Third, keep an eye on macro and credit headlines. Any shift in rate expectations that threatens Realty Income’s “A” rating or raises questions about its cost of capital could blunt the historical seasonal tailwind.[1] Conversely, confirmation that occupancy and same-store rent growth are tracking guidance would support the idea that the REIT’s defensive tenant mix is doing its job into year-end.[1]
Finally, sector flows matter. Realty Income sits at the center of the retail single-tenant net lease space, where long-term net leases and necessity-based tenants can draw capital when investors rotate toward stability.[2] If REIT ETFs and income funds show renewed interest in this corner of the market as the window opens, that would align with the seven-for-seven historical record. A lack of follow-through, or a break below the recent lows during the window, would be an early sign that this midterm-year pattern is starting to fray.
Sources
About this seasonal analysis
Seasonal pattern data is sourced from TradeWave.ai, which analyzes historical price behavior across annual calendar windows going back up to 30 years. Read the full data methodology or the book The 100-Year Pattern by Afshin Moshrefi (2026 edition). Past performance of seasonal patterns does not guarantee future results. This article is for informational purposes only and does not constitute investment advice.