Shopify (SHOP) Has Finished Higher in 8 Straight Oct-Dec Runs, Averaging 19.1% Gains
Shopify shares jumped to $147.74 on Wednesday as the stock heads toward an October–December window that has delivered gains in every year since 2018, putting extra focus on this year’s holiday-season trade.
Price as of Sep 22, 2026: $147.74 (last close).

What is the seasonal pattern for Shopify (SHOP)?
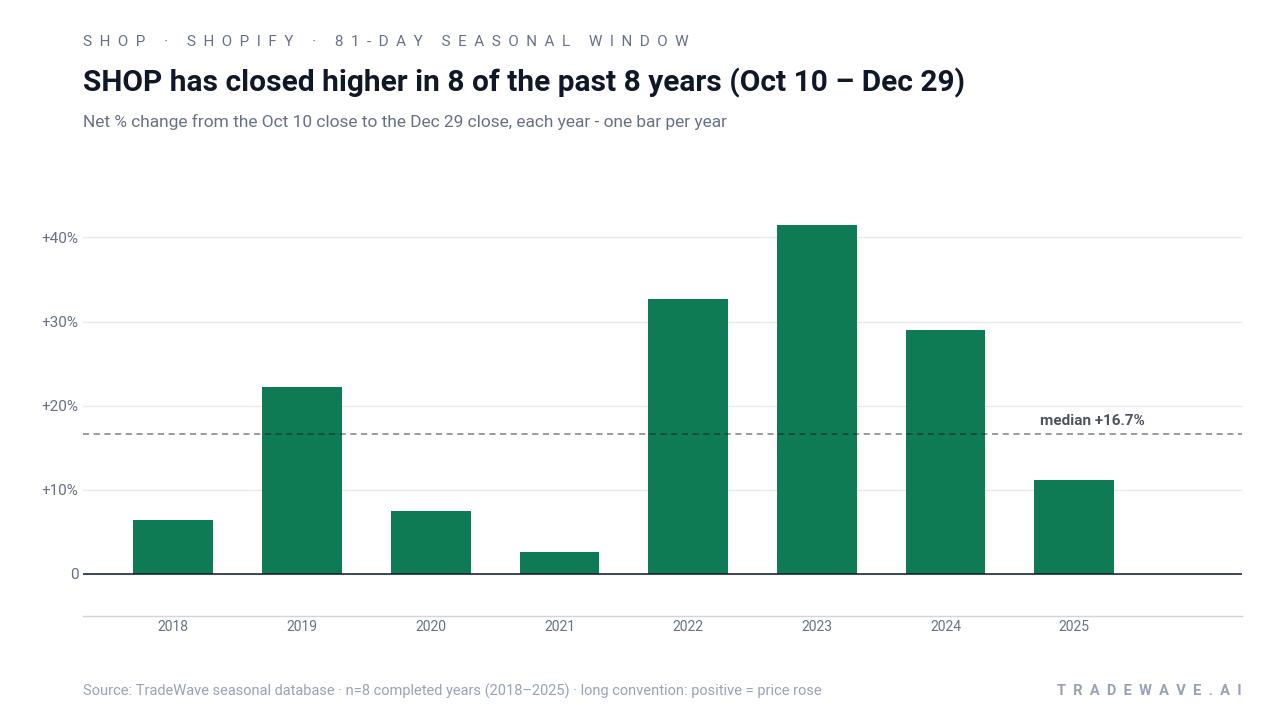
Shopify has risen in 8 of 8 years during the Oct 10 to Dec 29 window, with an average gain of 19.12% in winning years.
- 8 for 8 in this window, with Shopify averaging 19.12% gains across all winning years from 2018 to 2025.
- The upcoming seasonal stretch runs from Oct 10 through Dec 29, covering 81 calendar days into the heart of the holiday quarter.
- Percent Profitable is 100.0%, with 8 winners and 0 losers over the eight-year lookback.
- Average winner gains of 19.12% come with a 14.25% standard deviation, pointing to meaningful volatility inside the window.
- Intraperiod swings have been wide, with individual years showing double-digit peak run-ups and drawdowns before finishing higher.
- The pattern is aligned with a long trade direction, meaning the historical bias has favored upside rather than short setups in this slice of the calendar.
According to historical data from TradeWave.ai, Shopify’s behavior in the final quarter of the year has followed a remarkably consistent path across the past eight years. The next section looks at how that pattern lines up with today’s price and the coming holiday season.
How has Shopify (SHOP) traded in the Oct 10 to Dec 29 window?
Shopify has finished higher in this Oct 10 to Dec 29 window in 8 of the past 8 years, posting an average gain of 19.12% and a cumulative 285.74% return when the slices are stacked. Shares closed Wednesday at $147.74, up 7.1% on the day and about 18.9% below the 52-week high of $182.19, leaving room above if the usual late-year strength shows up again.
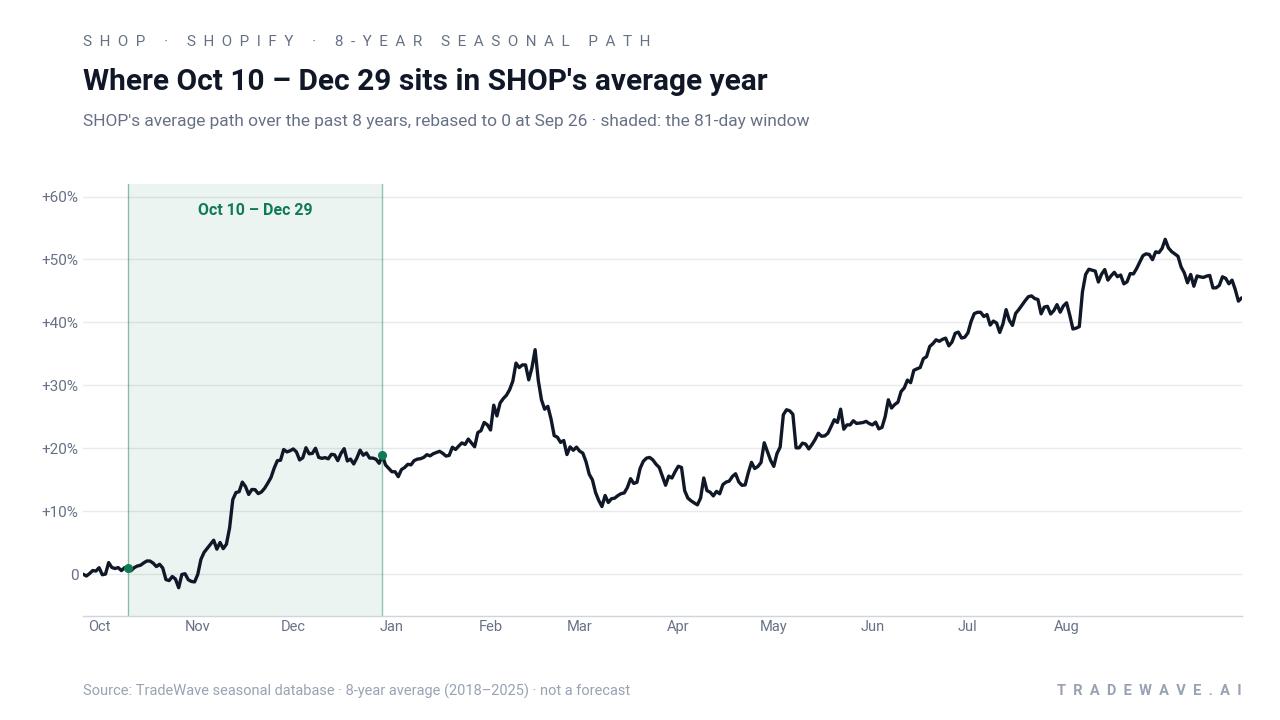
A second view combines net results with the full intraperiod range, from worst drawdown to best rally, for each year.
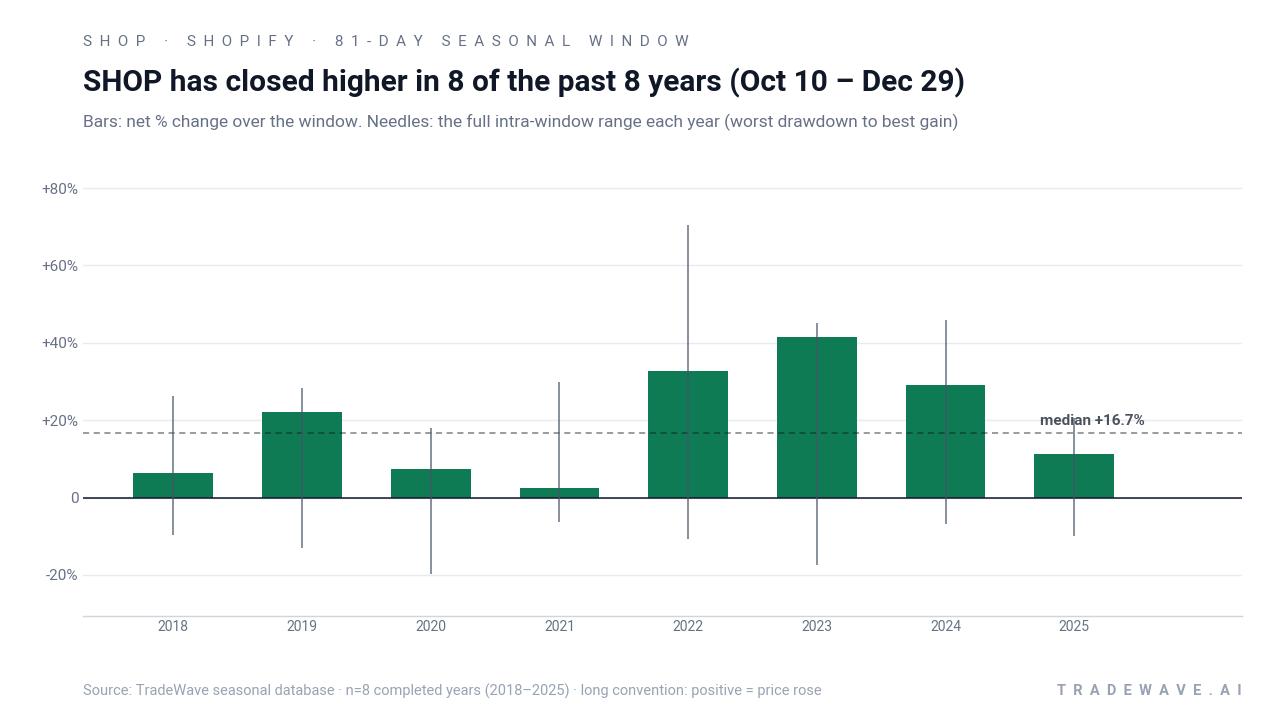
Across the eight-year sample, the strongest net outcome came in 2023, when Shopify gained 41.43% in the window after an intraperiod peak move of 45.23% and a worst drawdown of 17.39% from the entry. The softest year was 2021, which still finished up 2.58% despite a maximum favorable move of 29.91% and a 6.27% pullback at the worst point. That gap between the best intraperiod rally and the final close shows how often traders left money on the table if they waited for the very end of the window.
The maximum favorable excursion, or best run-up from the entry, has repeatedly pushed into the high teens or better, with 2022’s window peaking at a 70.36% gain before settling at a 32.7% close-to-close return. On the downside, the maximum adverse excursion has ranged from about 6% to nearly 20%, with 2020’s window seeing a 19.72% drawdown at its worst point even though it ultimately finished 7.49% higher. That combination of large positive and negative swings is what the 1.99 TradeWave Ratio is flagging: price has tended to travel a long way in the long direction inside the window, but not in a straight line.
The cumulative chart for this Shopify trading window compounds each year’s result and climbs to 285.74% over the eight completed cycles, which is unusually smooth for a single stock’s seasonal pattern. There are no flat or negative years in the series, just a staircase of gains that accelerates in the 2022 to 2024 stretch as the stock’s absolute price level rose. Add it up: eight straight positive windows, double-digit average gains, and a track record of sharp intraperiod swings that have historically rewarded long exposure but punished weak risk management.
History does not guarantee future results; even in all-winning windows like this one, adverse excursions can be large and timing mistakes can be costly.
Why does Shopify (SHOP) follow this seasonal pattern?
One likely driver is the clustering of Shopify’s heaviest gross merchandise volume and merchant activity into the holiday shopping season, which runs straight through this October to December window. Analysts have also pointed to institutional portfolio repositioning and year-end window dressing in high-growth software and e-commerce names, which can amplify flows into winners as the calendar closes.[5] The pattern may also reflect how investors handicap Shopify’s earnings and guidance cadence around the holiday quarter, with optimism about consumer spending and AI-driven commerce tools often building into year-end.[1]
What is driving Shopify (SHOP) today?
Shopify closed Wednesday at $147.74, up 7.1% on the session after a strong rebound from the prior close of $137.92, though the stock remains about 18.9% below its 52-week high of $182.19. The move comes against a backdrop of earlier valuation worries in high-growth software and e-commerce, with some commentators in February 2026 arguing that Shopify’s rally to $130 had stretched fundamentals in the middle of a broader “SaaSpocalypse” reset for the group.[5] In February 2026, the company reported Q4 2025 revenue of $3.67 billion, topping estimates, and announced a $2 billion buyback, but the stock sold off as investors focused on margins and guidance rather than the headline beat.[1]
In November 2025, Shopify had already set the tone for this holiday-season narrative by forecasting mid-to-high-twenties revenue growth for the quarter and flagging that AI and international expansion were driving merchant adoption while pressuring margins.[2] By June 2026, the board expanded the repurchase program by another $3 billion, taking total buyback capacity to $5 billion and signaling confidence in the long-term story even as investors debated how AI competition might reshape e-commerce infrastructure.[3] Earlier in January 2026, Wolfe Research downgraded the stock and removed its $185 price target, underscoring how split Wall Street has been on whether Shopify’s growth profile justifies its multiple.[4]
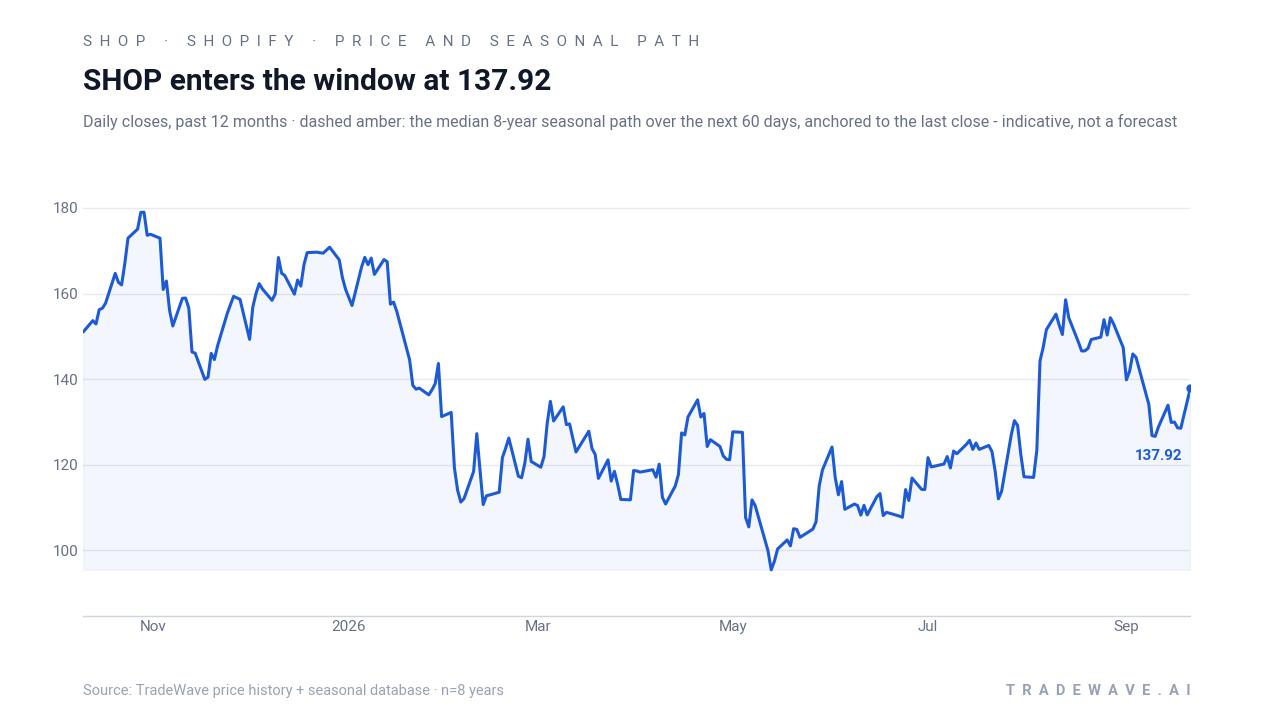
The chart below shows Shopify’s past year of trading alongside a median 60-day seasonal projection, giving context for how the latest bounce fits into the stock’s typical late-year pattern.
Sources
- CNBC - Shopify stock drops despite revenue beat, $2 billion buyback - CNBC
- Reuters - Shopify expects strong holiday revenue, costs dent quarterly margins - Reuters
- Reuters - Shopify expands share buyback program by $3 billion
- Yahoo Finance (The Fly) - CoreWeave initiated, Shopify downgraded: Wall Street's top analyst calls - Yahoo Finance
- Forbes - Sell Shopify Stock At $130? - Forbes
About this seasonal analysis
Seasonal pattern data is sourced from TradeWave.ai, which analyzes historical price behavior across annual calendar windows going back up to 30 years. Read the full data methodology or the book The 100-Year Pattern by Afshin Moshrefi (2026 edition). Past performance of seasonal patterns does not guarantee future results. This article is for informational purposes only and does not constitute investment advice.