Automatic Data Processing (ADP) Has Rallied in 9 of 10 Midterm Oct 11-30 Windows
Automatic Data Processing is heading into a historically strong Oct 11–30 trading window just as the stock trades about 8.3% below its 52-week high and investors weigh earnings strength, dividends and election-cycle risk.
Price as of Oct 1, 2026: $263.96 (last close).
What is the seasonal pattern for Automatic Data Processing (ADP)?
Automatic Data Processing has risen in 9 of 10 years during this late-October midterm-year window, with an average gain of 7.72% in winning years.
- 9 for 10 in this window, with winning years averaging 7.72% gains from Oct 11 to Oct 30.
- Percent Profitable is 90.0%, with 9 winners and 1 loser across the last 10 midterm election years.
- Including the lone down year, Avg Profit - All still comes in at 6.88%, showing the window has skewed positive overall.
- The worst year in the sample lost just 0.67%, while the strongest year gained 12.08%, underscoring a bullish ADP seasonal trend.
- The TradeWave Ratio of 2.32 points to meaningful intraperiod travel in the trade direction, with a Sharpe ratio of 1.73 for end-of-window outcomes.
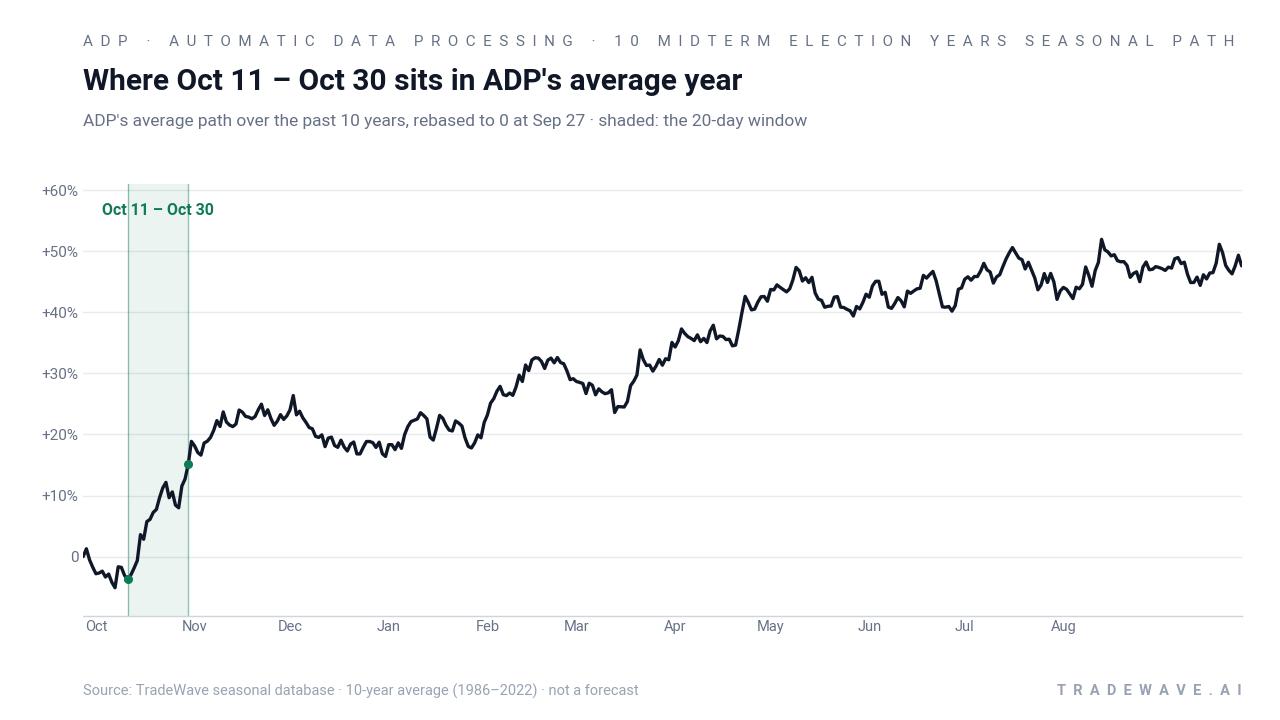
- This Automatic Data Processing trading window opens Oct 11 and runs 20 calendar days, sitting in the late part of the midterm election year as markets pivot toward the pre-election phase.
According to historical data from TradeWave.ai, this specific late-October stretch has behaved very differently from an average month for ADP in past midterm election years. The next section walks through what that pattern has looked like and how it lines up with today’s setup.
How has Automatic Data Processing (ADP) traded in the late-October midterm window?
Automatic Data Processing has closed higher in 9 of the last 10 midterm election years during the Oct 11–30 window, with an average gain of 7.72% in winning years and a 6.88% average across all years. Shares finished Friday at 263.96, up 2.3% on the day and about 8.3% below the stock’s 52-week high of 288.00, leaving room above if the historical pattern repeats.
Grouping the data by the presidential election cycle matters here because ADP’s clients are tied to payrolls, hiring and corporate budgets that often respond to policy shifts and fiscal debates. The late part of the midterm election year has historically marked a transition from policy uncertainty toward a more risk-on tone as markets start to discount the pre-election year, which has often been friendlier for equities.
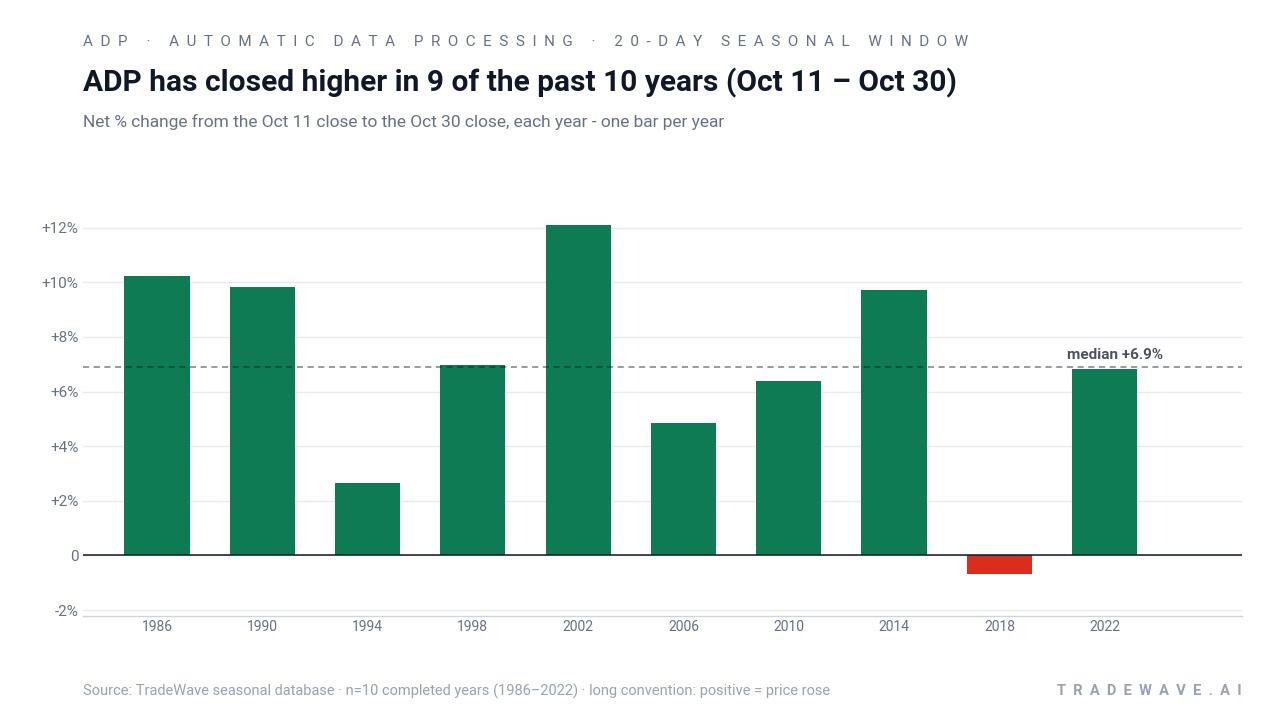
For this Automatic Data Processing trading window, the trade direction is long, so positive returns and rallies are the favorable years in the pattern. Across the last 10 midterm election years, the strongest outcome came in 2002 with a 12.08% gain, while the weakest was 2018 with a modest 0.67% loss. That mix produces a 6.82% annualized return and a Sharpe ratio of 1.73 for end-of-window results, which is unusually strong for a 20-day slice of the calendar.
The per-year table shows that even the softer years often saw meaningful intraperiod swings. In 1998, for example, ADP finished the window up 6.96% after reaching a best intraperiod gain of 10.22% and weathering a worst drawdown of 4.38% from the entry. In 2018, the only losing year, the stock still tagged a 5.04% best run-up before reversing to a small loss, with a 3.65% worst drawdown along the way. That is the kind of path where traders who manage risk intraday or on shorter horizons may experience both opportunity and stress inside what ultimately looks like a small net move.
The maximum favorable move and maximum adverse move profile across the sample points to a window that has historically offered more upside than downside for longs, but with real swings. Several years show best intraperiod gains in the high single digits to mid-teens, while the worst drawdowns tend to cluster in the low single digits. Combined with a TradeWave Ratio of 2.32, that suggests ADP has often traveled a meaningful distance in the trade direction within this window, even when the final close did not capture the full move.
A second view stacks each year’s net result with its best and worst intraperiod swings to show the full range of outcomes.
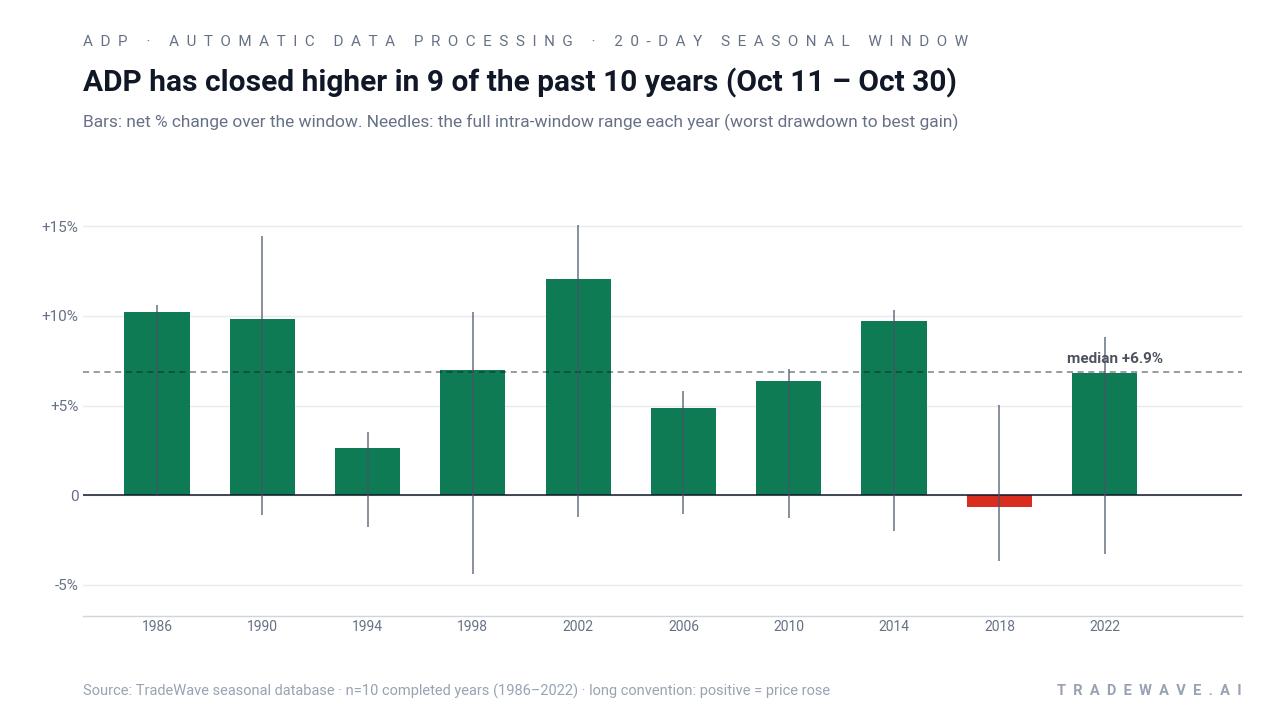
History does not guarantee future results; adverse excursions can be large even in winning windows, so traders should respect the potential for drawdowns inside this historically strong stretch.
Why does Automatic Data Processing (ADP) follow this seasonal pattern?
One likely driver is the way corporate payroll and HR budgets reset in the back half of the year, often aligning with calendar-year planning and contract renewals that can support bookings for ADP. Analysts have also pointed to sector rotation around the midterm election year, when investors often move back into steady, cash-generative software and services names after earlier volatility tied to policy uncertainty.[8] This pattern may also reflect institutional portfolio repositioning ahead of the pre-election year, when risk appetite has historically improved for quality large-cap stocks.
What is driving Automatic Data Processing (ADP) today?
Automatic Data Processing shares closed at 263.96 on Friday, up 2.3% on the session, leaving the stock about 8.3% below its 52-week high of 288.00 and well above its 52-week low near 185.34. The move comes after investors digested a solid July quarter in which ADP delivered $2.64 in EPS versus a $2.59 consensus and 6.8% year-over-year revenue growth to $5.47 billion, alongside robust return on equity of 71.34% and a 20.11% net margin.[1] The company has also laid out FY 2027 EPS guidance of $12.120 to $12.340, with Wall Street forecasts clustering around $12.26, reinforcing the view of steady, mid-single-digit growth from a mature payroll and HCM franchise.[1]
On the capital return side, ADP’s board this week declared a quarterly dividend of $1.70, or $6.80 annualized, which works out to a yield of roughly 2.6% at current prices and keeps the stock in the mix for income-focused portfolios. The company has also highlighted a $6 billion share repurchase plan that analysts see as a support for per-share earnings growth over time, especially if organic revenue growth moderates. That combination of dividends and buybacks has helped frame ADP as a defensive software name within the broader SaaS and HR tech sector, even as newer cloud-native competitors and AI-driven tools keep competitive pressure elevated.[3][8]
From a positioning standpoint, institutional interest remains active. A late-September filing showed Envestnet Portfolio Solutions adding 6,548 ADP shares, a modest but notable vote of confidence from a large allocator.[6] At the same time, several sources have flagged ongoing insider selling over the past year, including transactions by senior executives and directors, which some investors read as a sign that management sees the stock as fairly valued after a long run.[4][7] Options activity appears broad across strikes and expirations rather than concentrated in a single speculative bet, suggesting traders are using the chain more for hedging and income than for a one-sided directional play.[2]
Macro and sector currents are another layer. In March 2026, commentary around ADP’s outlook highlighted mixed hiring signals from the firm’s own NER Pulse data, which showed some easing in hiring momentum earlier in the year.[8] Because ADP’s revenue is tied to payroll counts and employment churn, any sustained cooling in the labor market could weigh on bookings, even if the company’s scale and recurring revenue model provide a buffer. At the same time, the broader SaaS and payroll sector is wrestling with AI adoption, where ADP’s size is an advantage but also forces it to move carefully to avoid disrupting core systems that clients rely on.[8]
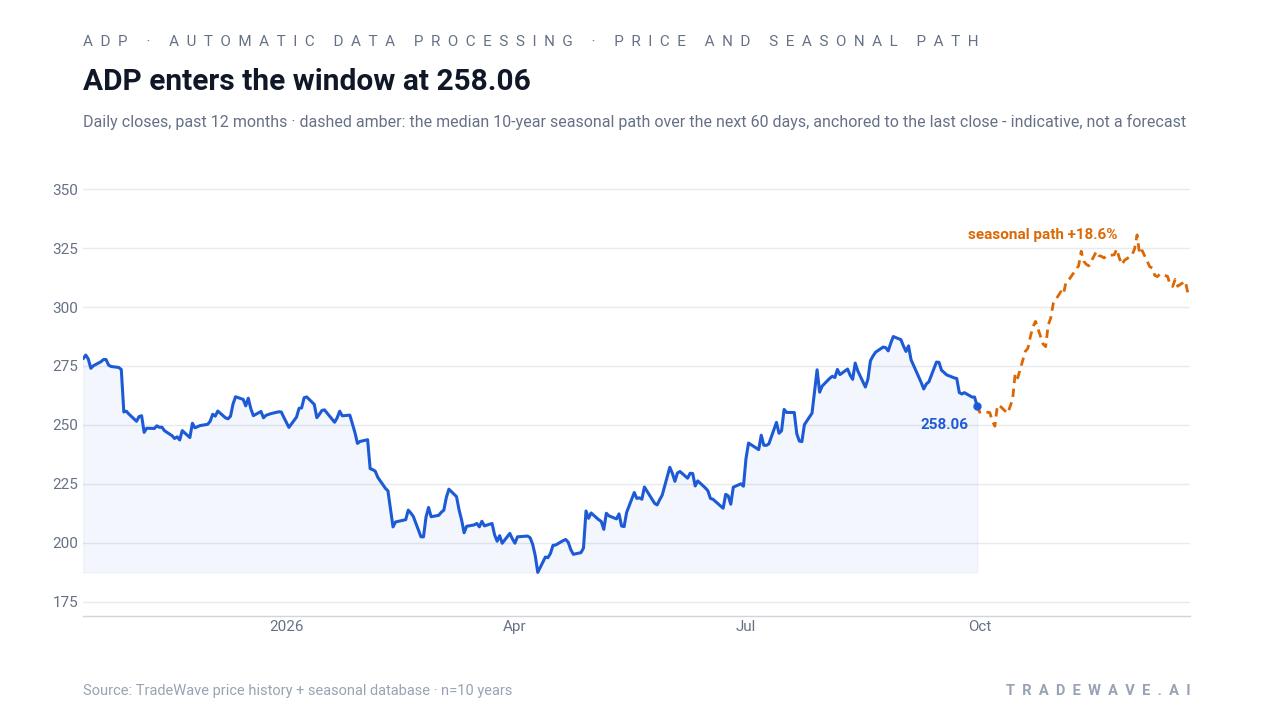
The chart below situates the latest move in its recent multi-month context and overlays the median 60-day seasonal path for comparison.
What should traders watch as the Oct 11–30 window approaches?
First, the calendar: this 20-day window opens on Oct 11, in the concluding stretch of the midterm election year, and runs into the heart of earnings season for many large caps. For ADP, any updates on hiring trends, client retention or pricing power in upcoming management commentary will matter, especially against the backdrop of earlier signs that hiring momentum had eased in late winter.[8] If the company can show that bookings remain resilient despite a cooler labor tape, that would align with the historically bullish seasonal pattern.
Second, price levels. With the stock about 8.3% below its 52-week high and sitting near its 50-day moving average of 270.63, traders will be watching whether ADP can reclaim that moving average and then challenge the high as the window unfolds. A pattern of higher lows into and during the Oct 11–30 stretch would rhyme with prior midterm-year behavior, while a break back toward the low-200s would be a clear departure from the historical seasonal trend.
Third, flows and positioning. Institutional filings like the recent Envestnet purchase, along with any acceleration or slowdown in insider selling, will help gauge whether long-only investors are leaning into the stock or taking chips off the table as the year winds down.[4][6][7] On the derivatives side, traders can monitor whether options volume starts to cluster in upside calls or downside puts around the window; a shift toward call buying would be consistent with the historical upside bias, while heavy put demand could signal that investors are using the seasonal strength to hedge or fade the move.[2]
Finally, the election and policy calendar. As the midterm election year wraps up and markets begin to discount the pre-election year, investors will be parsing any changes in fiscal stance, regulation or labor policy that could affect payroll volumes and HR tech spending. If ADP trades firm through that noise and respects support levels during the Oct 11–30 stretch, it would fit the pattern of a stock that has historically used this window to grind higher. If instead the stock sells off hard despite the favorable seasonal backdrop, that would be a signal that macro or company-specific forces are overpowering the usual late-October tailwind.
Sources
- MarketBeat - Automatic Data Processing, Inc. (NASDAQ:ADP) Stock Has Consensus Price Target of $273.50
- MarketBeat - Automatic Data Processing (ADP) Options Chain & Prices 2026
- Forbes - Automatic Data Processing | ADP Stock Price, Company Overview & News
- MarketBeat - Automatic Data Processing (ADP) 10K Form and Latest SEC Filings 2026 | MarketBeat
- Yahoo Finance - Automatic Data Processing, Inc. (ADP) Recent Insider Transactions - Yahoo Finance
- MarketBeat - Envestnet Portfolio Solutions Inc. Purchases 6,548 Shares of Automatic Data Processing, Inc. $ADP
- GuruFocus - Automatic Data Processing Inc (ADP) Shares Fall 3.5%
- Yahoo Finance - The Bull Case For Automatic Data Processing (ADP) Could Change Following Guggenheim’s Initiation And Mixed Hiring Signals
About this seasonal analysis
Seasonal pattern data is sourced from TradeWave.ai, which analyzes historical price behavior across annual calendar windows going back up to 30 years. Read the full data methodology or the book The 100-Year Pattern by Afshin Moshrefi (2026 edition). Past performance of seasonal patterns does not guarantee future results. This article is for informational purposes only and does not constitute investment advice.