AI Tailwind Meets 10-for-10 Midterm Fall Losing Streak for Advanced Micro Devices (AMD)
Advanced Micro Devices is entering a historically weak late-September to mid-October stretch just as shares trade near record highs and AI-fueled earnings momentum keeps the stock in the spotlight.
Price as of Sep 29, 2026: $607.57 (last close).

What is the seasonal pattern for Advanced Micro Devices (AMD)?
Advanced Micro Devices has fallen in 10 of 10 midterm-year Sep 30 to Oct 17 windows, with an average 13.41% gain for short positions in winning years.
- 10 for 10 in this window: AMD has closed lower in every midterm-year Sep 30 to Oct 17 stretch in the last 10 cycles, with shorts averaging 13.41% gains.
- Seasonal bias is bearish for the stock price but favorable for short trades, with 100.0% Percent Profitable, 10 winners and 0 losers across the sample.
- The average winner move of 13.41% over just 18 calendar days comes with a 9.07% standard deviation, pointing to a fast and volatile trading window.
- The TradeWave Ratio of 1.93 suggests price has typically traveled meaningfully in the short direction within the window, independent of the final close.
- Intraperiod swings have been large, with historical best-case rallies for shorts and sharp adverse bounces both showing up inside individual windows.
- Pattern applies specifically to the last 10 midterm election years, a phase that often features policy uncertainty and choppy trading in high-beta tech names.
According to historical data from TradeWave.ai, this midterm-year autumn stretch has behaved very differently from an average month for AMD, with a clear directional bias that traders rarely see discussed in day-to-day headlines.
How has Advanced Micro Devices (AMD) traded in this midterm-year autumn window?
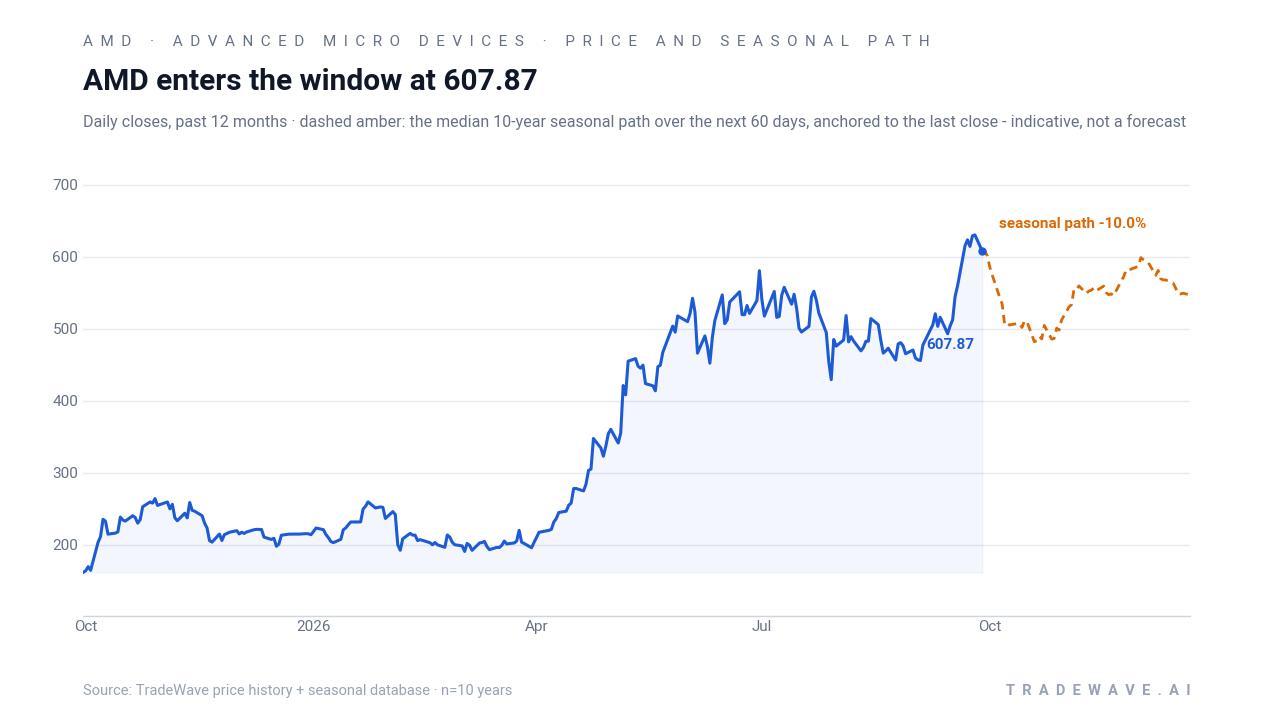
Advanced Micro Devices has dropped in every single Sep 30 to Oct 17 window across the last 10 midterm election years, with short trades averaging 13.41% gains over just 18 days. Shares enter this year’s iteration at 607.57, down fractionally on the day and about 5.0% below the 52-week high of 639.00, after a 160% surge year to date that has made AMD one of 2026’s standout mega-cap winners.[1][2]
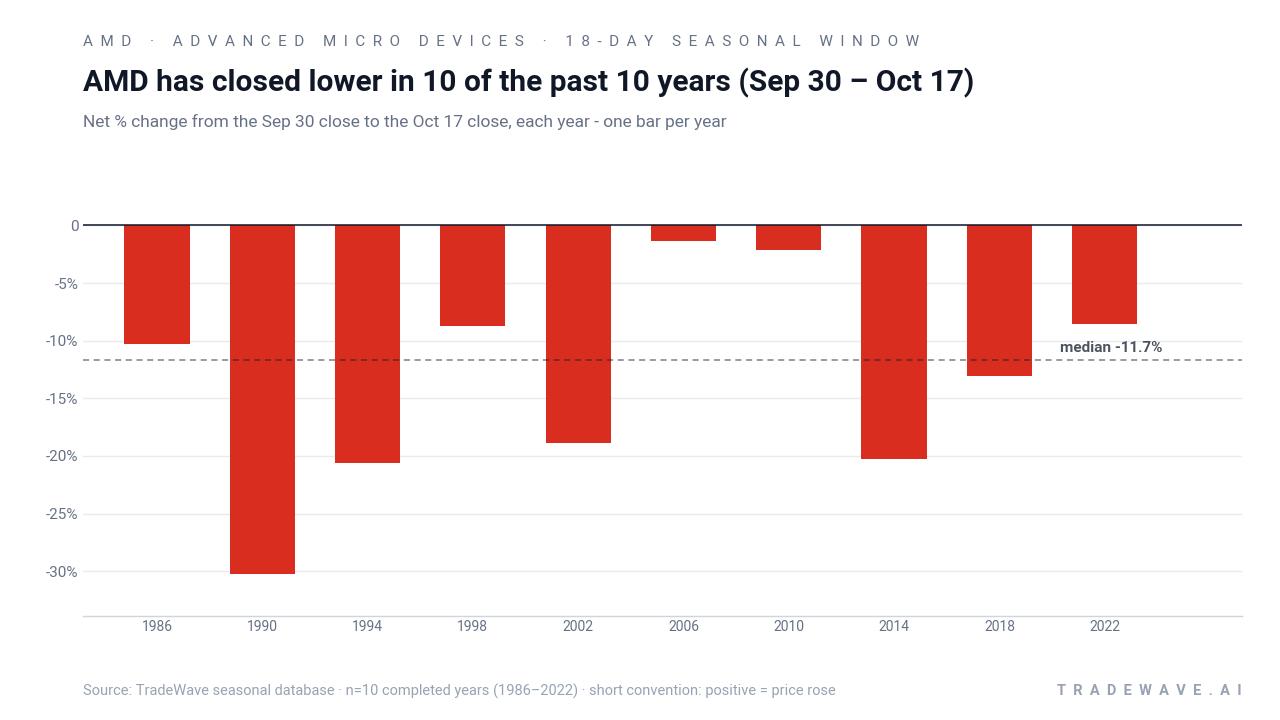
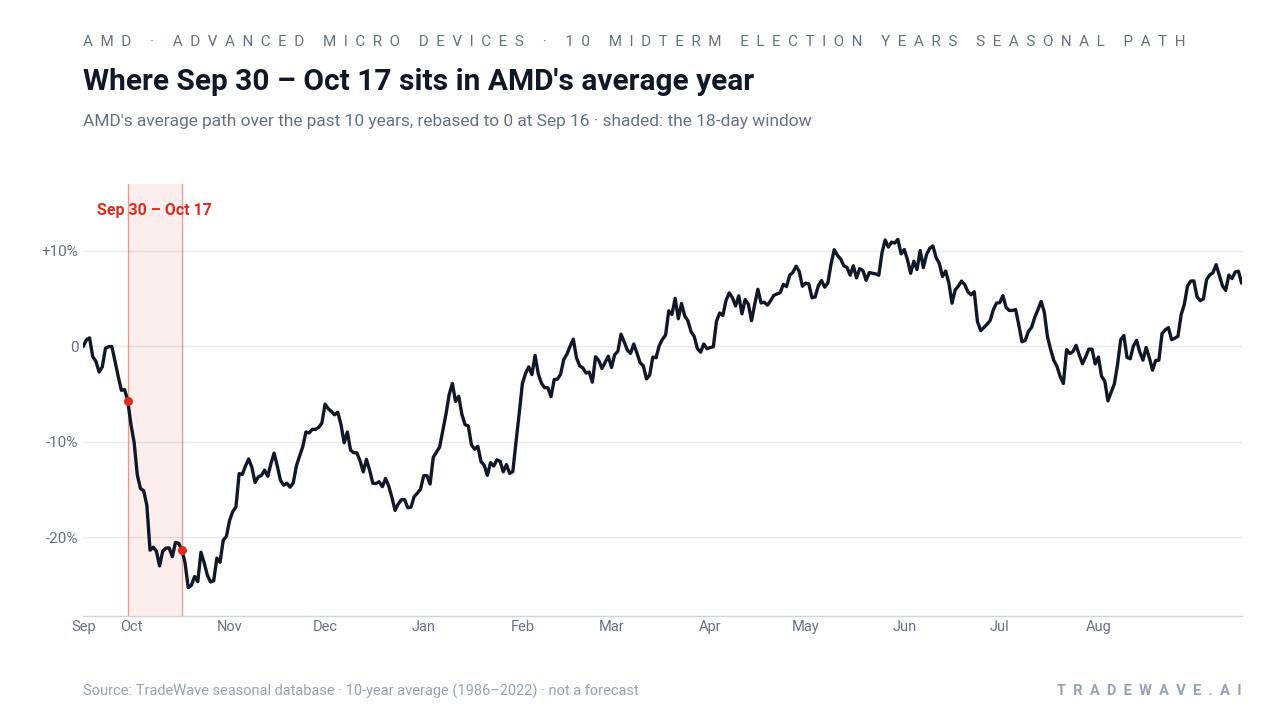
In this framework, the pattern phase is the midterm election year, and the calendar phase is the late part of that year. That matters because midterm years often behave like a two-playbook market: choppy and risk-heavy early on, then historically stronger as investors look ahead to the year before the presidential election. AMD’s Sep 30 to Oct 17 window sits right at that transition, capturing a slice of the calendar that has repeatedly seen the stock give back ground even when the broader regime was turning more constructive.
A second view combines net results with the full intraperiod range, highlighting how far AMD has tended to swing inside this window.
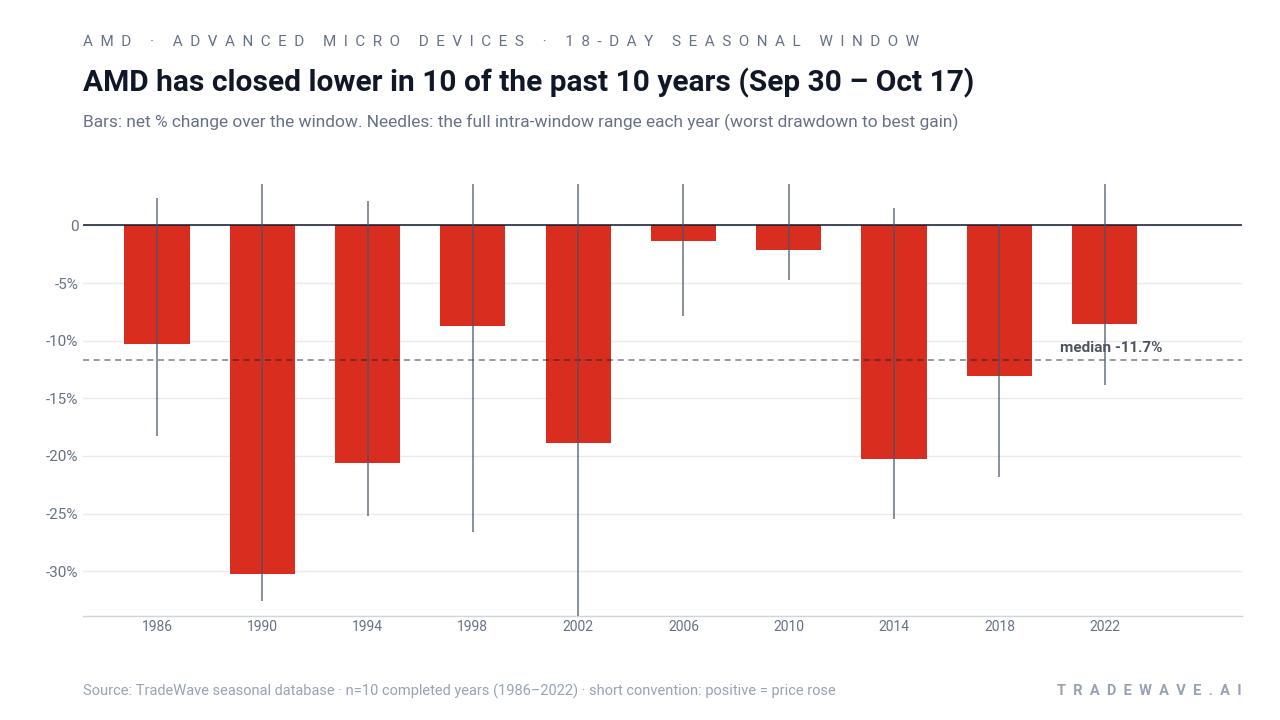
Across the 10 midterm-year samples, the average winner gain of 13.41% for shorts comes with a 9.07% standard deviation, which is high for an 18-day stretch. The maximum favorable move for shorts in individual years has been substantial, with several windows seeing double-digit declines from entry to the best intraperiod low, while the maximum adverse move has at times reached into the mid- to high-teens as AMD briefly squeezed higher before rolling over. The per-year table shows 1990 as the strongest short year, with a net return of -30.23% for the stock and a worst drawdown from entry of -32.56%, while 2006 stands out as the softest outcome, with only a -1.33% net move and a relatively modest -7.82% worst drawdown.
The cumulative chart of this window compounds to a 242.1% gain for the short side across the 10 midterm-year iterations, a sign that the pattern has not just been consistent but also additive over time. Add it up: 10 straight down windows for the stock, no losing years for shorts, and a Sharpe ratio of 1.46 that reflects strong risk-adjusted returns based on end-of-window outcomes. The pattern is clear and one-sided in this sample, even as the intraperiod MFE and MAE profile reminds traders that the path from entry to exit has rarely been smooth.
History does not guarantee future results; adverse excursions within the window have been large in several years, and even a pattern with 10 winners out of 10 can break.
Why does Advanced Micro Devices (AMD) follow this seasonal pattern?
One likely driver is the way AMD’s earnings calendar and guidance updates cluster around the back half of the year, when investors reassess demand for data center and AI chips and adjust positions in high-beta semiconductors. Analysts have also pointed to midterm election years as periods when policy and rate uncertainty can hit growth stocks hardest, prompting portfolio de-risking in names like AMD even when long-term AI demand remains strong.[2][5][10] This pattern may reflect a mix of profit-taking after strong runs, options-related positioning around October expirations, and sector rotation as managers rebalance into or out of semiconductors ahead of the year before the presidential election.
What is driving Advanced Micro Devices (AMD) today?
AMD closed Tuesday at 607.57, slipping 0.05% on the day as the stock continued to consolidate just below its 52-week high of 639.00 after a 160% year-to-date surge that has turned it into one of the market’s key AI bellwethers.[1][2][6] The move comes against a backdrop of blockbuster 2026 gains and a still-bullish analyst stance: Barchart’s aggregated data shows a “Strong Buy” consensus rating with a consensus price target around 603.10, a level the stock has already traded through as the AI trade accelerated.[2]
Fundamentally, the story remains about AI infrastructure and data center demand. In Q1 2026, AMD reported revenue of $10.25 billion, up 38% year over year, with net income nearly doubling to $1.38 billion as demand for MI450 accelerators and Helios systems surged; the stock jumped as much as 18.6% on the day of that report.[10] Zacks notes that investors are now looking ahead to the next scheduled catalyst, AMD’s Q3 2026 earnings report on Nov 3, which will offer a fresh read on whether that AI-driven momentum is holding up into year-end.[1][5]
Macro conditions are adding another layer. The broader market has been wrestling with the path of interest rates and how tighter financial conditions intersect with high-multiple growth stocks, even as AI remains a powerful secular tailwind.[2][5][10] For a name like AMD, which sits at the center of the semiconductor and data center trade, that mix has translated into sharp single-day swings around news and upgrades, but also a willingness among institutional investors to keep paying up for exposure to the AI build-out.[2][6][9]
The chart below situates the latest pullback against AMD’s explosive 2026 rally and the historical seasonal projection for the next two months.
What should traders watch in this AMD seasonal window?
First, the calendar: this 18-day window runs from Sep 30 through Oct 17, overlapping the late stages of the midterm election year and the early setup for the historically stronger year before the presidential election. Traders will be watching whether AMD’s price action respects the historical pattern of weakness into mid-October or instead shrugs it off, which would mark the first break in a 10-for-10 record for the short side. A sustained move back toward the 52-week high near 639.00 during the window would contradict the typical midterm-year seasonal trend, while a drift lower with intraday spikes would look more like prior cycles.
Second, catalysts and levels. The next major scheduled event is the Q3 2026 earnings report on Nov 3, which falls just after this window ends but will influence how investors position through October.[1][5] In the meantime, traders are likely to focus on how AMD trades around key technical zones such as the recent highs and the 50-day moving average, which sits well below spot and reflects how far the stock has run ahead of its intermediate trend.[1][2] Any pickup in volatility or volume around macro headlines on rates or AI spending could amplify the intraperiod swings that have historically characterized this stretch.
Finally, the broader election-cycle backdrop matters. As the market concludes the midterm election year and looks toward the year before the presidential election, investors will be gauging whether policy clarity and fiscal signals support continued risk-on appetite in high-growth semiconductors. If AMD follows its historical midterm-year pattern and softens into mid-October, then stabilizes ahead of earnings, that would fit the script of a choppy transition phase before a potentially stronger pre-election year environment. If instead the stock powers higher through this window, it would signal that AI enthusiasm and earnings momentum are overwhelming a seasonal tendency that has held for a decade of midterm cycles.
Sources
- The Wall Street Journal (Barron's Online content shown) - Advanced Micro Devices Inc. (AMD) Stock Price Today - The Wall Street Journal
- Barchart - Advanced Micro Devices Reported Record Revenue. AMD Stock Sank Anyway.
- Barchart - Are Wall Street Analysts Predicting Advanced Micro Devices Stock Will Climb or Sink?
- Barchart - AMD Stock Is Up 160% in 2026 and Analysts Still Love It
- Zacks - Advanced Micro Devices (AMD) Suffers a Larger Drop Than the General Market: Key Insights - September 28, 2026 - Zacks.com
- The Motley Fool - Great News for AMD Stock Investors!
- The Motley Fool - Why Advanced Micro Devices Stock Popped Today | The Motley Fool
- Seeking Alpha - AMD’s Missing (Ultra Accelerator) Link (NASDAQ:AMD)
- Seeking Alpha - Did AMD Just Leapfrog Nvidia? (NASDAQ:AMD)
- Yahoo Finance (article republished from GuruFocus) - AMD Jumps on AI Surge, Profit Nearly Doubles - Yahoo Finance
About this seasonal analysis
Seasonal pattern data is sourced from TradeWave.ai, which analyzes historical price behavior across annual calendar windows going back up to 30 years. Read the full data methodology or the book The 100-Year Pattern by Afshin Moshrefi (2026 edition). Past performance of seasonal patterns does not guarantee future results. This article is for informational purposes only and does not constitute investment advice.