IBM Enters Historically Strong Late-October to Mid-February Period
IBM is heading into a historically powerful late-October to mid-February trading window just as the stock sits deep in a midterm-year drawdown after a summer earnings shock.
Price as of Sep 29, 2026: $219.99 (last close).
What is the seasonal pattern for IBM (IBM)?
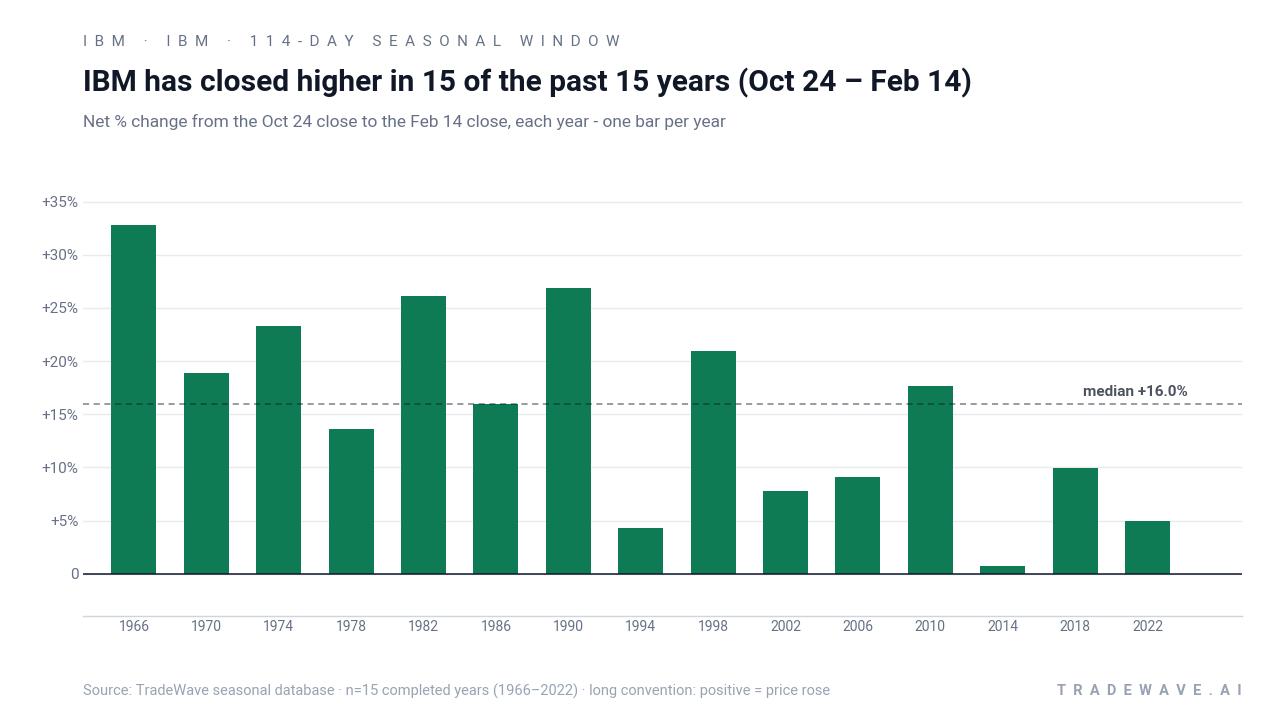
IBM has risen in 15 of 15 midterm-year Oct 24 to Feb 14 windows, with an average gain of 15.53% in winning years.
- 15 for 15 in this window, averaging 15.53% gains in winning years across the last 15 midterm election cycles.
- Seasonal window runs from Oct 24 through Feb 14, spanning 114 calendar days in the midterm election year.
- Percent Profitable is 100.0%, with 15 winners and 0 losers in the historical sample.
- Median profit of 15.96% shows that typical outcomes have been solidly positive, not just skewed by a few big years.
- TradeWave Ratio of 1.87 indicates price has typically traveled meaningfully in the long direction within the window.
- Sharpe ratio of 1.52 points to a strong risk-adjusted profile for this specific IBM seasonal trend.
According to historical data from TradeWave.ai, this midterm-year stretch has behaved very differently from an average quarter for IBM, with a distinct late-October to mid-February bias that traders rarely see discussed.
How has IBM (IBM) traded in the late-October to mid-February window?
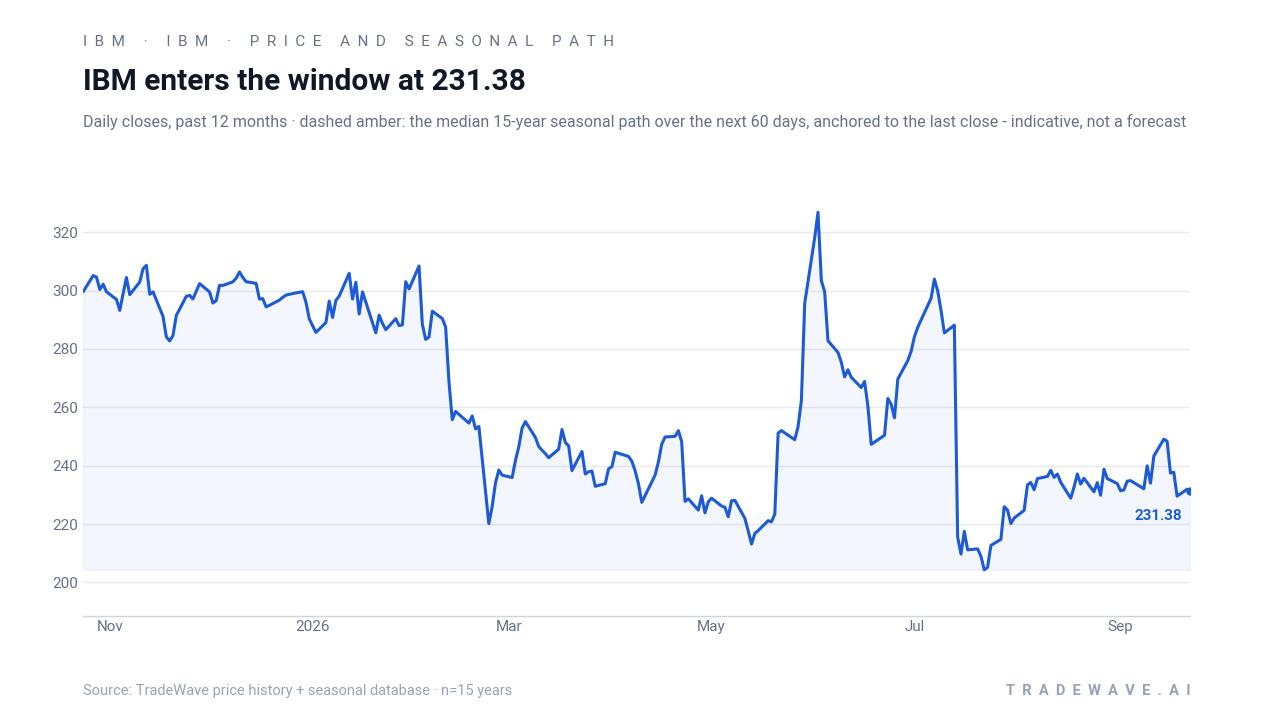
IBM has risen in 15 of the last 15 midterm election years during the Oct 24 to Feb 14 window, averaging 15.53% gains for long positions. Today the stock closed at 219.99, down 0.3% on the session and roughly 26.0% lower year to date after a bruising summer slide.
The presidential election cycle matters here because this pattern only looks at the last 15 midterm election years, then tracks how IBM behaved from late October into the following February. That lines up with a policy backdrop where Washington is usually past the midterm vote and markets start to price the fiscal and regulatory tone heading into the pre-election year.
Across those 15 midterm-year windows, IBM’s median gain is 15.96%, which means the typical outcome has been a mid-teens advance rather than a marginal drift higher. The strongest years in the per-year table include 1990, when the stock gained 26.89% in the window, and 1998, when it rose 20.92%. Even the softer years, such as 1994 at 4.3% and 2014 at 0.69%, still finished in positive territory.
The historical path inside the window has not been a straight line. In 2018, for example, IBM finished the window up 9.92% but endured a worst intraperiod drawdown of 15.66% from the entry price, showing that even “winning” years could feel rough in real time. Other years, like 1998 and 2002, saw no adverse move from the entry at all, with the stock grinding higher from day one.
A second view stacks each year’s net result with its best and worst intraperiod swings to show the full trading range.
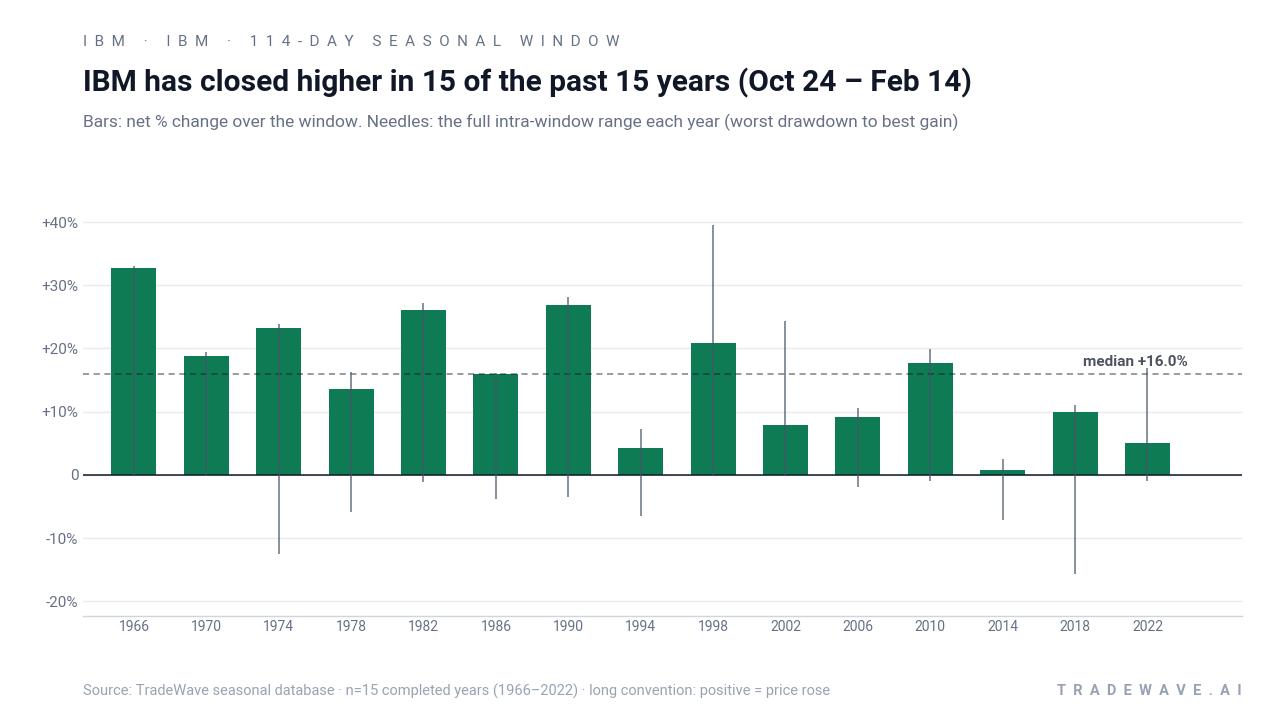
The stacked net / best-gain / worst-drawdown chart shows why this IBM trading window has attracted quant attention. Maximum favorable moves in strong years, such as 39.48% in 1998 and 28.07% in 1990, point to sizable upside bursts, while maximum adverse moves have usually stayed in the mid-single digits, apart from 2018’s deeper 15.66% dip. That combination of large historical run-ups and mostly contained downside is what drives the 1.87 TradeWave Ratio and a 1.52 Sharpe ratio for this long-only setup.
History does not guarantee future results; even in a perfect 15-for-15 window, adverse excursions can be large and uncomfortable before the trade finishes higher.
Why does IBM (IBM) follow this seasonal pattern?
One likely driver is IBM’s earnings and budget cycle, with many large enterprise and government clients finalizing spending plans and mainframe refreshes between late October and early in the new year. Analysts have also pointed to institutional portfolio rebalancing around the midterm election year, when investors often rotate into established cash-generating tech names as policy uncertainty clears. This IBM seasonal pattern may reflect that combination of fiscal-year budgeting, post-election positioning and sector rotation into defensive technology during the winter months.
What is driving IBM (IBM) today?
IBM closed Wednesday at 219.99, down 0.68 points on the day, leaving the stock roughly 26.0% lower for 2026 after a sharp summer reset. In July 2026, the company preannounced second-quarter revenue and adjusted earnings below Wall Street expectations, citing a shift in client capital spending toward servers, storage and memory amid supply constraints, and the surprise warning triggered a historic single-day drop in the shares as heavy selling hit the tape.[1]
That earnings shock also underscored how IBM sits at the intersection of two powerful themes: a global memory shortage and a scramble by enterprises to fund AI infrastructure. Management pointed to clients prioritizing AI servers and storage, which pressured some of IBM’s software and mainframe lines even as AI-related bookings grew inside the portfolio.[1][2] The result is a stock that has been punished in the short term but remains tied to the same AI and infrastructure demand story that lifted it through 2025.[2]
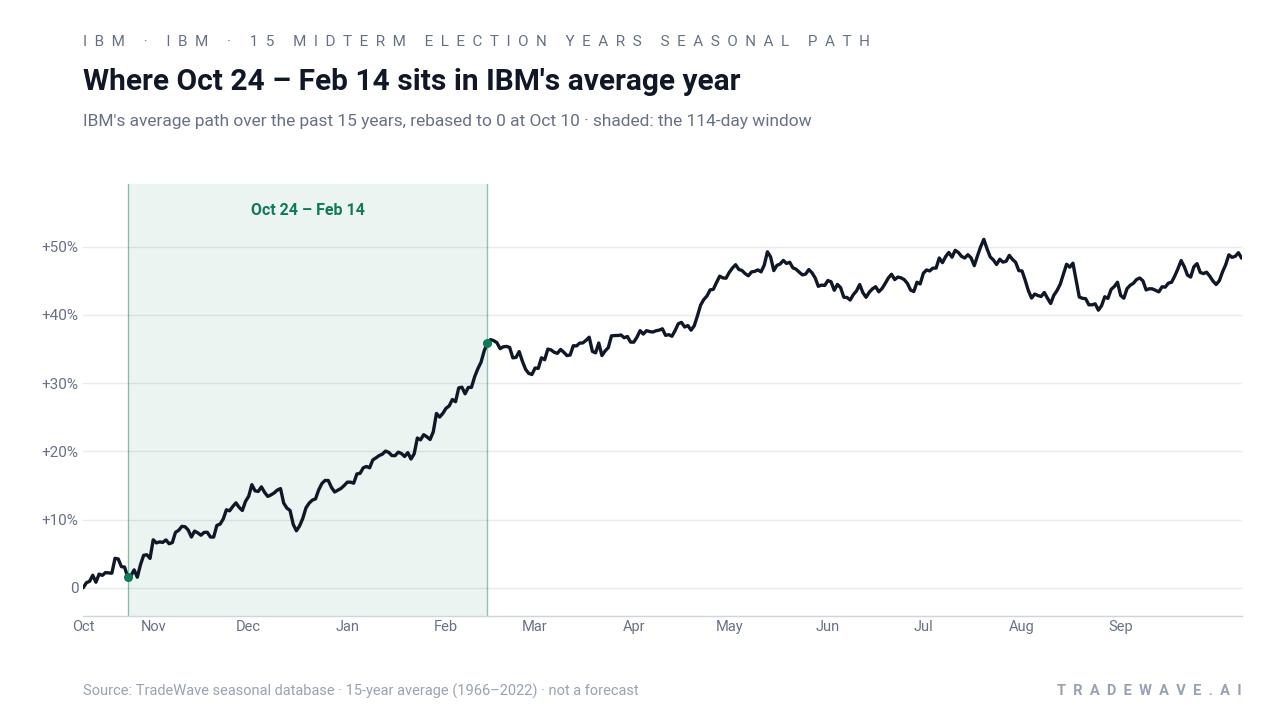
The chart below situates the latest move in its recent multi-month context alongside the median seasonal path.
From a macro and policy angle, this all plays out as the United States wraps up the midterm election year and heads into the pre-election year, a phase that has often coincided with more supportive fiscal stances and clearer regulatory signals for large-cap tech. For IBM, that means the next few months will be about whether enterprise IT budgets stabilize after the memory-driven capex shift and whether AI infrastructure demand can offset any lingering weakness in legacy hardware and software lines.[1][3]
What should traders watch in this IBM seasonal window?
First, the calendar: the 114-day IBM trading window opens on Oct 24 and runs through Feb 14, so any stabilization or reversal of the 2026 downtrend inside that band would line up with the historical midterm-year seasonal pattern. If the stock continues to slide or chop sideways through the heart of the window, that would be a clear break from the 15-for-15 track record.
Second, watch how IBM trades around earnings and guidance updates relative to this window. The July preannouncement reset expectations sharply lower,[1] so any signs that enterprise spending on IBM’s core platforms is recovering, or that AI-related bookings are accelerating, could provide the kind of catalyst that has historically powered winter rallies in the name.[2][3]
Third, monitor volume and volatility on down days. The July selloff featured intense selling pressure as investors digested the warning,[1] and a repeat of that kind of heavy-volume downside inside the seasonal window would signal that fundamental concerns are overwhelming the historical pattern. Conversely, if pullbacks remain relatively contained while buyers step in near support, that would be more consistent with prior midterm-year windows where IBM absorbed early weakness before grinding higher.
Finally, keep an eye on the broader policy and AI infrastructure backdrop. Any easing in supply constraints, clearer guidance on government and enterprise tech budgets, or fresh AI-related contract wins could all act as catalysts within a window that has, historically, already leaned in IBM’s favor. The seasonal record is striking, but how the stock behaves against those catalysts between late October and mid-February will tell traders whether this midterm-year pattern still has teeth.
Sources
About this seasonal analysis
Seasonal pattern data is sourced from TradeWave.ai, which analyzes historical price behavior across annual calendar windows going back up to 30 years. Read the full data methodology or the book The 100-Year Pattern by Afshin Moshrefi (2026 edition). Past performance of seasonal patterns does not guarantee future results. This article is for informational purposes only and does not constitute investment advice.