Omnicom Group (OMC) Has Risen 10 of 10 Midterm Autumns, Averaging 8.61% Gains
Omnicom Group is down year-to-date but approaches an October–November window that has been quietly powerful for the stock in past midterm election years.
Price as of Sep 30, 2026: $73.63 (last close).

What is the seasonal pattern for Omnicom Group (OMC)?
Omnicom Group has risen in 10 of 10 midterm-year Oct 15–Nov 15 windows, with an average gain of 8.61% in winning years.
- 10 for 10 in this window, averaging 8.61% gains in winning years across the last 10 midterm election cycles.
- Seasonal window runs from Oct 15 for 32 days, covering the heart of Omnicom’s late-year trading pattern in midterm election years.
- Percent Profitable is 100.0%, with 10 winners and 0 losers in the historical sample.
- Average profit of 8.61% reflects a strong bullish OMC seasonal trend during this specific autumn window.
- Intraperiod swings have been meaningful, with some years showing double-digit drawdowns before finishing higher.
- The pattern aligns with the concluding midterm election year and the handoff into the historically stronger pre-election year for equities.
According to historical data from TradeWave.ai, this late-October stretch has behaved very differently from an average month for Omnicom Group in past midterm election years, and the next iteration is about to open again.
How has Omnicom Group (OMC) traded in the Oct 15–Nov 15 midterm window?
Omnicom Group has finished higher in every single Oct 15–Nov 15 window across the last 10 midterm election years, averaging gains of 8.61%. The stock closed Thursday at 73.63, down 0.7% on the day and off 8.3% so far in 2026, as it heads toward this historically strong 32-day stretch. That combination of a soft year-to-date tape and a perfect win record in this specific autumn window is why many traders are watching the calendar as closely as the chart.
Because this pattern is grouped by the presidential election cycle, it only looks at midterm election years, which tend to feature heavier policy noise and more cautious corporate spending before the pre-election year often brings a friendlier risk backdrop. For a communications and advertising group like Omnicom, that timing lines up with when brands typically lock in fourth-quarter campaigns and start sketching budgets for the pre-election year, a period that has historically seen stronger equity markets and more aggressive marketing spend.
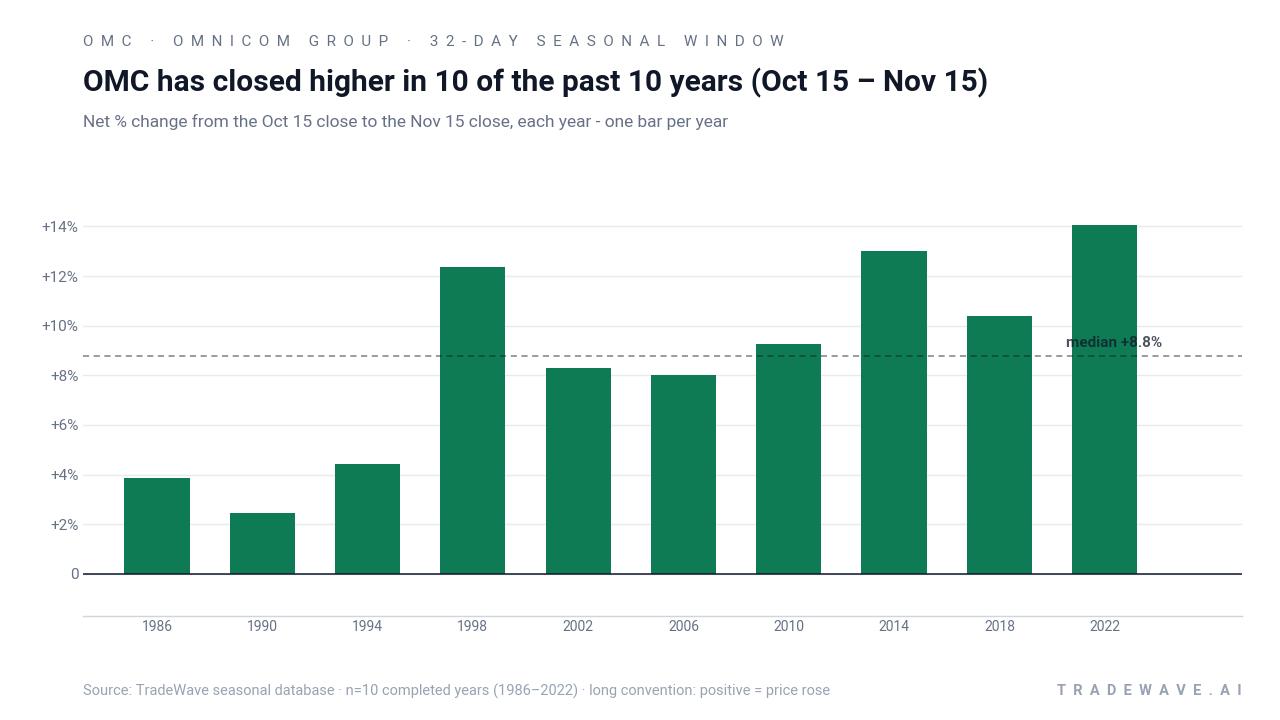
Across the 10 completed midterm-year samples from 1986 through 2022, the trade direction for this window is long, and every year finished positive on a close-to-close basis. The median gain of 8.79% sits close to the 8.61% average, which suggests the wins have been relatively clustered rather than driven by a single outlier year. Even the softer outcomes, such as 1986’s 3.85% rise and 1990’s 2.47% gain, still ended in the green.
The strongest years in this Omnicom Group trading window came in 2014 and 2022, when the stock rallied 13.0% and 14.04% respectively between Oct 15 and Nov 15. In both cases, the maximum favorable move inside the window ran slightly ahead of the final result, with peak run-ups of 13.32% in 2014 and 15.46% in 2022 before modest giveback into the close. That is typical of this pattern: rallies have tended to build early and then consolidate rather than reverse outright.
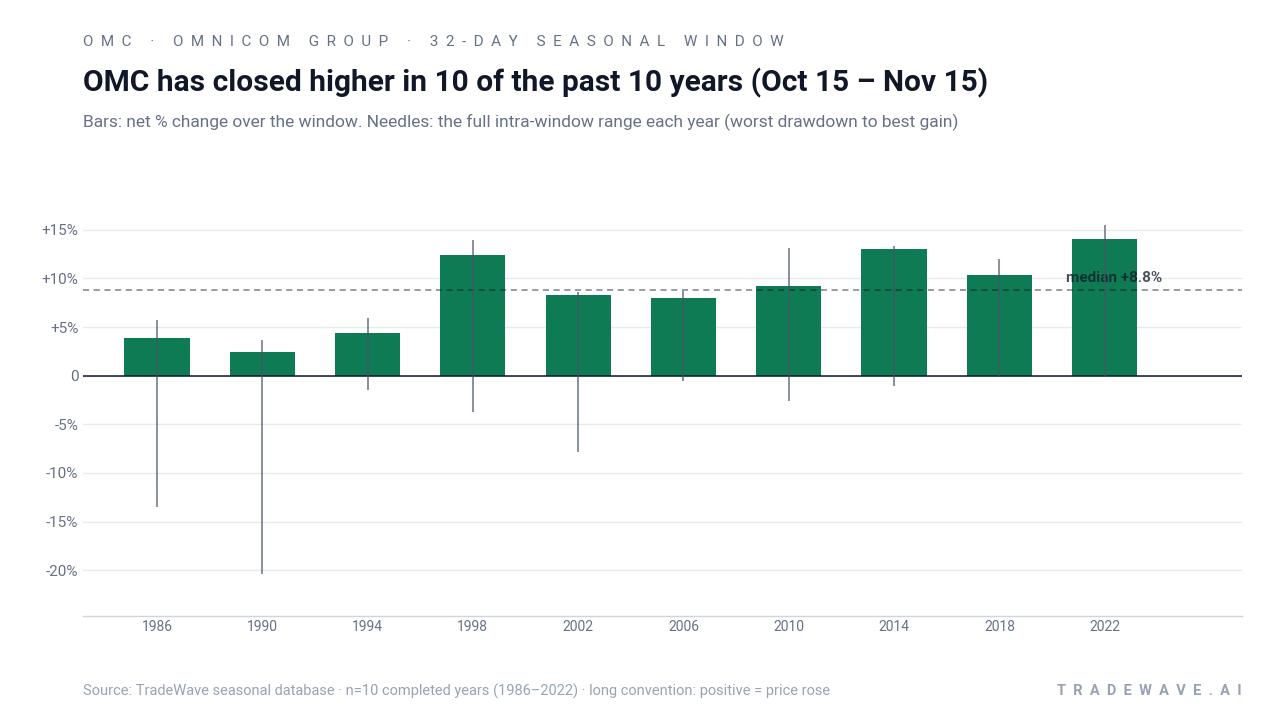
Intraperiod downside has still mattered. In 1990, Omnicom’s worst drawdown from the Oct 15 entry point reached 20.37% before the stock clawed back to finish the window up 2.47%. In 1986, the worst adverse move was 13.46% even though the period ended with a 3.85% gain. More recent cycles have been kinder, with several years such as 2014, 2018 and 2022 showing maximum drawdowns of roughly 1% or less, but the historical range shows that this has not always been a smooth ride.
A second view shows how each year’s best and worst swings stack up around those net gains.
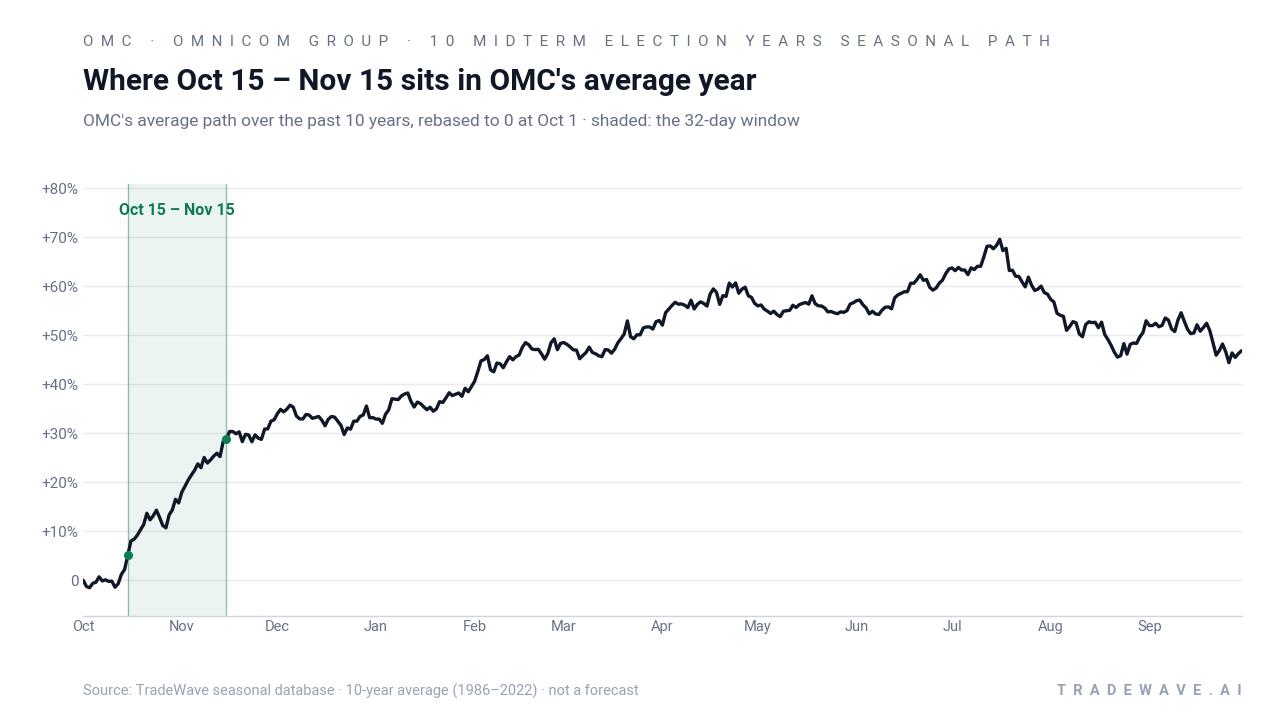
Stacking the 32-day window year after year compounds to a cumulative gain of 127.04%, which is a striking result for such a short slice of the calendar. Add it up: ten midterm-year autumn windows, all positive, with a Sharpe ratio of 2.06 and a TradeWave Ratio of 2.39 that points to meaningful travel in the trade direction inside the window. The pattern is clear here: this has been a consistently bullish seasonal window for long exposure to Omnicom Group in midterm election years.
History does not guarantee future results; adverse excursions can still be large inside this window even when the final outcome has been positive.
Why does Omnicom Group (OMC) follow this seasonal pattern?
One likely driver is the clustering of Omnicom’s earnings and client budget decisions around late October, when advertisers finalize year-end campaigns and start planning for the pre-election year. Analysts have also pointed to institutional portfolio repositioning in the concluding midterm election year, as investors rotate toward communications and media names that can benefit from improving risk appetite into the pre-election phase.[3] This pattern may also reflect sector rotation within the S&P 500 as investors lean into cyclical and marketing-sensitive stocks once midyear policy uncertainty begins to fade.[5]
What is driving Omnicom Group (OMC) today?
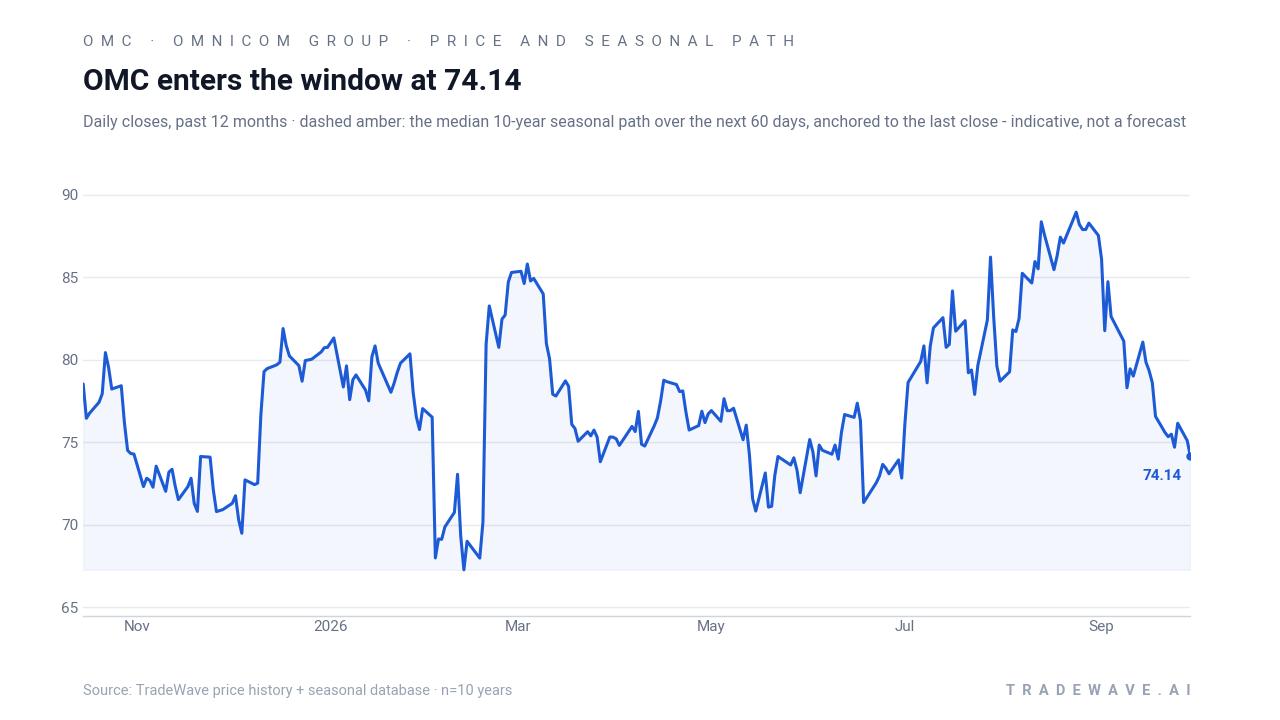
Omnicom Group ended Thursday’s session at 73.63, down 0.51 points or 0.7%, leaving the stock about 17.8% below its 52-week high of 89.56 and modestly above its 52-week low of 66.33. The shares are off 8.3% year-to-date, lagging the broader market as investors digest a mixed second-quarter print and look ahead to the next earnings report on Oct 20, where Zacks expects roughly $2.68 in EPS for the September quarter.[3][7]
On Jul 28, Omnicom reported June-quarter revenue of $6.56 billion, ahead of the $6.44 billion consensus, while EPS of $2.65 missed estimates by $0.02; revenue jumped 63.4% year-over-year, underscoring how acquisitive growth and client spend have been supporting the top line even as margins face pressure.[3] Since then, the stock has slid from the high 80s into the low 70s, with the 50-day moving average now up at 82.12 and 20-day average volume around 3.41 million shares, a setup that leaves plenty of room for mean reversion if sentiment improves.
Analysts tracked by MarketBeat carry a consensus Hold rating on Omnicom Group, with an average price target near $99 that sits well above the current quote and reflects a more constructive stance than the stock’s recent performance might suggest.[2][4][5] Zacks Research upgraded the name to Hold in late September, citing solid fundamentals despite the near-term earnings miss and a still-healthy pipeline of client activity across key advertising and media segments.[6]
Positioning and insider activity add nuance. MarketBeat data shows short interest at roughly 9.86% of float as of mid-September, after a 5.3% month-over-month increase in August 2025, which leaves a meaningful cohort of investors betting against the stock.[8] On Aug 24, director Linda Johnson Rice sold 1,385 shares at $88.73, a small transaction in the context of Omnicom’s market value but one that fits with a broader pattern of modest insider selling this year.[10][11]
The chart below situates the latest move in its recent multi-month context and overlays the historical seasonal path into the upcoming window.
What should traders watch as the Oct 15 window opens?
First, the calendar: the 32-day Omnicom Group trading window begins on Oct 15 and runs through mid-November, overlapping the company’s Oct 20 earnings date and the final stretch of the concluding midterm election year.[3] Historically, this has been a bullish slice of the calendar for OMC, but the path has not always been smooth, so how the stock behaves around earnings will be an early tell on whether the pattern is tracking or breaking.
Second, levels. The 50-day moving average near 82.12 and the 52-week high at 89.56 are the obvious upside reference points if the stock starts to follow its historical seasonality higher. On the downside, the 66.33 52-week low and the mid-60s zone more broadly mark the area where prior cycles have seen their worst intraperiod drawdowns before recovering, based on the historical maximum adverse moves inside this window.
Third, positioning and sentiment. With short interest close to 10% of float, any upside surprise on earnings or guidance could force covering into a seasonally strong period, amplifying moves relative to a typical month.[8] Traders will be watching whether that short-interest build stabilizes or reverses as the window progresses, and whether insider activity remains muted after the August sale by director Linda Johnson Rice.[10][11]
Finally, the macro and policy backdrop matters. As the midterm election year wraps up and markets look toward the pre-election year, investors will be gauging how corporate ad budgets respond to any shifts in fiscal stance, regulation or growth expectations. If Omnicom’s stock can hold above recent lows and build higher highs inside the Oct 15–Nov 15 window, it would fit the historical pattern of strength; a failure to respond, especially after earnings, would be an early sign that this cycle may diverge from the past.
Sources
- Yahoo Finance - Omnicom Group Inc. (OMC) Analyst Ratings, Estimates & Forecasts - Yahoo Finance
- MarketBeat - Omnicom Group (NYSE:OMC) Trading Down 5.1%
- MarketBeat - Omnicom Group Inc. (NYSE:OMC) Stock Rated "Hold" by Sell-Side Analysts
- MarketBeat - National Pension Service Has $31.68 Million Position in Omnicom Group Inc. $OMC
- MarketBeat - Omnicom Group (OMC) Stock Price, News & Analysis
- MarketBeat - Omnicom Group (NYSE:OMC) Upgraded to Hold at Zacks Research
- Zacks - What date does Omnicom Group's (OMC) report Earnings - Earnings Calendar & Announcement
- MarketBeat - Omnicom Group (OMC) Short Interest & Short Float | Updated Sep 2026
- Yahoo Finance - Omnicom Group Inc. (OMC) Recent Insider Transactions - Yahoo Finance
- MarketBeat - Omnicom Group (OMC) Insider Trading Activity 2026
- MarketBeat - Envestnet Asset Management Inc. Cuts Holdings in Omnicom Group Inc. $OMC
About this seasonal analysis
Seasonal pattern data is sourced from TradeWave.ai, which analyzes historical price behavior across annual calendar windows going back up to 30 years. Read the full data methodology or the book The 100-Year Pattern by Afshin Moshrefi (2026 edition). Past performance of seasonal patterns does not guarantee future results. This article is for informational purposes only and does not constitute investment advice.