FactSet (FDS) EPS Beat and Higher 2027 Guidance Align With Bullish Late-Fall Run
FactSet is heading into a late‑October trading window that has quietly delivered gains every year for a decade, just as the stock rebounds from a pullback and sits well below its 52-week high.
Price as of Oct 1, 2026: $277.61 (last close).

What is the seasonal pattern for FactSet (FDS)?
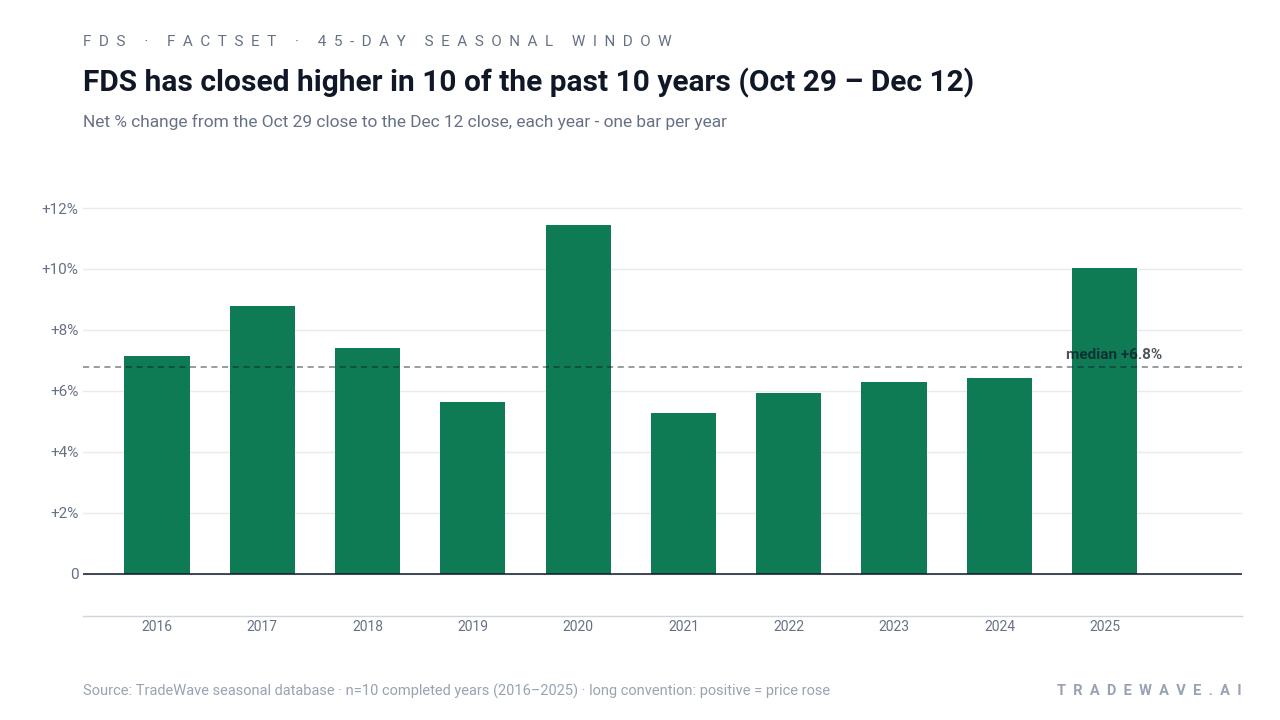
FactSet has risen in 10 of 10 years during the Oct 29 to Dec 12 window, with an average gain of 7.44% in winning years.
- 10 for 10 in this window, averaging 7.44% gains in winning years across the past decade.
- The upcoming 45-day FactSet trading window runs from Oct 29 to Dec 12 and has shown a consistently bullish seasonal trend.
- Percent Profitable is 100.0%, with 10 winners and 0 losers over the 10-year lookback.
- Median gain across those years is 6.78%, with cumulative returns of 104.57% when the window is stacked year after year.
- The TradeWave Ratio of 3.57 suggests price has typically traveled meaningfully in the long direction within the window, while the Sharpe ratio of 3.44 points to unusually strong risk-adjusted results.
- Intraperiod drawdowns have occurred in several years, but every completed window since 2016 has still finished in positive territory.
According to historical data from TradeWave.ai, this late‑October stretch has behaved very differently from an average month for FactSet, and the next iteration is less than four weeks away.
How has FactSet (FDS) traded in the late‑October seasonal window?
FactSet has booked gains in 10 of 10 years during the Oct 29 to Dec 12 window, averaging a 7.44% rise across those late‑fall stretches. Today the stock closed at $277.61, up 2.8% on the session and about 13.4% below its 52-week high of $320.48, leaving room above if the historical pattern repeats.
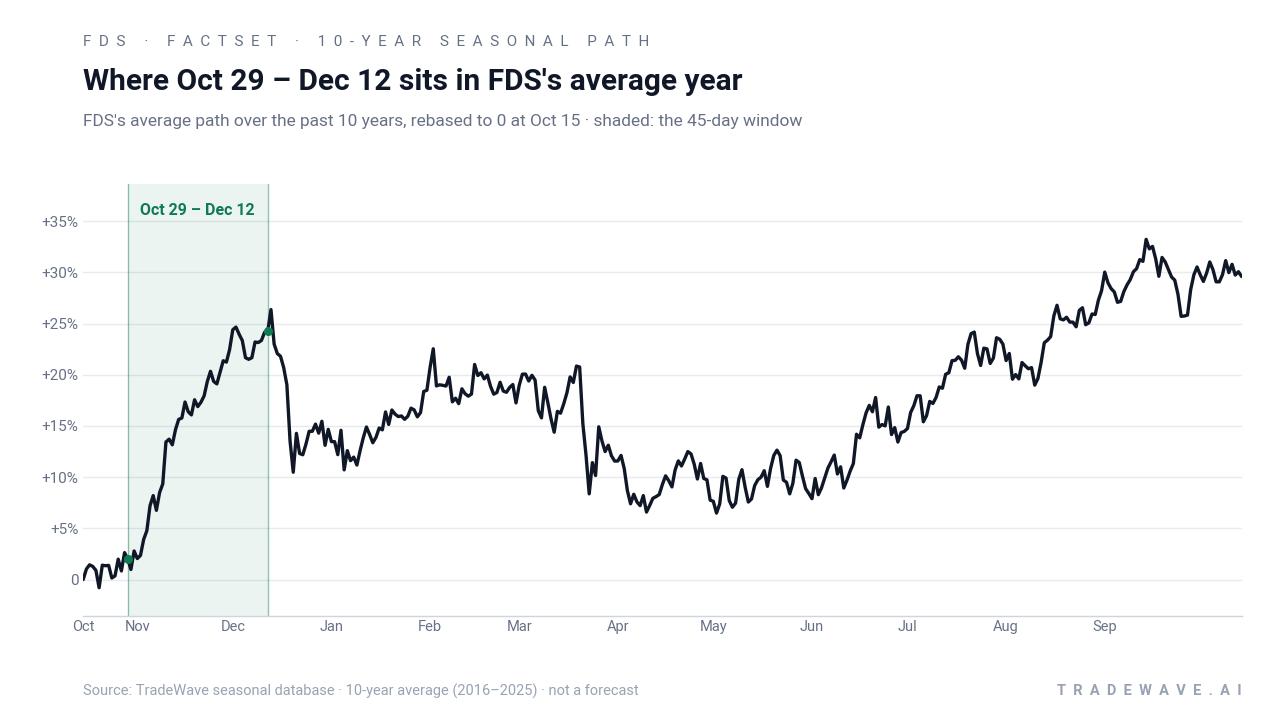
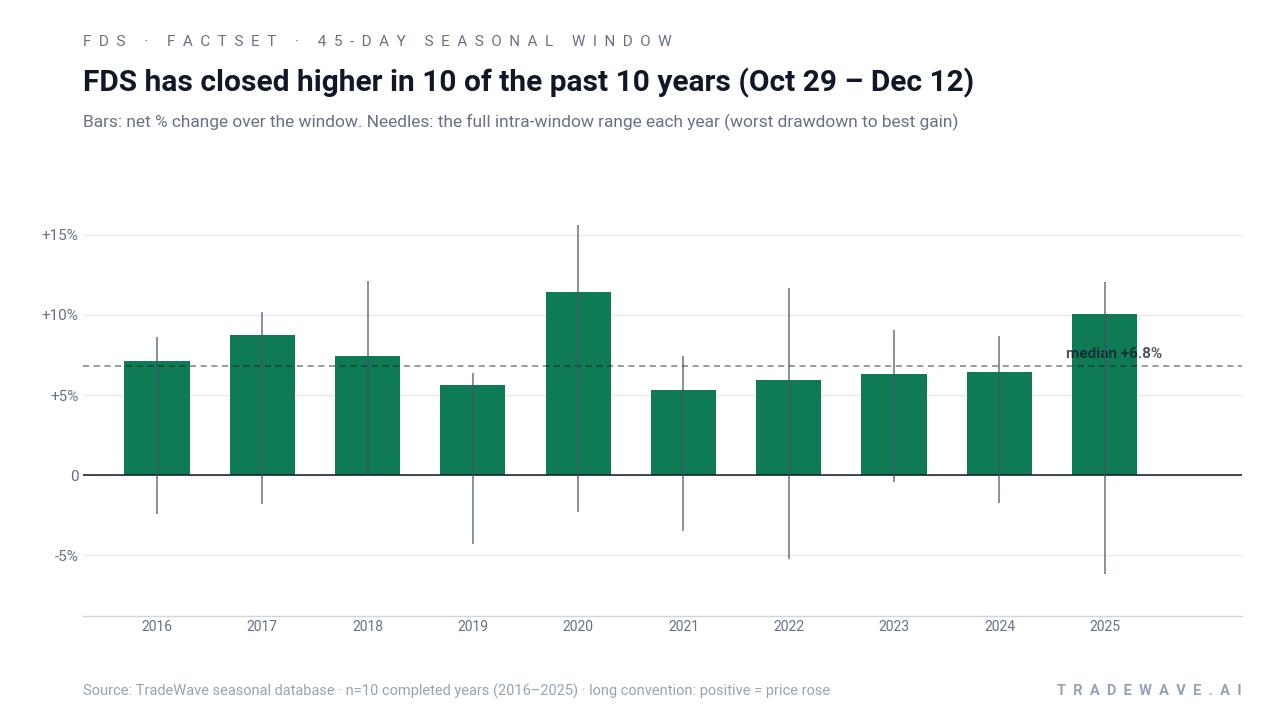
Year-by-year ranges show how much the stock has tended to swing inside the window before finishing higher.
The historical record is clean: 10 winners, 0 losers, and a 100.0% hit rate for a long bias in this slice of the calendar. Average gains of 7.44% and a median of 6.78% suggest the typical year has delivered a mid‑single‑digit to high‑single‑digit lift, with stronger years such as 2020 and 2025 posting double‑digit advances. The annualized return of 7.42% and a Sharpe ratio of 3.44 indicate that, on a risk‑adjusted basis, this window has been unusually efficient compared with many short‑term stock patterns.
Intraperiod behavior has not been a straight line. In 2025, for example, FactSet gained 10.02% from entry to exit, but the worst drawdown from the starting price reached 6.14% before the stock recovered, illustrating how the maximum adverse move can be uncomfortable even in a winning year. By contrast, 2018 saw a 7.42% net gain with no recorded adverse excursion from the entry, while the best intraperiod rally reached 12.1%, showing that some years have offered relatively smooth upside. Across the sample, maximum favorable moves have often run into the high single digits or low double digits, while maximum adverse moves have typically stayed in the low‑ to mid‑single‑digit range.
The cumulative chart of this late‑October window compounds to a 104.57% total gain over the decade, meaning that simply repeating the same 45‑day exposure each year would have more than doubled capital tied to this pattern. That steady climb, without a single losing year, is what makes the FDS seasonal trend stand out inside the financial data and analytics sector. The pattern is clear: this window has favored longs in 10 of 10 years, with consistent upside and manageable, though sometimes sharp, drawdowns.
History does not guarantee future results; adverse excursions (MAE) can be large even in winning windows.
Why does FactSet (FDS) follow this seasonal pattern?
One likely driver is FactSet’s fiscal calendar, with late‑October often sitting between major earnings updates and year‑end guidance resets, a period when investors digest numbers and reposition into the new fiscal year.[1] Analysts have also pointed to recurring institutional portfolio rebalancing in financials and information services into year‑end, which can favor steady, cash‑generative data providers like FactSet.[5] The pattern may also reflect a broader risk‑on tilt for technology‑adjacent financial analytics stocks as investors lean into secular themes such as AI and workflow automation heading into a new year.[5]
What is driving FactSet (FDS) today?
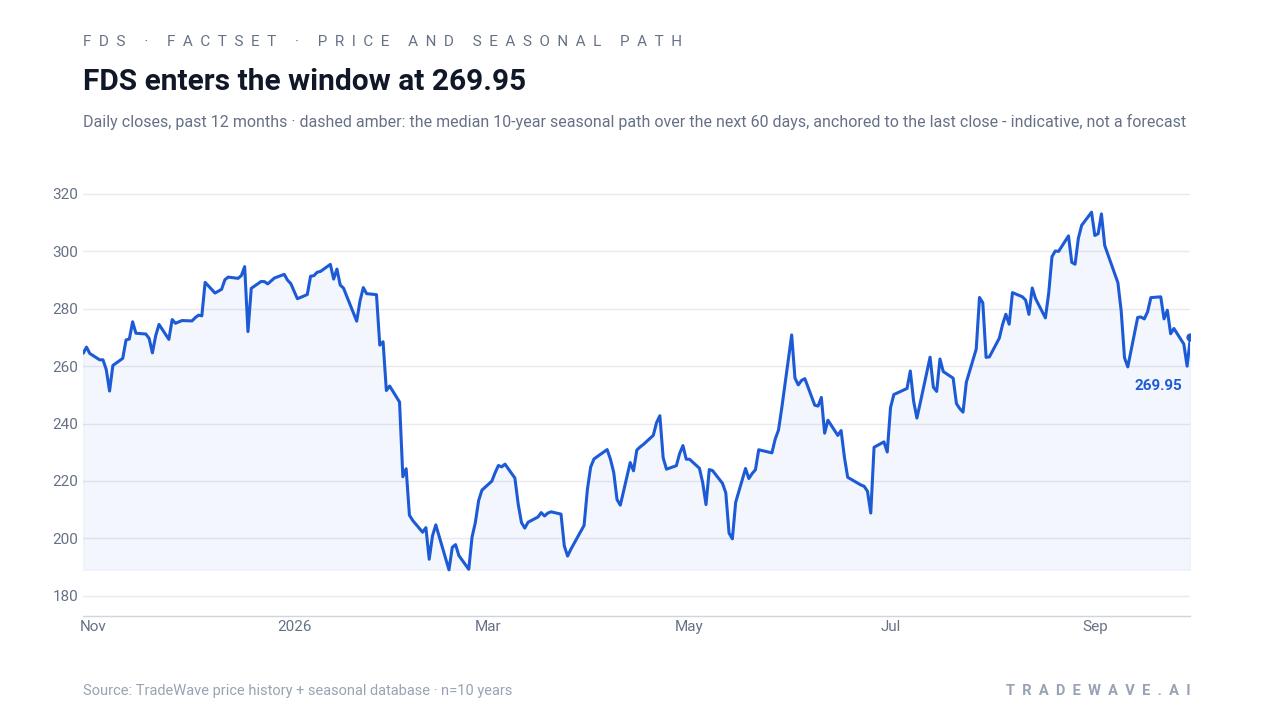
FactSet shares closed Friday at $277.61, up 2.8% on the day, after a sharp rebound from recent lows that still leaves the stock about 13.4% below its 52-week high of $320.48 and well above its 52-week low near $185.[7] The move extends a post‑earnings bounce that followed the company’s Sep 30 report, where FactSet delivered adjusted EPS of $4.52 on revenue of $634.7 million, topping consensus estimates on both lines and growing revenue 6.3% year over year.[1] Management also raised its FY2027 EPS outlook to a range of $19.250 to $19.650, signaling confidence in margin expansion and ongoing demand for its analytics platform.[2]
The earnings beat and guidance upgrade came against a cautious backdrop on the Street. MarketBeat’s aggregation still shows a “Reduce” consensus rating on FDS, with a blended price target around $266.36 that now sits below the current share price and reflects a more conservative stance from several brokers.[2] At the same time, some firms have been nudging targets higher following the quarter, with recent notes highlighting FactSet’s ability to grow organic annual subscription value at roughly 7% in fiscal 2026 and management’s expectation for 5% to 6.5% ASV growth in FY2027 as AI‑driven products gain traction.[3][5] That mix of cautious ratings and improving fundamentals has left FDS trading in a middle zone: not a high‑flyer, but no longer priced as a deep value play either.
On the positioning side, short interest remains a modest but non‑trivial factor. MarketBeat data shows 3,628,551 shares sold short as of Sep 15, 2026, with a detailed month‑by‑month history that points to incremental covering over recent reporting periods rather than an aggressive build‑up.[8] That backdrop can matter into a strong seasonal window, because even a modest short base can add fuel if buyers lean into a pattern that has historically favored the long side. For now, though, the bigger story is fundamental: FactSet continues to pitch itself as a must‑have data and analytics provider to investment professionals, a niche that has proven resilient through multiple market cycles.[9]
The chart below situates the latest move in its recent multi‑month context and overlays the median seasonal path for the next two months.
What should traders watch in the upcoming FactSet (FDS) window?
The next key date on the calendar is Oct 29, when the 45‑day seasonal window opens and runs through Dec 12. Traders will be watching whether FDS can hold above the recent low near $270 and build a base ahead of that date, or whether profit‑taking pulls the stock back toward its 50‑day moving average around $281.52, which currently sits just above spot.[7] A firm tone into late October would align with the historical pattern of steady late‑year strength, while a break back toward the mid‑$250s would mark a clear departure from the typical setup.
Earnings will also loom large. FactSet’s next scheduled report is on Dec 17 for its fiscal fourth quarter of 2026, landing just after the seasonal window closes.[2] That timing means much of the 45‑day stretch will be about positioning ahead of the print rather than reacting to it. If the stock grinds higher into the event, it would echo prior years in which investors used the late‑fall period to accumulate exposure ahead of fresh guidance. A flat or choppy tape, by contrast, would suggest that the Street’s “Reduce” stance is weighing more heavily than usual on the FDS seasonal trend.
On the risk side, traders should keep an eye on intraperiod swings. Past windows have seen maximum adverse moves of 4% to 6% in some years before the stock ultimately finished higher, so a mid‑single‑digit drawdown inside the window would not be unusual in historical terms. Behavior around those dips will be telling: quick reversals back toward the highs would fit the established pattern, while sustained weakness or a decisive break below recent support would mark a clear deviation from the 10‑for‑10 record.
Put together, the checklist for this late‑October FactSet trading window is straightforward: watch how the stock trades around the $270 to $285 band into the start date, track whether buyers step in on any 4% to 6% pullbacks during the window, and see if the tape leans bullish into the Dec 17 earnings report. If FDS respects support and grinds higher through mid‑December, it would extend one of the cleaner late‑year seasonal patterns in the financial data and analytics space. A failure to do so would be the first real break in a decade‑long trend.
Sources
- MarketBeat - FactSet Research Systems (NYSE:FDS) Posts Quarterly Earnings Results, Beats Expectations By $0.17 EPS
- MarketBeat - FactSet Research Systems (NYSE:FDS) Releases FY 2027 Earnings Guidance
- MarketBeat - Wells Fargo & Company Issues Positive Forecast for FactSet Research Systems (NYSE:FDS) Stock Price
- The Wall Street Journal (Dow Jones) - FactSet Research Systems Inc. (FDS) Stock Price Today - The Wall Street Journal
- MarketBeat - FactSet Research Systems (NYSE:FDS) Given New $292.00 Price Target at Stifel Nicolaus
- Zacks - FactSet Research (FDS) Tops Q4 Earnings and Revenue Estimates - September 30, 2026 - Zacks.com
- Finviz - FDS - Factset Research Systems Inc Short Interest
- MarketBeat - FactSet Research Systems (FDS) Short Interest & Short Float | Updated Sep 2026
- MarketBeat - FactSet Research Systems (FDS) Stock Price, News & Analysis
About this seasonal analysis
Seasonal pattern data is sourced from TradeWave.ai, which analyzes historical price behavior across annual calendar windows going back up to 30 years. Read the full data methodology or the book The 100-Year Pattern by Afshin Moshrefi (2026 edition). Past performance of seasonal patterns does not guarantee future results. This article is for informational purposes only and does not constitute investment advice.