10-for-10: Merck & Co. (MRK) Has Never Finished This 200-Day Midterm Window in the Red
Merck & Co. is about to enter a 200-day midterm-election-year seasonal window that has never been negative in the last 10 cycles, even as the stock trades modestly below its 52-week high.

What is the seasonal pattern for Merck & Co. (MRK)?
Merck & Co. has risen in 10 of 10 midterm-election-year windows starting around Jun 22, with an average gain of 18.86% in winning years.
- 10 for 10 in this window, with average winning-year gains of 18.86% across the last 10 midterm election years.
- The upcoming 200-day window begins Jun 22 and has historically favored long positions in Merck & Co. shares.
- Percent Profitable is 100%, with 10 winners and 0 losers across the lookback sample.
- Median outcome is a 22.28% gain, pointing to a skew toward stronger upside years rather than small moves.
- The TradeWave Ratio of 2.05 suggests price has typically traveled meaningfully in the trade direction within the window, not just drifted higher.
- Intraperiod swings have included adverse moves as deep as about 22% in some years, so the path has not been a straight line up.
According to historical data from TradeWave.ai, this midterm-election-year stretch has behaved very differently from an average calendar period for Merck & Co., and the next iteration is about to open.
How has Merck & Co. (MRK) traded in past midterm-year windows starting in late June?
Merck & Co. has risen in all 10 of the last midterm-election-year windows that start around Jun 22 and run for 200 trading days, averaging an 18.86% gain per cycle. Today the stock closed at $113.87, down 1.36% on the session, leaving it about 6.8% below its 52-week high of $122.24 and up 5.6% year to date.
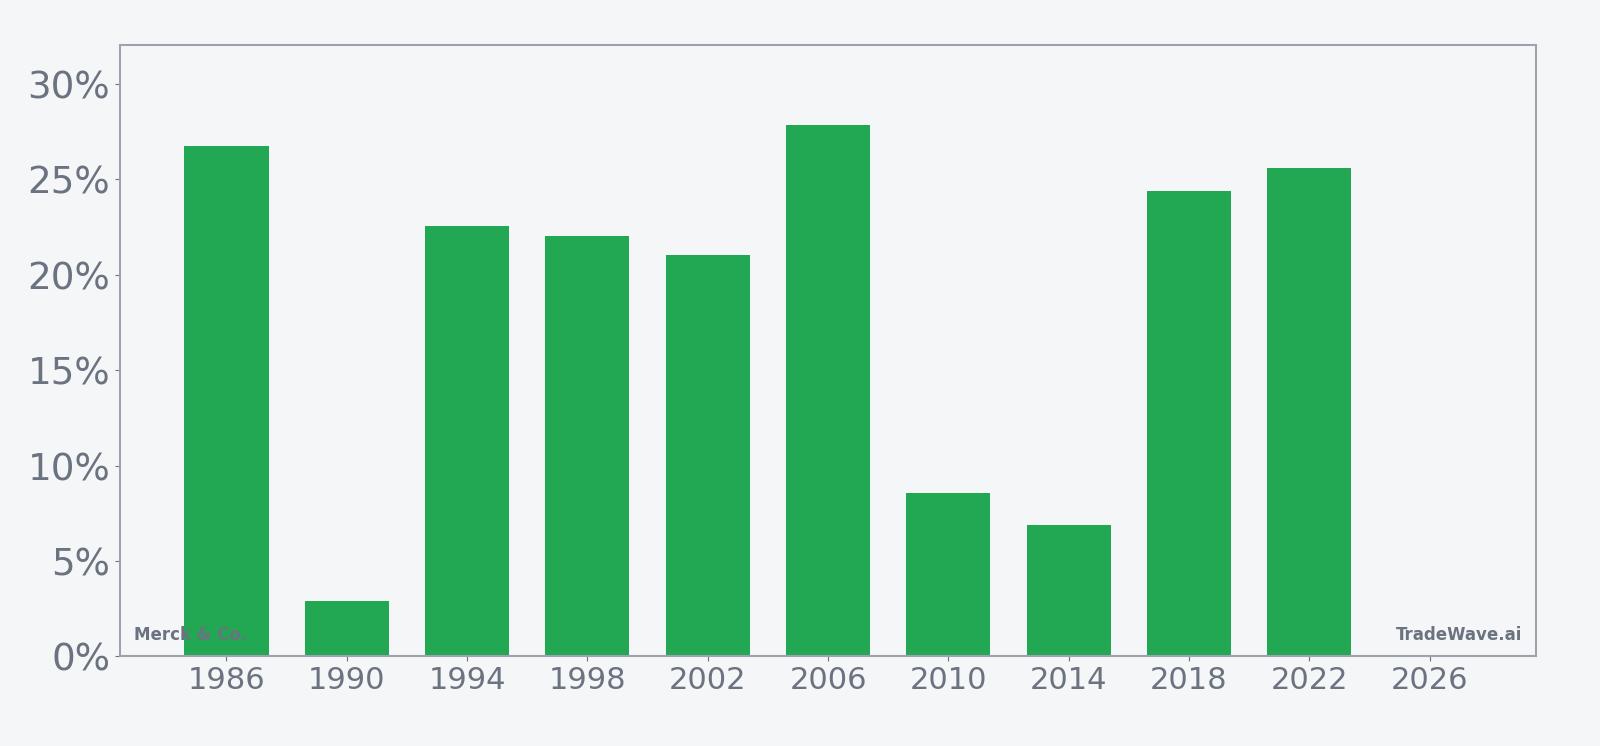
Because this pattern is grouped by the presidential election cycle, it only looks at midterm election years, which often feature shifting policy expectations, drug-pricing debates and portfolio repositioning ahead of the stronger pre-election year. For a large healthcare name like Merck & Co., that means this window captures how investors have historically treated the stock as Washington’s agenda evolves mid-cycle.
Across those 10 midterm-year samples, the long trade direction has been consistently rewarded. Percent Profitable sits at 100%, with 10 winners and 0 losers, and the median outcome is a 22.28% gain, which is higher than the average and signals that several cycles delivered outsized upside rather than a few outliers carrying the series.
The average profit of 18.86% reflects the mean net return from entry to exit across all 10 windows, since there were no losing years to dilute the result. The annualized return of 18.54% and a Sharpe ratio of 1.83 indicate that, on an end-of-window basis, this has been a relatively strong risk-adjusted stretch for long exposure in MRK compared with a typical year.
Intraperiod behavior has not been smooth, though. Maximum favorable excursions, or the best point-to-peak moves within each window, have ranged from 7.1% in 2014 to more than 32% in 2006, showing that in strong years the stock has often pushed well beyond the final close before consolidating. Maximum adverse excursions, the worst drawdowns from entry, have been as shallow as about 1.82% in 2006 but as deep as roughly 22.22% in 2002, underscoring that even winning windows have contained meaningful pullbacks.
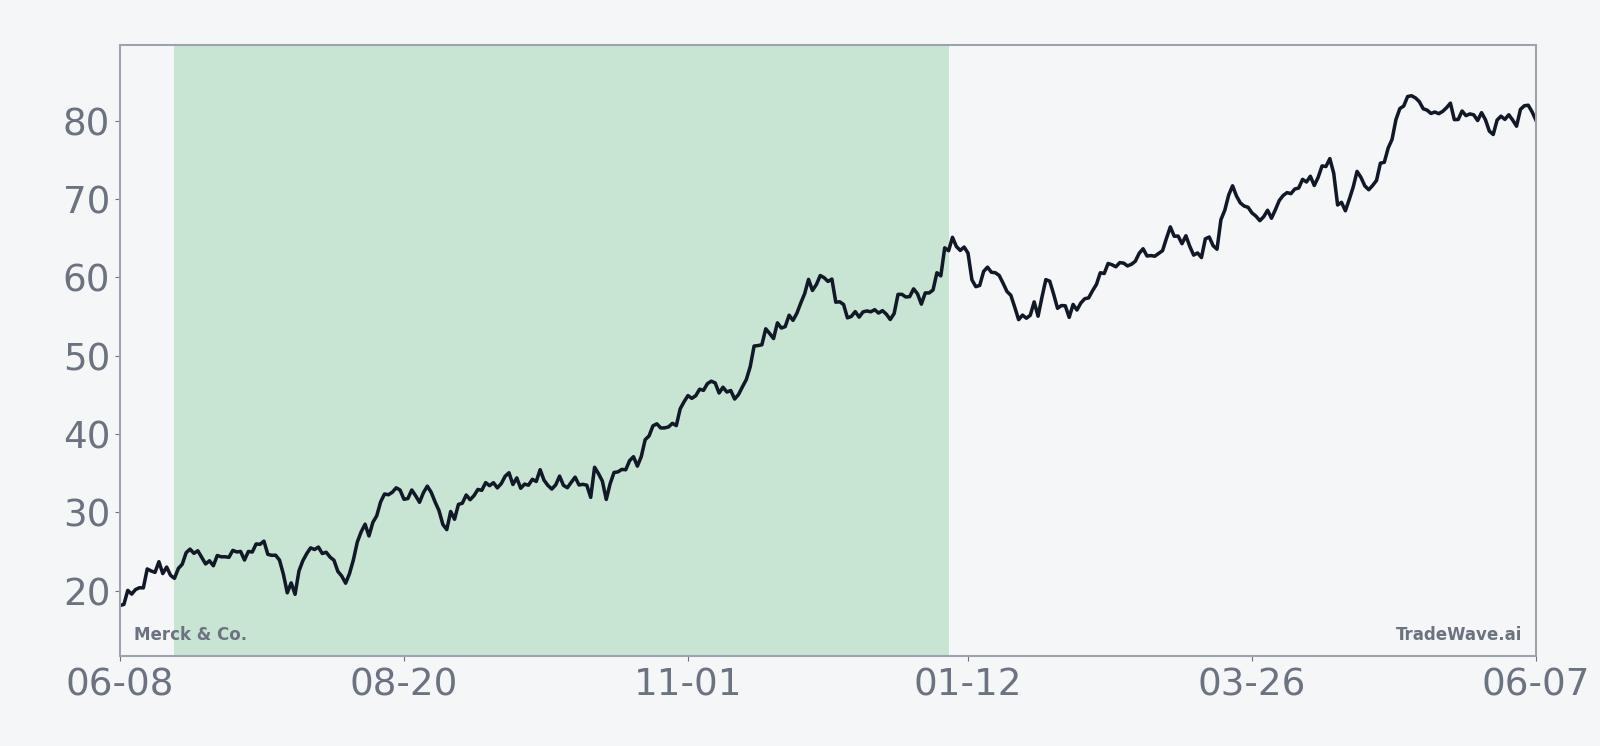
The historical seasonal average trend for this window slopes higher for most of the 200 trading days, with only modest pauses, suggesting that gains have tended to accrue steadily rather than arriving in a single burst. The cumulative return profile, with a 447% total gain across the 10-sample history, points to a pattern where repeated midterm-year windows have stacked into a sizable long-run contribution for MRK holders.
Year-by-year bars that combine net results with peak run-ups and worst drawdowns show how much room MRK has historically had to move inside this window.
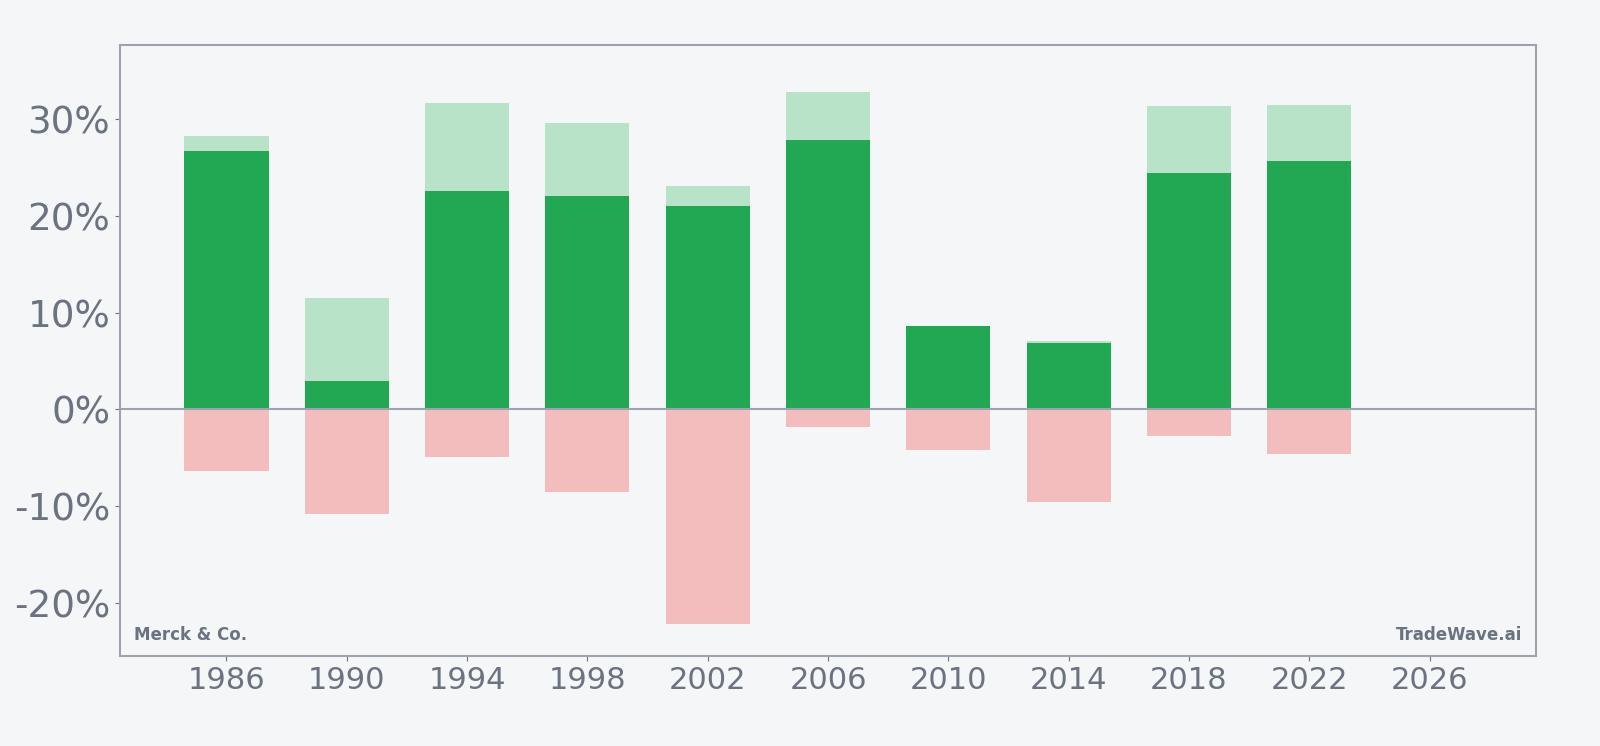
Those bars show that in years like 1994, 1998, 2006, 2018 and 2022, Merck & Co. not only finished the window with gains above 20% but also saw peak run-ups above 29%, while the worst drawdowns stayed in single digits. By contrast, 2002 combined a solid 21.06% net gain with a roughly 22.22% worst drawdown, a reminder that even historically strong seasonal windows can involve sharp interim selloffs before recovering.
History does not guarantee future results, and adverse excursions can be large even in windows where every historical sample finished positive.
Add it up: 10 for 10, nearly 19% average gains and a long-only profile that has rewarded patience across midterm election years. That is the seasonal record this 200-day window carries into the next cycle.
Why does Merck & Co. (MRK) follow this seasonal pattern?
One likely driver is the way healthcare and drug-pricing policy tends to heat up in midterm election years, prompting institutional investors to reposition around large pharmaceutical names as the policy path becomes clearer. Analysts have also pointed to the clustering of major oncology and vaccine data releases, plus year-end portfolio rebalancing, which can funnel flows into defensive growth stocks like Merck & Co. as the market transitions from the midterm year into the historically stronger pre-election year. This pattern may reflect that combination of policy clarity, sector rotation and earnings visibility rather than any single catalyst.
What is driving Merck & Co. (MRK) today?
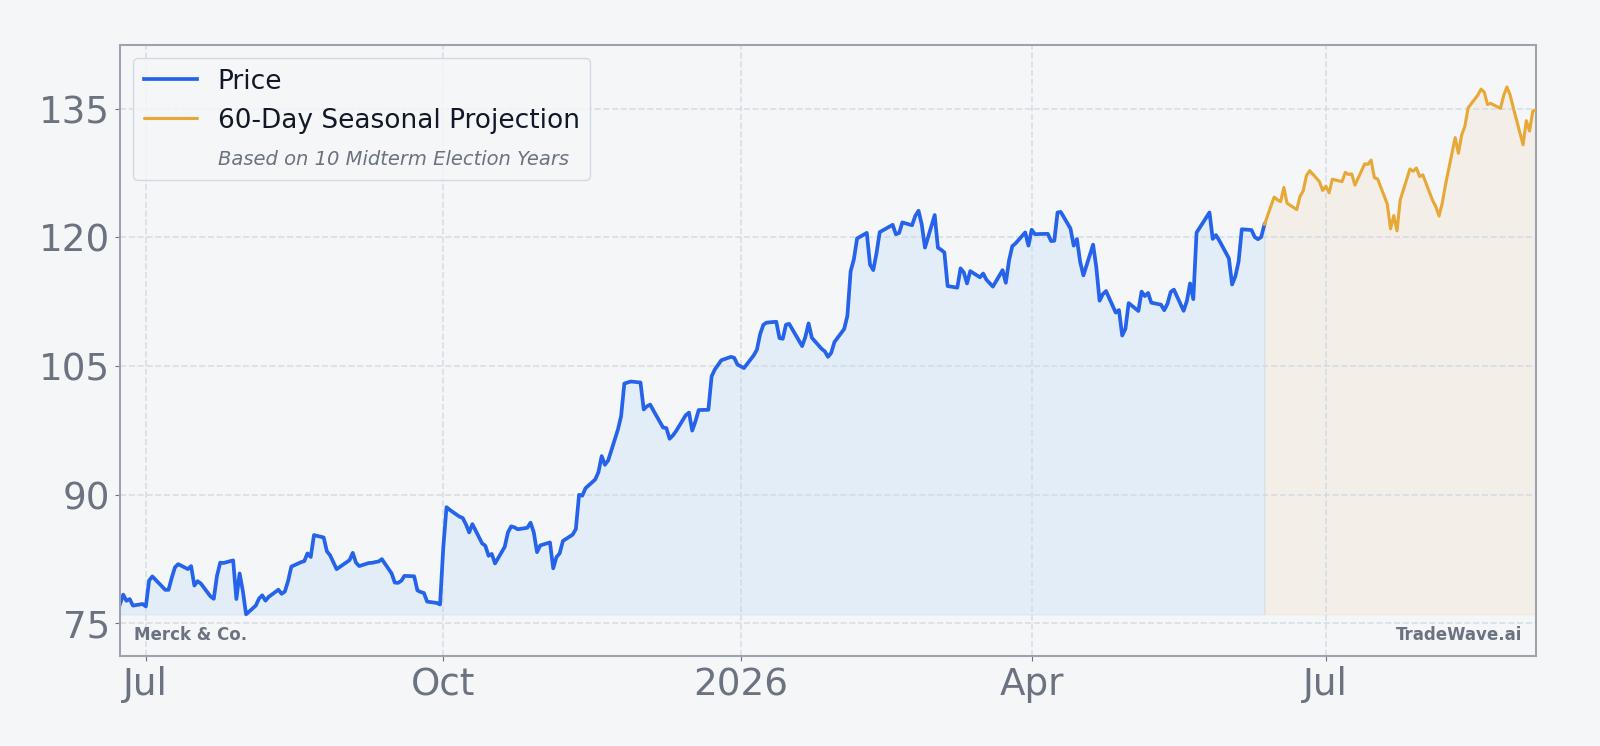
Merck & Co. shares slipped 1.36% to $113.87 on Friday, leaving the stock up 5.6% so far in 2026 and about 6.8% below its 52-week high of $122.24. Trading volume of roughly 29.5 million shares ran well above the recent 20-day average of about 12.3 million, suggesting active positioning ahead of the upcoming seasonal window and as investors weigh Merck’s longer-term revenue ambitions and oncology strategy in the face of looming Keytruda patent expiries.[3]
In January 2026, Merck outlined a plan to generate $70 billion in revenue from new growth drivers by the mid-2030s, with cardiometabolic, respiratory and infectious disease franchises expected to contribute more than previously forecast.[3] That medium-term target sits alongside a broader sector push to diversify beyond flagship oncology drugs, and for Merck it has been paired with deal-making and pipeline work aimed at reinforcing its cancer portfolio ahead of Keytruda’s loss of exclusivity.[12]
In March 2026, Reuters reported that Merck was nearing a roughly $6 billion all-cash acquisition of Terns Pharma to bolster its oncology lineup, following earlier moves such as the Verona Pharma deal that helped drive Winrevair sales higher.[12] Those transactions fit into a multi-year effort to build a dedicated cancer division around Keytruda while adding new mechanisms and indications that can sustain growth even as competitive and regulatory pressures build.[1]
Back in October 2025, Merck posted higher third-quarter sales as Keytruda growth offset a drop in Gardasil, with revenue of about $17.28 billion topping estimates and adjusted earnings per share of $2.58 beating consensus.[2] The company narrowed full-year revenue guidance to a range of $64.5 billion to $65.0 billion and projected full-year EPS of $8.93 to $8.98, setting a baseline that investors have been using to judge how much incremental growth the newer pipeline and acquisitions can deliver.[2]
The chart below situates the latest move in its recent multi-month context and overlays a short-term seasonal projection.
What should traders watch as this seasonal window opens?
First, the calendar: the 200-day midterm-year window begins on Jun 22, so price action in the final sessions before that date will set the entry level that future performance is measured against. A strong push back toward the $122 area would mean the pattern starts from near the top of the 12-month range, while continued consolidation around current levels would leave more room above if the historical seasonal trend repeats.
Second, volatility inside the window matters as much as the final outcome. Past cycles have seen intraperiod drawdowns as deep as roughly 22% even when the window finished with a double-digit gain, so traders will be watching whether any early weakness resembles those historical adverse excursions or whether pullbacks remain shallow compared with prior midterm years.
Third, the policy and pipeline calendar will be key. As the midterm election year progresses and the market starts to look toward the pre-election year, any new guidance on drug pricing, reimbursement or oncology trial data could either reinforce or challenge the historical pattern of strength for MRK in this stretch.[3] A steady cadence of positive trial readouts or accretive deal announcements would rhyme with prior strong windows, while regulatory setbacks or disappointing data could be the kind of shocks that historically produced the deeper drawdowns inside otherwise winning periods.[1]
Finally, investors will be tracking how Merck’s execution against its $70 billion new-revenue target lines up with the seasonal backdrop.[3] If management continues to deliver on that plan while the stock behaves in line with its midterm-year seasonal trend, the combination could keep MRK a core defensive growth holding for many portfolios; if the stock diverges sharply from its historical pattern, that will be an early signal that the market is repricing the story rather than simply following the calendar.
Sources
- Forbes, "Why Is Merck Stock Surging?", Nov 26, 2025
- Reuters, "Merck posts higher third-quarter sales as Keytruda growth offsets drop from Gardasil", Oct 30, 2025
- Reuters, "Merck says new growth opportunities to drive revenue of $70 billion by mid-2030s", Jan 13, 2026
- Forbes, "Is Merck Stock’s Run Legitimate?", Dec 24, 2025
- Reuters, "Merck nears $6 billion acquisition of Terns Pharma to boost cancer portfolio, FT reports", Mar 24, 2026
About this seasonal analysis
Seasonal pattern data is sourced from TradeWave.ai, which analyzes historical price behavior across annual calendar windows going back up to 30 years. Read the full data methodology or the book The 100-Year Pattern by Afshin Moshrefi (2026 edition). Past performance of seasonal patterns does not guarantee future results. This article is for informational purposes only and does not constitute investment advice.