199-Day Midterm Window Opens With a Perfect 10-for-10 Record for Merck & Co. (MRK)
Merck & Co. is stepping into a 199-day midterm-election-year seasonal window with a perfect win record, as shares trade modestly above their 50-day average and investors weigh oncology-driven growth against looming patent cliffs.

What is the seasonal pattern for Merck & Co. (MRK)?
Merck & Co. has risen in 10 of 10 midterm-election-year windows starting Jun 23 and lasting 199 trading days, with an average gain of 18.38% in winning years.
- 10 for 10 in this window, averaging 18.38% gains in winning years across the last 10 midterm election cycles.
- Seasonal window runs from Jun 23 for 199 trading days, covering the back half of the midterm year into the early pre-election stretch.
- Percent Profitable is 100%, with 10 winners and 0 losers in the historical sample.
- Median outcome is a 21.4% gain, with cumulative returns across all 10 windows adding up to 425%.
- TradeWave Ratio of 1.99 and Sharpe ratio of 1.75 point to strong upside travel in the trade direction with favorable risk-adjusted returns.
- Individual years have still seen meaningful drawdowns inside the window, with adverse moves as deep as about 22% before finishing higher.
According to historical data from TradeWave.ai, this specific midterm-election-year stretch has behaved very differently from an average calendar period for Merck & Co., and the next iteration begins today.
How strong is this midterm-year seasonal window for Merck & Co. (MRK)?
Merck & Co. has posted gains in all 10 of the last midterm-election-year windows that start on Jun 23 and run for 199 trading days, averaging an 18.38% advance with a 21.4% median outcome. Shares closed Monday at $115.48, up 1.4% on the day and about 1.2% above their 50-day moving average of $114.06, with the stock up 5.6% year to date. That combination of a clean seasonal track record and a stock sitting near trend rather than at extremes gives this window unusual weight for traders watching the MRK seasonal trend.
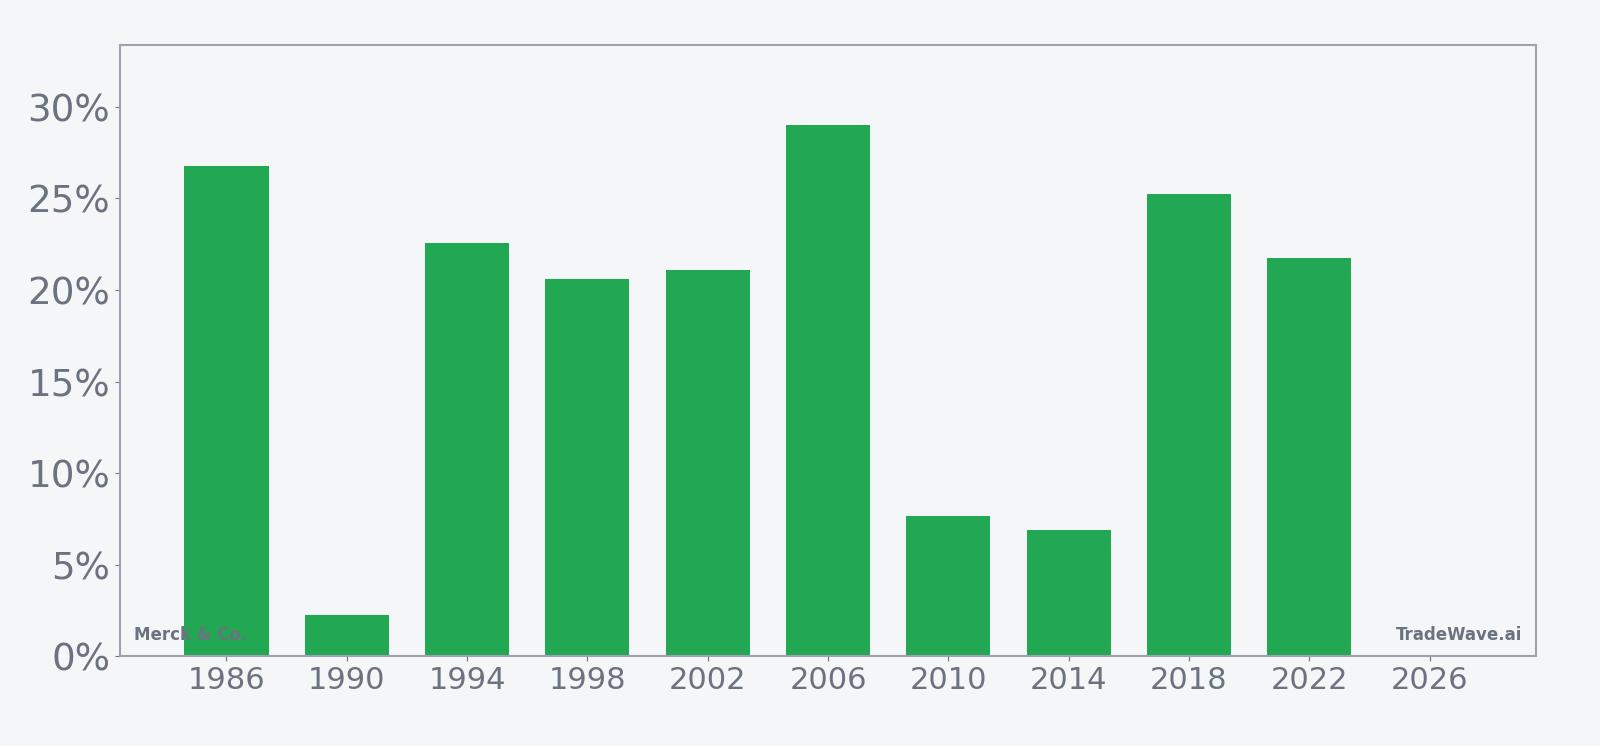
Grouping the data by the presidential election cycle matters here because this window sits in the back half of the midterm election year, a phase that often sees policy uncertainty start to fade and risk appetite rebuild ahead of the pre-election year. For a defensive growth name like Merck & Co., that has historically meant investors rotate back into large-cap pharma as they position for the next leg of the cycle.
Across the 10 midterm-election-year samples, the strongest net gain came in 2006, when the stock rose 29.02% over the window, while the softest outcome was 2.28% in 1990. Even that weakest year still finished positive, which is why the Percent Profitable metric sits at 100% with 10 winners and 0 losers. Add it up and the cumulative return across all 10 windows is 425%, a powerful statement about how this specific Merck & Co. trading window has behaved historically.
The average winner gain of 18.38% and median gain of 21.4% show that the typical outcome has not been a marginal drift higher but a meaningful move. The Sharpe ratio of 1.75 indicates those returns have come with favorable risk-adjusted characteristics when you look only at end-of-window results. For traders focused on the MRK seasonal trend, that combination of consistency and magnitude is rare in a single stock pattern analysis.
Intraperiod swings have still been real. The worst drawdown inside a winning year came in 2002, when the stock was down as much as 22.22% from the entry point before finishing the window up 21.06%. Other years, such as 1990 and 2014, saw adverse moves of roughly 11.39% and 9.62% respectively before recovering. On the upside, maximum favorable excursions have often run ahead of the final net gains, with years like 2018 showing a 32.18% peak run-up against a 25.21% final gain.
Trend-wise, the historical seasonal average suggests a pattern where gains tend to build steadily rather than in a single burst. Early parts of the window have often been choppy, especially in years like 1990 and 2010, while the back half has tended to carry more of the net advance. That fits the broader election-cycle playbook, where midterm-year volatility gives way to a stronger pre-election-year tone.
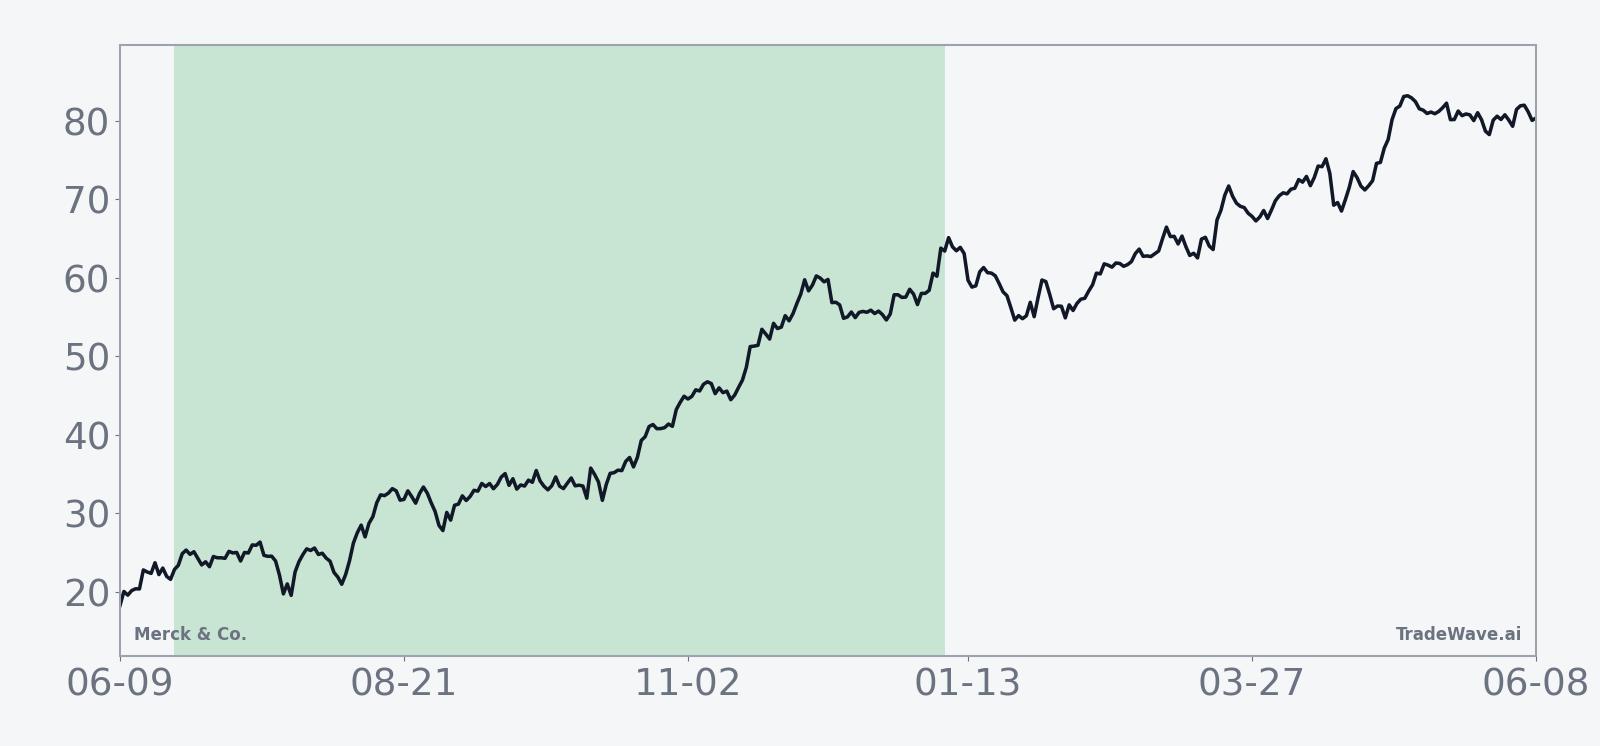
A second view combines net results with the best and worst intraperiod swings to show how far MRK has tended to travel inside the window.
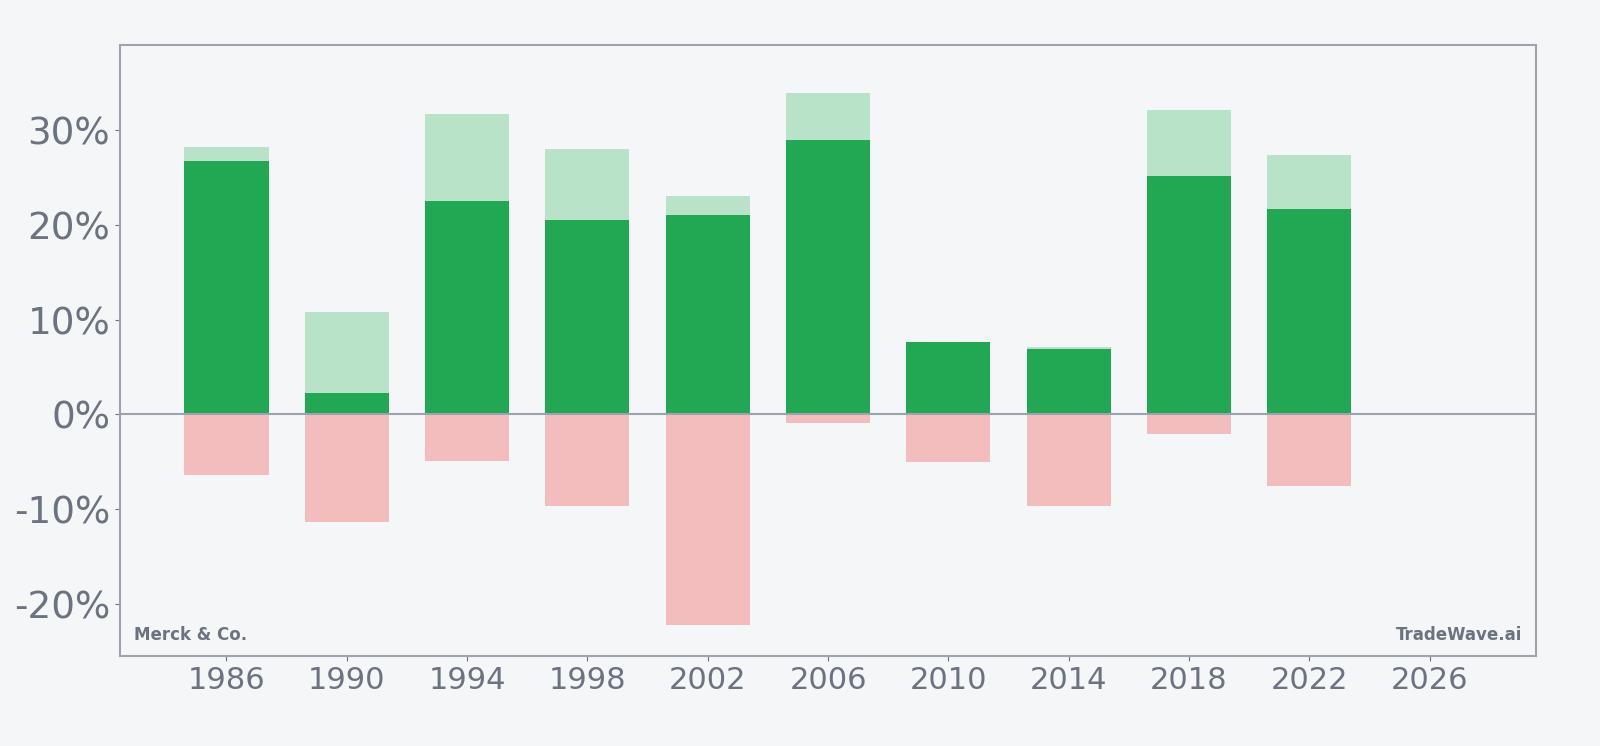
The stacked view of net returns, maximum favorable moves and maximum adverse moves shows a clear pattern: every year has finished higher, but many have included double-digit drawdowns along the way. Large positive MFE readings alongside sizable MAE in years like 2002 and 1998 flag this as a high-variance but directionally consistent window for long exposure.
History does not guarantee future results; adverse excursions (MAE) can be large even in winning windows.
Why does Merck & Co. (MRK) follow this seasonal pattern?
One likely driver is the way the earnings calendar and policy backdrop line up in the back half of the midterm election year. Merck & Co. typically delivers multiple data points on its oncology and vaccine franchises in this stretch, while political uncertainty around healthcare policy often eases as midterm campaigns mature. That mix can encourage institutional portfolio repositioning into large-cap pharma as investors prepare for the historically stronger pre-election year.
What is driving Merck & Co. (MRK) today?
Merck & Co. closed at $115.48 on Jun 23, up 1.4% on the session, leaving the stock about 1.2% above its 50-day moving average of $114.06 and 5.6% higher year to date. The move comes against a backdrop where, in Oct 2025, Merck reported Q3 2025 revenue of about $17.28 billion and adjusted EPS of $2.58, topping estimates and nudging full-year guidance higher as Keytruda sales climbed to $8.1 billion and Gardasil delivered $1.75 billion in revenue.[3]
In Jan 2026, Merck outlined a long-term plan to generate roughly $70 billion in revenue from new growth drivers by the mid-2030s, underscoring how aggressively it is investing to offset Keytruda’s expected loss of exclusivity in 2028.[4] That strategy has included deal-making: in Jan 2026, reports surfaced that Merck was in talks to acquire Revolution Medicines for about $30 billion, and by Mar 2026 it was also said to be nearing a roughly $6 billion all-cash acquisition of Terns Pharma to deepen its cancer portfolio.[2][13]
Earlier, in 2025, Merck’s oncology franchise picked up additional regulatory momentum. In Nov 2025, coverage highlighted how the FDA approval of a Keytruda plus Padcev regimen for muscle-invasive bladder cancer and the EU launch of a subcutaneous Keytruda formulation expanded the drug’s reach and helped power the stock’s prior surge.[1] Those catalysts, while dated, frame why investors are so focused on how Merck navigates the next few years of oncology competition and patent risk as this new seasonal window opens.
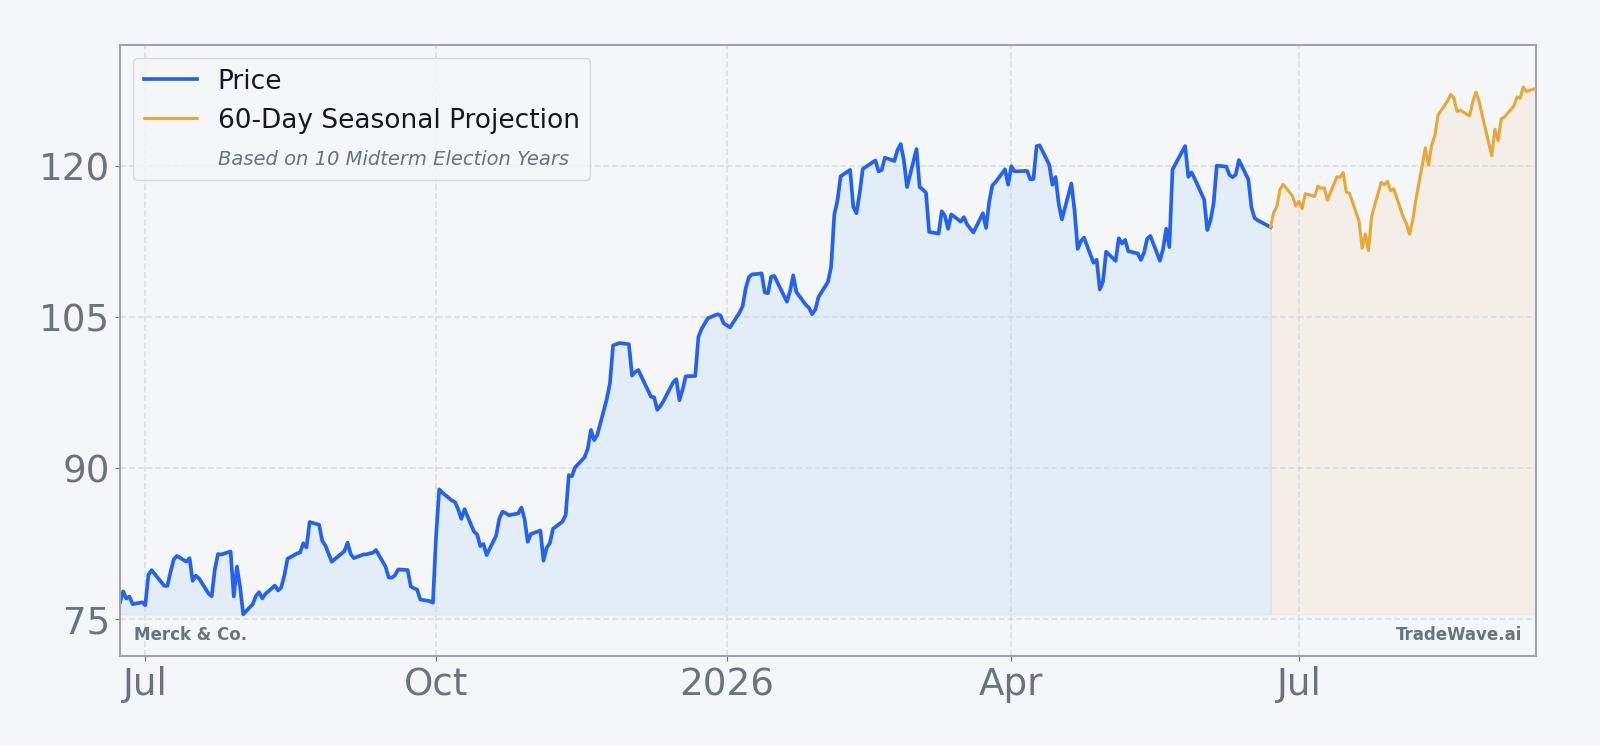
The chart below situates the latest move in its recent multi-month context, alongside a short-term seasonal projection.
What should traders watch in this Merck & Co. seasonal window?
First, watch how MRK behaves around its 50-day moving average in the early weeks of the window. Historically, some of the strongest midterm-year runs have started from similar mid-range levels, but several years also saw double-digit drawdowns before the uptrend took hold.
Second, keep an eye on oncology news flow and deal execution. Follow-through on the Revolution Medicines and Terns Pharma deal narratives, along with any new data around Keytruda combinations or next-generation assets, will shape how investors price Merck’s post-2028 revenue mix.[2][13] Positive updates during this historically strong stretch would rhyme with prior cycles where fundamental momentum and the MRK seasonal trend lined up.
Third, monitor how the broader healthcare and large-cap pharma sector trades as the midterm election year progresses into the pre-election year. If risk appetite rotates toward cyclicals and away from defensives, a historically bullish MRK seasonal window that still delivers gains would signal genuine stock-specific strength rather than just a sector bid.
Finally, track intraperiod volatility against the historical pattern. If MRK experiences sharp drawdowns similar to the roughly 22% worst-case adverse move seen in 2002 yet continues to respect support and recover inside the window, that would be consistent with the long-biased but bumpy profile seen in prior midterm-election years. A clean break of that behavior, either via a sustained loss for the window or unusually muted swings, would be a sign that this cycle is diverging from the past.
Sources
- [1] Forbes, “Why Is Merck Stock Surging?” (Nov 26, 2025).
- [2] Seeking Alpha, “Key deals this week: Merck, Glencore, CrowdStrike, Marvell Technology, Steel Dynamics and more” (Jan 10, 2026).
- [3] Reuters, “Merck posts higher third-quarter sales as Keytruda growth offsets drop from Gardasil” (Oct 30, 2025).
- [4] Reuters, “Merck says new growth opportunities to drive revenue of $70 billion by mid-2030s” (Jan 13, 2026).
- [13] Reuters, “Merck nears $6 billion acquisition of Terns Pharma to boost cancer portfolio, FT reports” (Mar 24, 2026).
About this seasonal analysis
Seasonal pattern data is sourced from TradeWave.ai, which analyzes historical price behavior across annual calendar windows going back up to 30 years. Read the full data methodology or the book The 100-Year Pattern by Afshin Moshrefi (2026 edition). Past performance of seasonal patterns does not guarantee future results. This article is for informational purposes only and does not constitute investment advice.