IBM Enters Historically Weak 47-Day Period After Earnings Shock
IBM is sliding more than 24% after a Q2 warning just as it approaches a 47-day seasonal window that has often rewarded bearish trades and featured sharp swings.
Price as of Jul 14, 2026: $219.37 (intraday).

What is the seasonal pattern for IBM (IBM)?
IBM has fallen in 9 of 15 years during this late-July 47-day window, with an average 6.45% gain in winning short years.
- 9 for 15 in this window, with short trades averaging 6.45% gains in winning years and a 2% average across all years.
- The 47-day IBM trading window starts Jul 19 and has historically leaned bearish, aligning with a short trade direction.
- Percent Profitable is 60%, with 9 winners and 6 losers across the 15-year lookback.
- Avg Profit reflects only the profitable short years, while Avg Profit - All shows the thinner 2% edge once losing seasons are included.
- Maximum favorable and adverse moves inside the window have been large, pointing to a high-volatility IBM seasonal trend rather than a gentle drift.
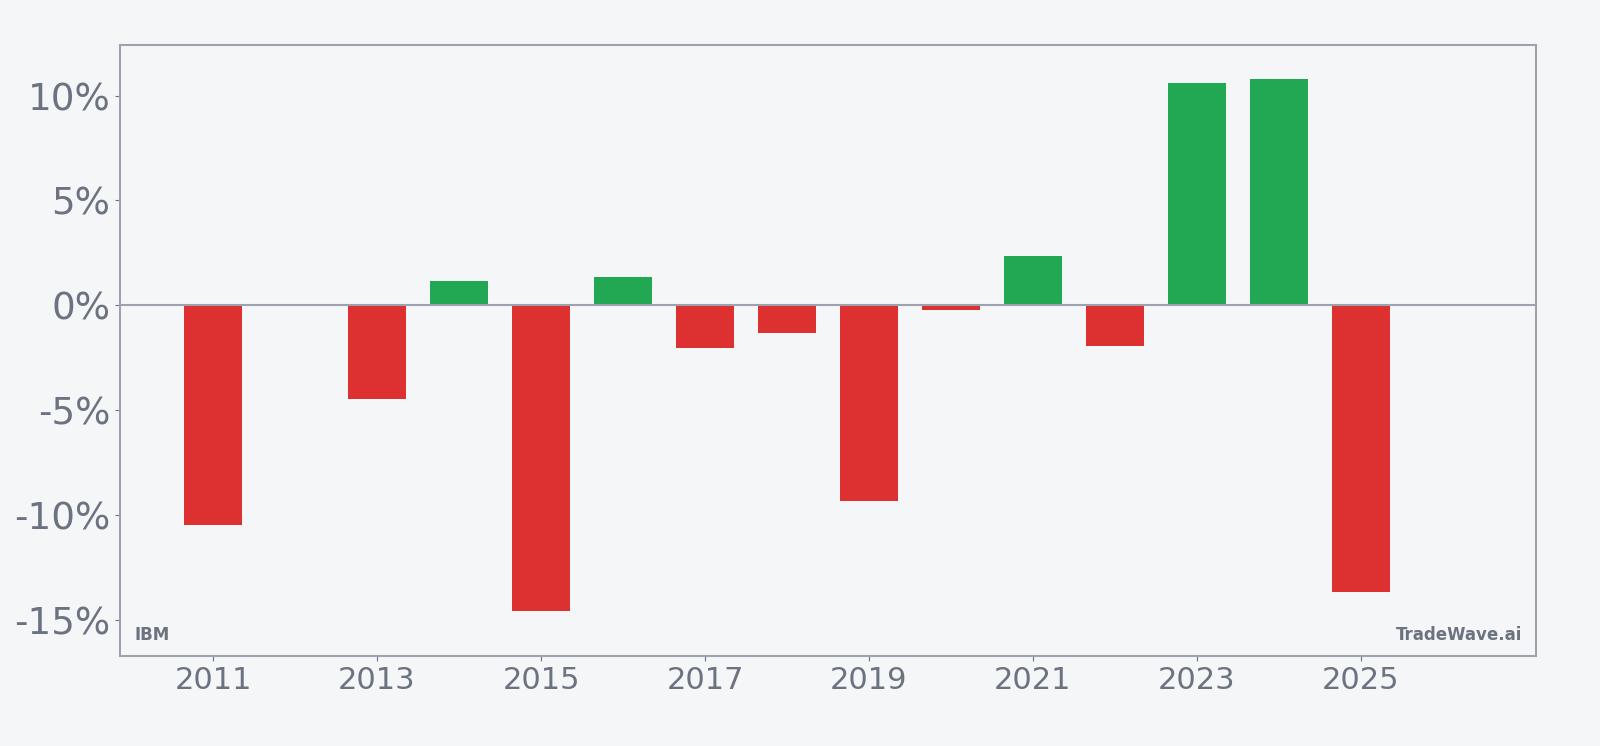
- Recent years like 2023 and 2024 delivered double-digit gains for shorts, but 2025 saw a sharp loss, underscoring the risk in this IBM trading window.
According to historical data from TradeWave.ai, this upcoming stretch for IBM has behaved differently from an average summer month, with a distinct pattern that traders rarely see discussed in mainstream coverage.
How has IBM (IBM) traded in this late-July seasonal window?
IBM’s late-July seasonal window has historically favored the bears, with short trades profitable in 9 of the past 15 years and winners averaging 6.45% gains over the 47-day stretch. The next iteration of this window begins on Jul 19, with the stock coming off a violent reset at 219.16, about 34.1% below its 52-week high of 332.46 after Tuesday’s plunge. That combination of a fresh drawdown and a historically weak seasonal pattern turns this year’s window into a stress test for IBM’s AI and hybrid-cloud story rather than a routine summer lull.
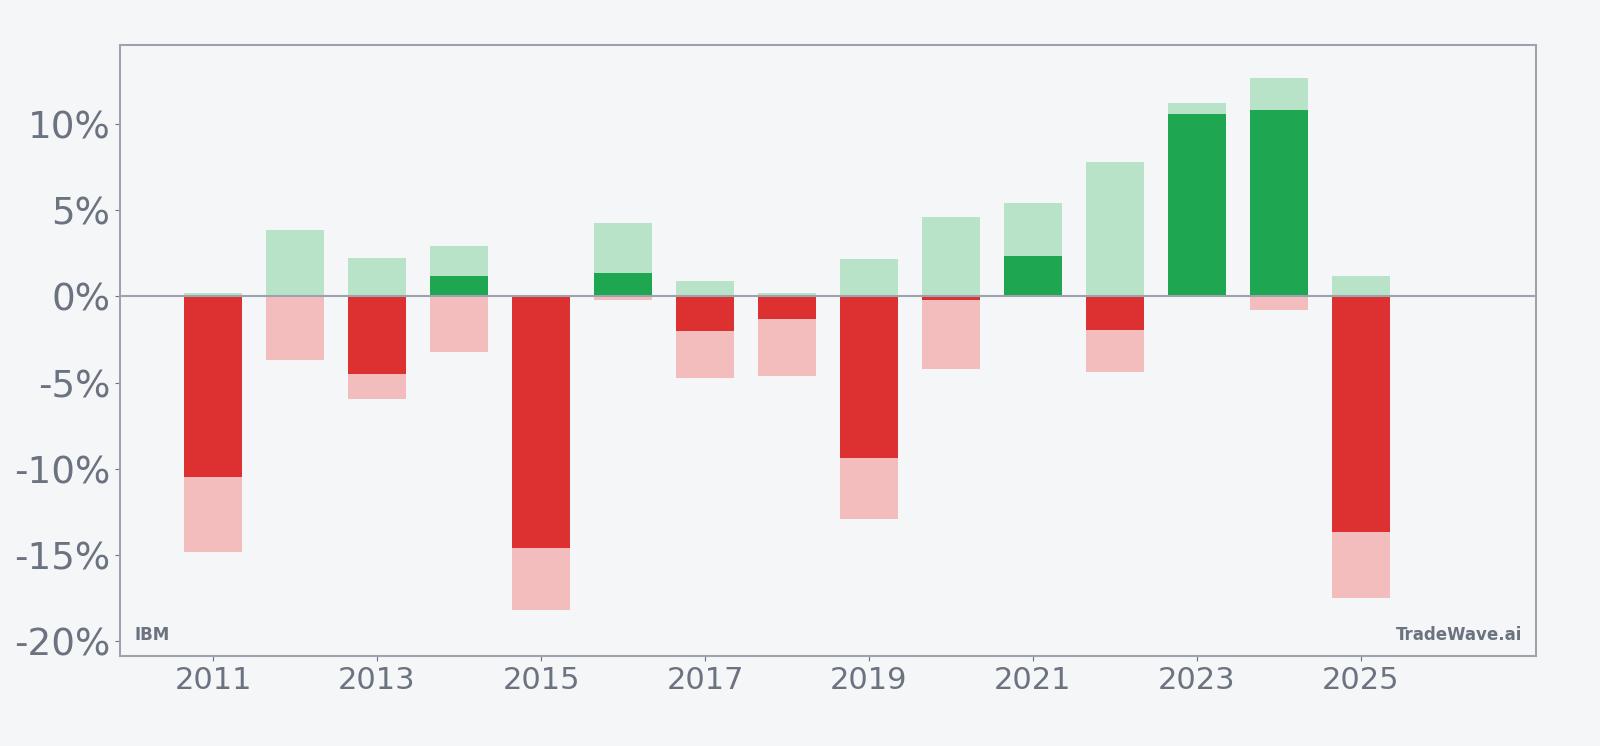
Stacked yearly bars of net, best-case and worst-case moves show how far IBM has tended to travel in both directions during this stretch.
Across the 15-year sample, the IBM seasonal pattern analysis points to a modest but persistent edge for short trades. Percent Profitable sits at 60%, with 9 winning years for shorts and 6 losing years, and the all-years average outcome is a 2% gain in the trade direction. The 6.45% Avg Profit in winning years shows that when the pattern works, it has tended to work meaningfully rather than by a few basis points.
The per-year table shows how uneven those outcomes can be. In 2023 and 2024, the window delivered double-digit net returns for shorts, at 10.6% and 10.8% respectively, with maximum favorable moves above 11% and 12%. By contrast, 2019 and 2025 were painful for bears, with net losses of 9.35% and 13.68% as IBM rallied through the window despite the historical seasonality.
The maximum favorable excursion and maximum adverse excursion profile underlines that this is a high-variance IBM trading window. In strong short years, the best intraperiod move has often pushed into high single digits or low double digits, while the worst drawdowns in losing years have also been deep, such as the 17.48% adverse move recorded in 2025. That mix of large MFE and large MAE means the IBM seasonal trend here is about big swings, not quiet drift.
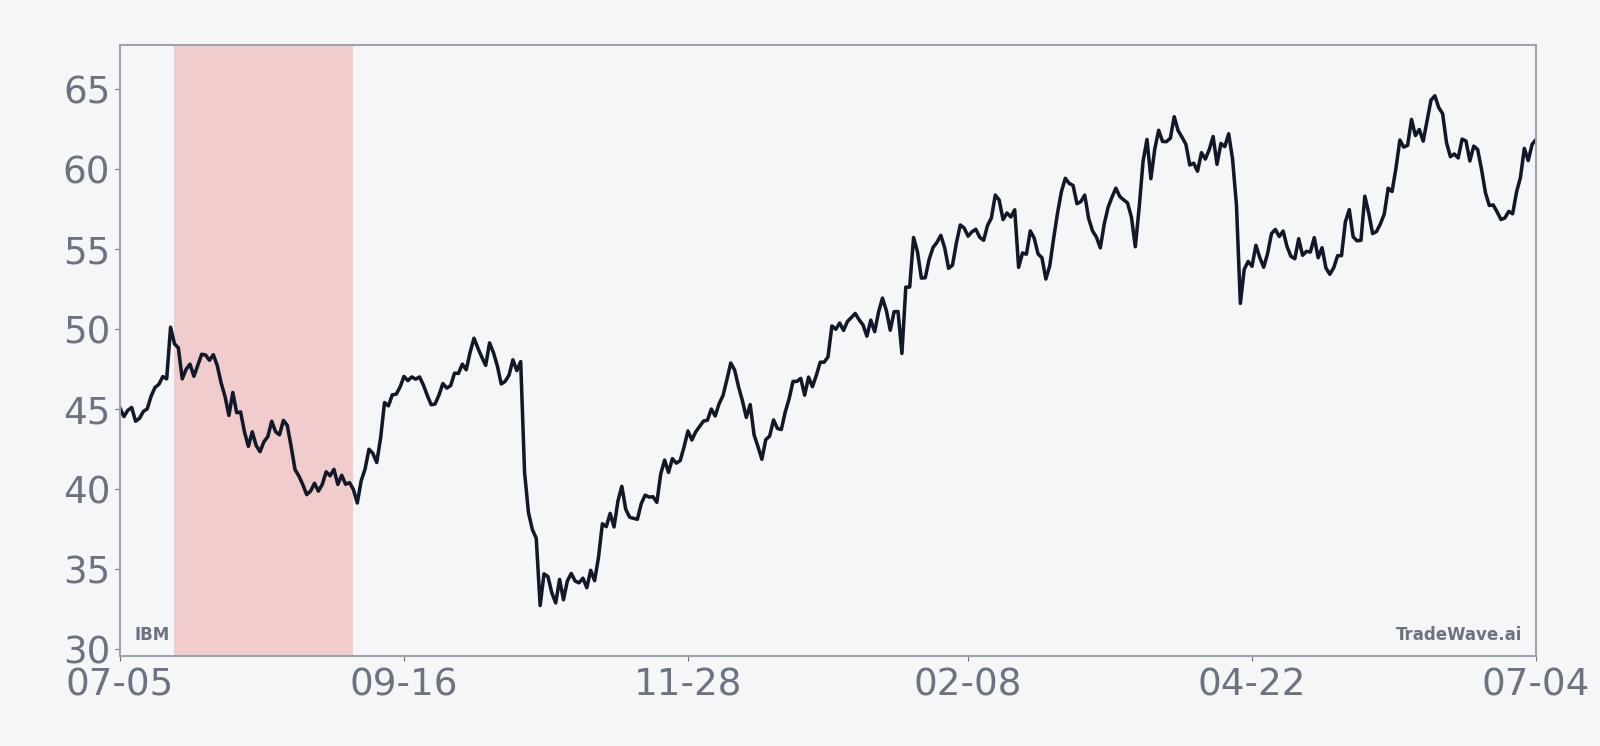
The 15-year average trend line suggests that weakness, when it appears, tends to build gradually rather than in a single air pocket. Returns often chop early in the window, then lean more consistently in the short direction into the back half of the 47 days. The cumulative return chart, which climbs to a 31% total gain for the strategy across the sample, shows that the edge has come from a handful of outsized bearish seasons stacked on top of smaller wins and several notable losses.
Put together, the pattern is clear: this late-July IBM seasonal window has historically rewarded well-timed short exposure more often than not, but the swings on both sides have been large enough that risk management has mattered as much as direction.
Why does IBM (IBM) follow this seasonal pattern?
One likely driver is IBM’s earnings calendar, with second-quarter results and guidance updates often landing around this part of the summer and resetting expectations for the rest of the year. Analysts have also pointed to institutional portfolio repositioning in large-cap tech and enterprise software during midyear, as funds rebalance around AI, cloud and hardware spending cycles. This IBM seasonal pattern may reflect that combination of earnings surprises, sector rotation and options positioning clustering around key dates.
History does not guarantee future results; adverse excursions (MAE) can be large even in winning windows.
What is driving IBM (IBM) today?
IBM shares closed at 219.16 on Tuesday, down 24.5% on the day and about 34.1% below the 52-week high of 332.46, after the company warned that second-quarter revenue and earnings would miss Wall Street estimates as customers shift spending from software and mainframes toward AI servers and memory-heavy infrastructure.[3] The company preannounced adjusted Q2 EPS of $2.93 versus $3.02 expected and revenue of $17.2 billion versus $17.86 billion expected, framing the shortfall as a demand mix issue rather than a collapse in overall IT budgets.[3]
The warning lands just months after IBM reported a solid first quarter in April 2026, when adjusted EPS of $1.91 topped expectations and revenue of $15.9 billion edged past consensus, and management reiterated a 2026 outlook calling for more than 5% constant-currency revenue growth and about $1 billion of additional free cash flow.[4] In October 2025, IBM had also raised full-year revenue guidance to more than 5% growth and highlighted a growing AI book of business, which it said had surpassed $9.5 billion, underscoring how quickly sentiment has flipped from “AI tailwind” to “AI-driven mix shift.”[5]
Options traders have been active around IBM’s narrative shifts. In May 2026, reports of a potential $1 billion U.S. Commerce Department grant for quantum computing projects helped spark heavy options activity, with call contracts outpacing puts and speculative interest building around IBM’s quantum and AI positioning.[8] Earlier in June, IBM shares surged about 15% in a single session after a video of former President Donald Trump praising the company resurfaced, a move that coincided with a bullish Barclays forecast and reinforced how politically tinged headlines can amplify volatility in the stock.[9][10]
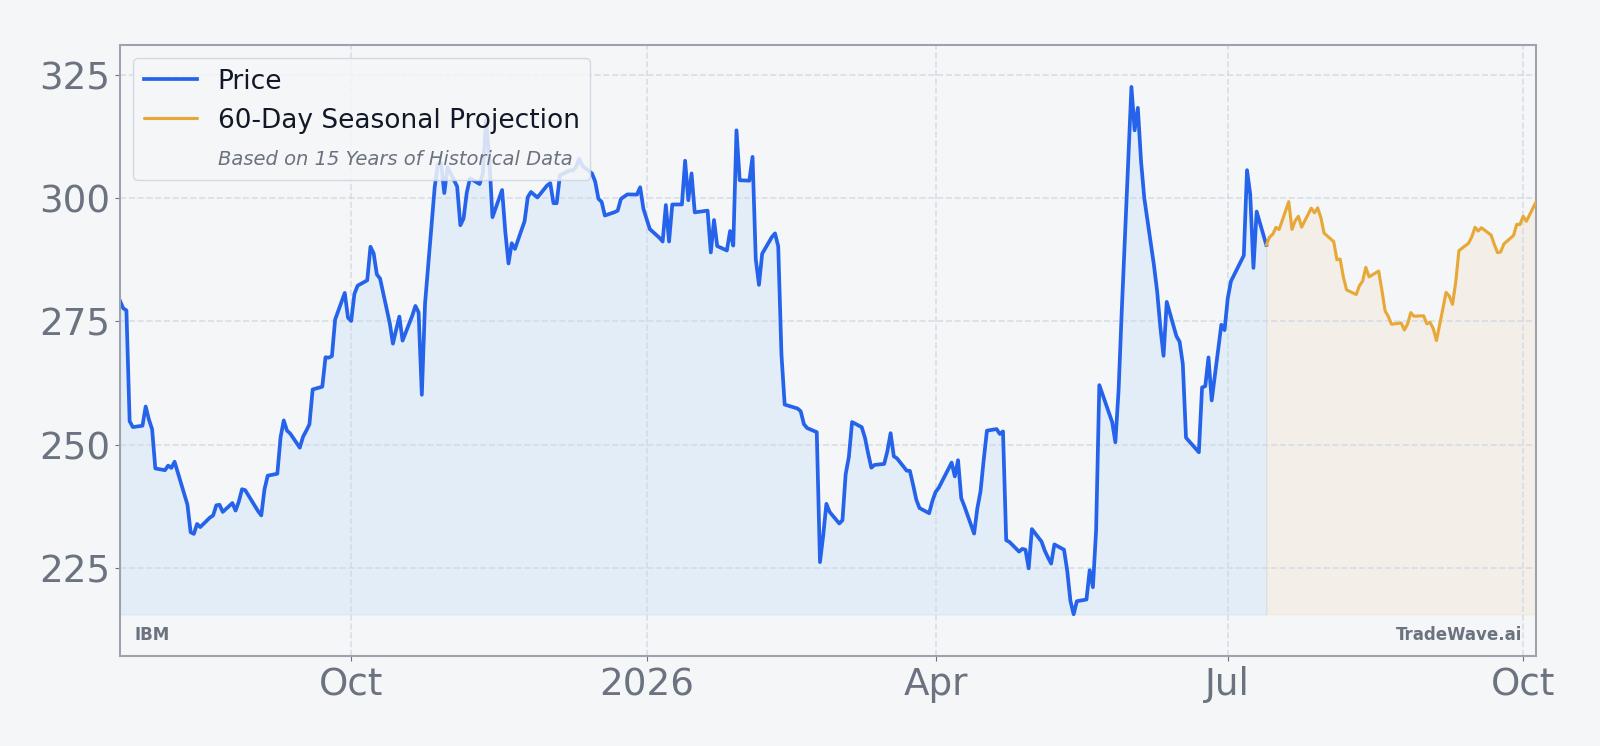
The chart below situates the latest move in its recent multi-month context, including a 60-day seasonal projection overlay for the upcoming window.
What does IBM’s earnings and guidance backdrop look like?
The Q2 2026 preannouncement marks a sharp break from the trajectory IBM had been sketching over the past year. In Q3 2025, the company topped estimates on both revenue and adjusted EPS and lifted full-year revenue guidance to more than 5% growth, citing AI tailwinds and stronger infrastructure demand, even as the stock sold off on concerns about the quality and durability of that growth.[5] In July 2025, IBM again beat on revenue and EPS for the June quarter, but softness in the software segment weighed on investor reaction and raised questions about how much of the AI and hybrid-cloud story was translating into high-margin recurring revenue.[7]
By April 2026, IBM was still talking up a path to more than 5% constant-currency revenue growth for the year and about $1 billion of incremental free cash flow, suggesting that management believed the AI and hybrid-cloud strategy was gaining traction despite pockets of weakness.[4] Tuesday’s warning reframes that narrative: demand is not disappearing, but it is shifting toward AI servers, storage and memory, which can pressure near-term margins and disrupt the cadence of mainframe and software sales that many investors had been using as a guidepost.[3]
Street commentary earlier in the cycle had been cautiously constructive. In October 2025, analysts highlighted IBM’s positioning in enterprise AI, WatsonX, Red Hat and hybrid cloud as key drivers for software and consulting revenue, arguing that the stock’s valuation left room for upside if execution improved.[6] A February 2026 analysis framed IBM as “on sale,” pointing to fundamentals and aggregate analyst targets that implied a disconnect between the company’s cash generation and its share price, though those targets now look calibrated to a higher price regime than today’s post-warning level.[11]
How do macro and sector trends affect IBM’s seasonal outlook?
IBM’s latest warning is tied directly to a macro theme that has been building across the hardware and data-center complex: a global memory shortage and supply constraints that are pushing clients to redirect capital spending toward servers, storage and memory to support AI workloads.[3] That shift can crowd out budgets for traditional mainframes and some software projects, creating a near-term headwind for IBM’s legacy businesses even as it benefits from AI infrastructure demand.
At the sector level, IBM sits at the intersection of enterprise AI, hybrid cloud and consulting, with WatsonX and Red Hat often cited as core pillars of its growth strategy.[6] When corporate IT budgets tilt toward AI infrastructure, IBM can win on the hardware and services side but lose some of the high-margin software momentum that had underpinned bullish long-term models. That tension helps explain why the stock has seen outsized single-day moves around AI and quantum headlines, and it adds another layer of complexity to interpreting the upcoming seasonal window.
How are investors thinking about IBM’s valuation after the drop?
IBM’s 24.5% slide on Tuesday effectively rewinds a large chunk of the stock’s prior rerating, taking it from near record highs back toward levels last seen before the latest wave of AI enthusiasm.[3] Earlier this year, commentary framed IBM as undervalued relative to its cash flows and AI optionality, with some analysts arguing that the market was underpricing the durability of its enterprise relationships and hybrid-cloud footprint.[11] After the warning, the debate shifts from “is IBM cheap?” to “how much of the AI and quantum upside is needed just to offset the drag from mix shifts and supply bottlenecks?”
Because the stock is still a Dow component and a meaningful player in enterprise tech, its valuation reset can ripple through factor baskets tied to dividends, value and legacy tech. That makes the upcoming seasonal window more than a curiosity: if IBM follows its historical pattern and remains under pressure, it could reinforce a broader rotation away from older tech incumbents toward pure-play AI and cloud names. If it breaks the pattern and stabilizes or rallies, it would signal that investors are willing to look through near-term turbulence to the longer-term AI and hybrid-cloud story.
What should traders watch in IBM (IBM) during this seasonal window?
First, watch how IBM trades as the Jul 19 window opens relative to the 212 to 230 band that framed Tuesday’s intraday range. Sustained trading below the recent low near 213 would be consistent with the historical bearish seasonal bias, while a quick reclaim of the mid-220s and a push toward the 50-day moving average near 262.49 would look more like the losing short years in 2019 and 2025.
Second, keep an eye on earnings follow-through. The formal Q2 release and any updated guidance will test whether the July warning was a one-off reset or the start of a longer period of mix-driven pressure.[3] If management can reaffirm a path to more than 5% revenue growth and incremental free cash flow despite the shift toward AI servers and memory, it could blunt the seasonal downside tendency. A weaker or more cautious tone would align more closely with the historical pattern of midyear softness.
Third, monitor options and volume behavior. The stock has already seen unusually heavy options activity and large single-day moves around AI, quantum and political headlines, including the May quantum grant story and the June surge tied to a resurfaced Trump video and a bullish Barclays call.[8][9][10] If call buying and speculative flows rebuild into the window, it could set up squeezes that punish shorts despite the bearish seasonal backdrop; if activity skews toward protective puts and hedging, it would reinforce the downside risk implied by the historical IBM seasonal trend.
Finally, track how IBM trades relative to other enterprise AI and hybrid-cloud names. A divergence where IBM continues to lag while peers stabilize would suggest company-specific execution and mix issues, while a broader pullback across the group would point to a sector-wide reset in AI infrastructure expectations. Either way, the next 47 trading days will show whether this year’s IBM trading window repeats the historical pattern or breaks it.
Sources
- CNBC, "IBM is trying to rebound after results disappointed initially. What analysts and investors are saying", Oct 23, 2025
- MarketWatch, "IBM’s stock is sliding. Here’s why these analysts see an opportunity to buy.", Jul 24, 2025
- Yahoo Finance, "IBM stock plummets more than 25% on Q2 earnings warning", Jul 14, 2026
- Yahoo Finance, "IBM Stock Tumbles. Solid Quarter Can't Offset Tepid Forecast", Apr 23, 2026
- CNBC, "IBM tops third-quarter estimates and lifts guidance, but stock drops", Oct 22, 2025
- Forbes, "What’s Happening With IBM Stock?", Oct 7, 2025
- MarketWatch, "Why is IBM’s stock down after an earnings beat? Here’s one quibble.", Jul 23, 2025
- Yahoo Finance, "IBM shares surge 15% after Trump video resurfaces", Jun 1, 2026
- Business Insider, "IBM stock shoots higher after bullish Barclays forecast hits back at SaaSpocalypse fears", Jun 1, 2026
- Forbes, "IBM Stock Isn't Dying. It's On Sale", Feb 24, 2026
About this seasonal analysis
Seasonal pattern data is sourced from TradeWave.ai, which analyzes historical price behavior across annual calendar windows going back up to 30 years. Read the full data methodology or the book The 100-Year Pattern by Afshin Moshrefi (2026 edition). Past performance of seasonal patterns does not guarantee future results. This article is for informational purposes only and does not constitute investment advice.