Merck & Co. (MRK) Faces 2026 Patent Hit as 10-for-10 Midterm Rally Window Nears
Merck & Co. is trading just below its 52-week high as it heads toward a long midterm-election-year seasonal window that has never produced a loss in the last 10 cycles.
Price as of Jul 7, 2026: $128.86 (last close).

What is the seasonal pattern for Merck & Co. (MRK)?
Merck & Co. has risen in 10 of 10 midterm-election-year windows starting in early August, with an average gain of 28.15% in winning years.
- 10 for 10 in this window, averaging 28.15% gains in winning years across the last 10 midterm election cycles.
- Seasonal window begins Aug 6, 2026 and runs 283 calendar days, spanning the late midterm year into the following pre-election year.
- Percent Profitable is 100%, with 10 winners and 0 losers in the historical sample.
- Trade Direction is long, with a TradeWave Ratio of 2.2 and a Sharpe ratio of 1.97, pointing to strong risk-adjusted upside.
- Individual years have seen maximum favorable moves as high as 55.2%, while adverse excursions have reached roughly 11.66% inside the window.
- Cumulative return across all 10 windows totals 1,041%, highlighting how powerful this specific Merck & Co. trading window has been historically.
According to historical data from TradeWave.ai, this midterm-election-year stretch has behaved very differently from an average calendar period for Merck & Co. The next section walks through how that pattern has played out and where the upcoming window fits in the current cycle.
How has Merck & Co. (MRK) traded in this midterm-year seasonal window?
Merck & Co. has rallied in every one of the last 10 midterm-election-year windows that start around Aug 6 and run for 283 calendar days, averaging 28.15% gains with no losing years. Shares finished Tuesday at $128.86, up 1.6% on the day and about 1.1% below their 52-week high of $130.29, so the stock is heading into this historically strong stretch from a position of strength. That combination of a clean 10-for-10 record and a price already near the top of its one-year range makes this upcoming Merck & Co. trading window hard for seasonal traders to ignore.
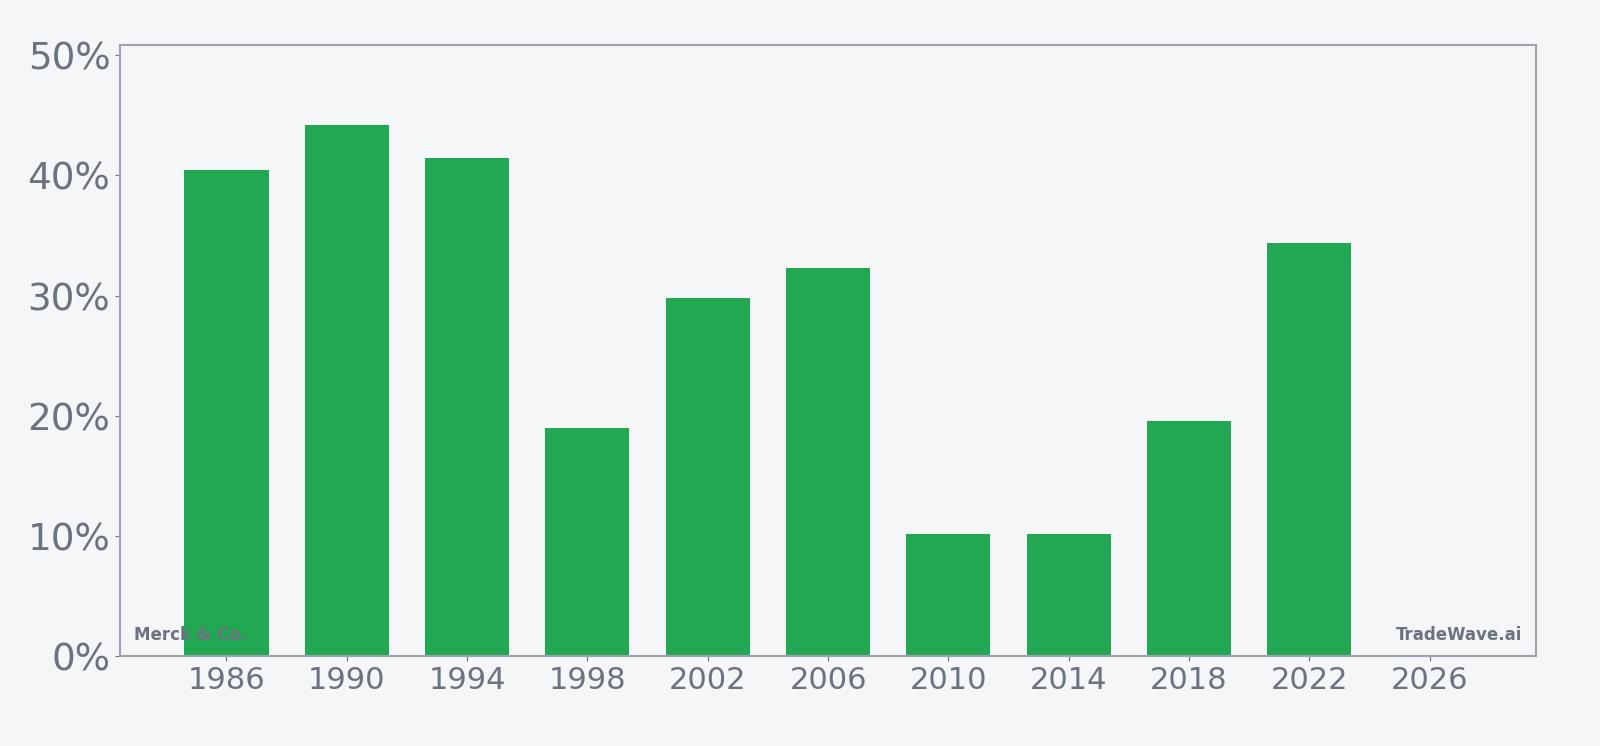
Grouping the data by the presidential election cycle matters here because this window sits in the midterm election year and then runs deep into the year before the presidential election, a phase that has often coincided with shifting policy expectations and renewed risk appetite in equities. For a large healthcare name like Merck & Co., that backdrop can intersect with drug-pricing debates, Medicare negotiations and regulatory decisions that tend to cluster around election calendars, shaping how investors position in the stock.
Historically, the trade direction for this pattern is long, and the record is unusually clean. Percent Profitable is 100%, with 10 winners and 0 losers, and the average profit across all years is 28.15%. The median outcome is even higher at 31.02%, which tells you that more than half of the past windows delivered gains north of 30%.
The per-year table shows how broad-based that strength has been. The weakest net gain in the sample came in 2010 and 2014, when Merck & Co. still advanced about 10.17% and 10.18% over the window. At the other end of the range, years like 1990 and 1986 posted net returns of 44.22% and 40.45%, while 2022 delivered a 34.37% gain from an entry around $78.44 to an exit near $105.40.
Intraperiod swings have been meaningful but manageable for a long-biased pattern. Maximum favorable moves have ranged up to 55.2% in 1986 and 51.54% in 1994, showing how far the stock has sometimes run at its best point inside the window. On the downside, the worst adverse excursions have reached roughly 11.66% in 1990 and around 8% in 2010, so even winning years have included drawdowns that would test conviction.
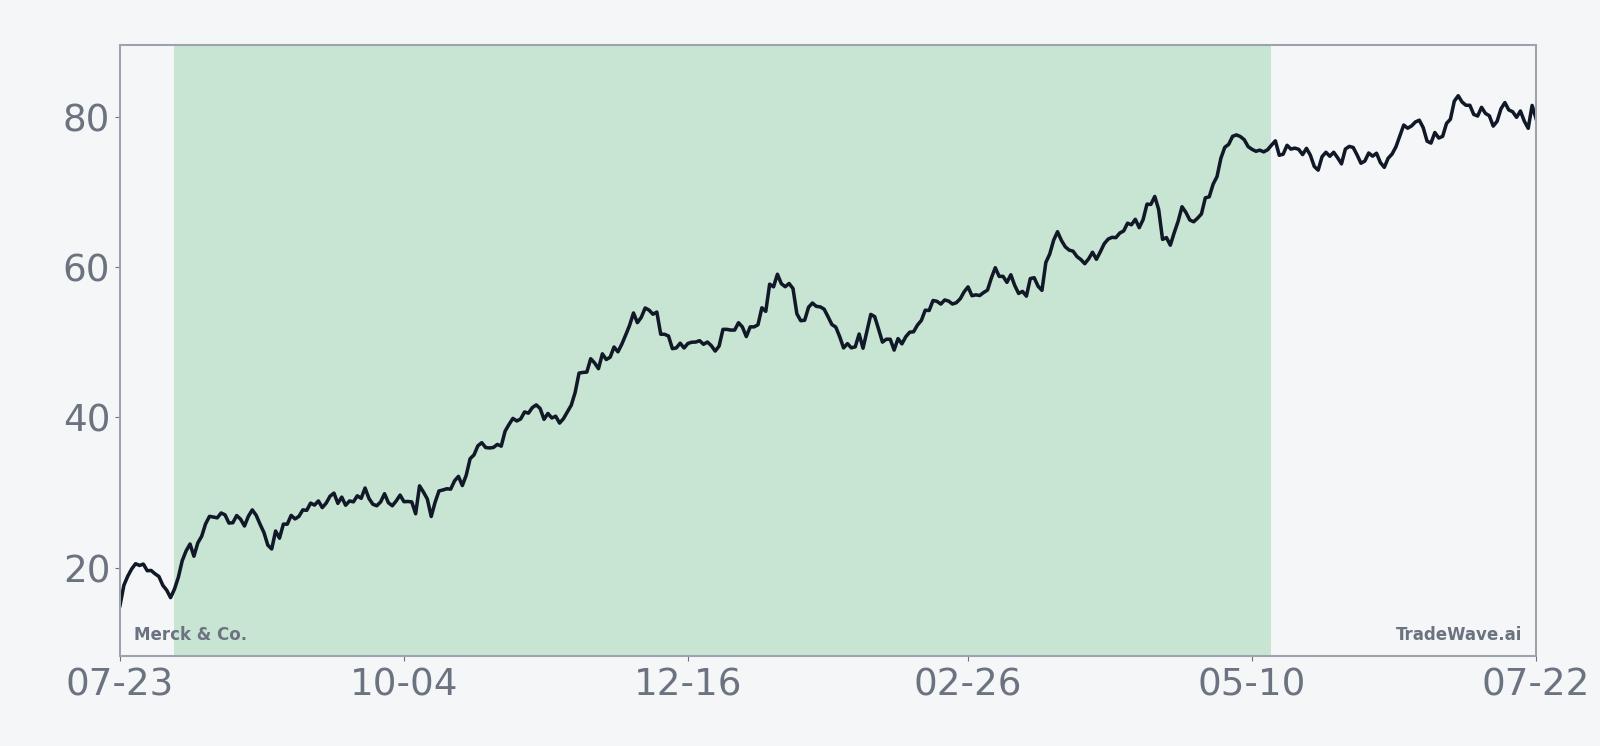
The historical seasonal trend chart for this 283-day stretch shows a fairly steady upward slope rather than a single explosive burst. Gains tend to build through the first half of the window, pause or consolidate mid-way, then accelerate again into the final third as the calendar transitions from the midterm election year into the year before the presidential election. That shape suggests a pattern where pullbacks have been opportunities rather than regime changes in prior cycles.
Year-by-year net returns and intraperiod swings round out the picture of upside persistence with typical drawdowns.
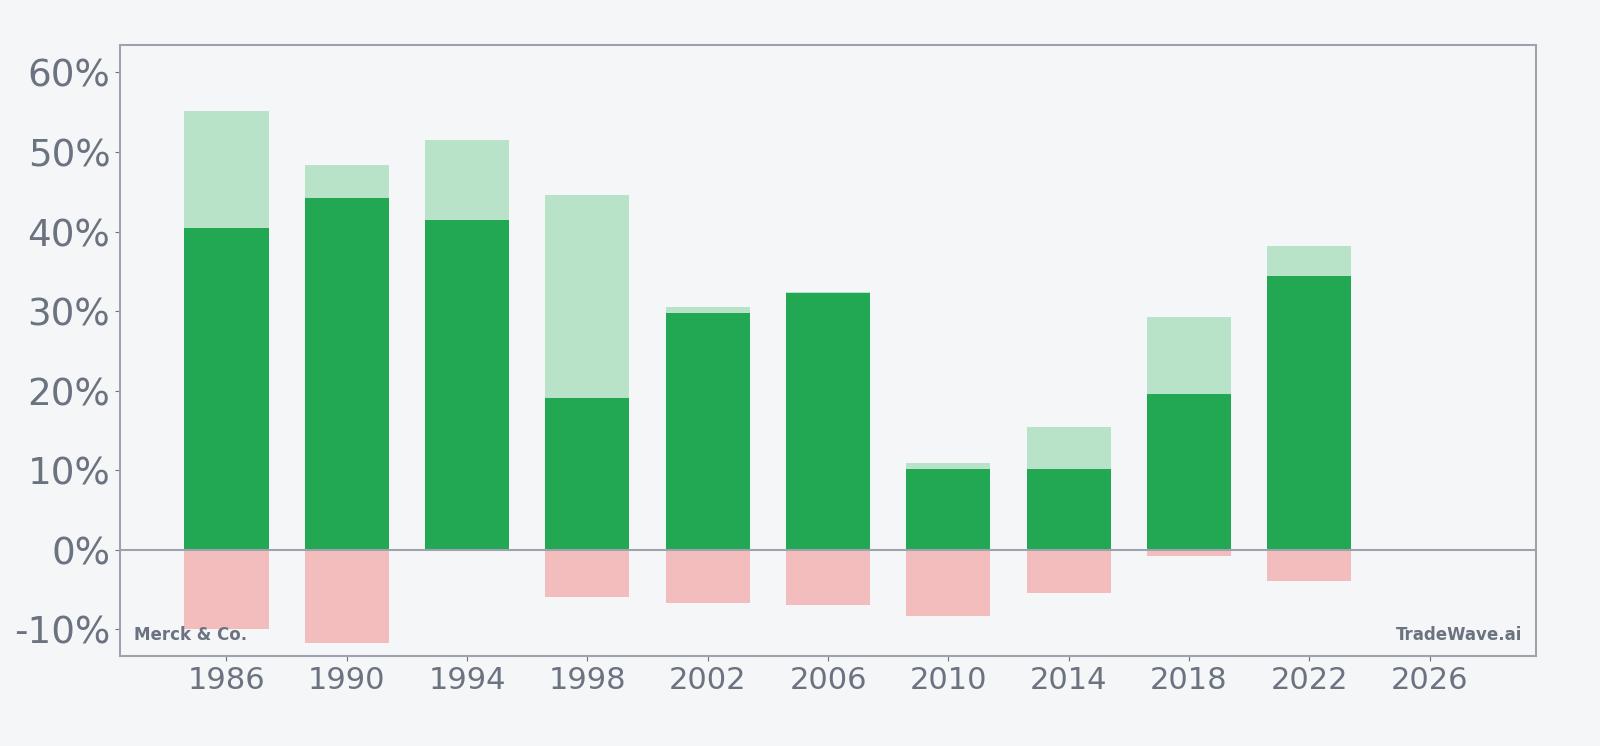
The stacked net, maximum favorable move and maximum adverse move bars show a consistent pattern: every year finished positive, but most also featured mid-window dips of 5% to 10% before recovering and pushing to new highs. Add it up and you get a 1,041% cumulative gain across the 10 midterm-election-year windows, with a Sharpe ratio of 1.97 that speaks to strong risk-adjusted performance rather than a single lucky outlier.
History does not guarantee future results; adverse excursions can still be large inside this window even when the final outcome is positive.
Why does Merck & Co. (MRK) follow this seasonal pattern?
One likely driver is the way Merck & Co.’s earnings calendar and guidance updates line up with the political cycle, with key oncology and vaccine updates often landing as investors reposition around midterm and pre-election policy risk. Analysts have also pointed to sector rotation, as large-cap pharmaceuticals can move from defensive havens in early midterm volatility to growth proxies once regulatory headlines clear and visibility on drug pricing improves. This pattern may also reflect institutional portfolio rebalancing, with healthcare weightings adjusted as fiscal and healthcare policy priorities become clearer heading into the presidential election year.
What is driving Merck & Co. (MRK) today?
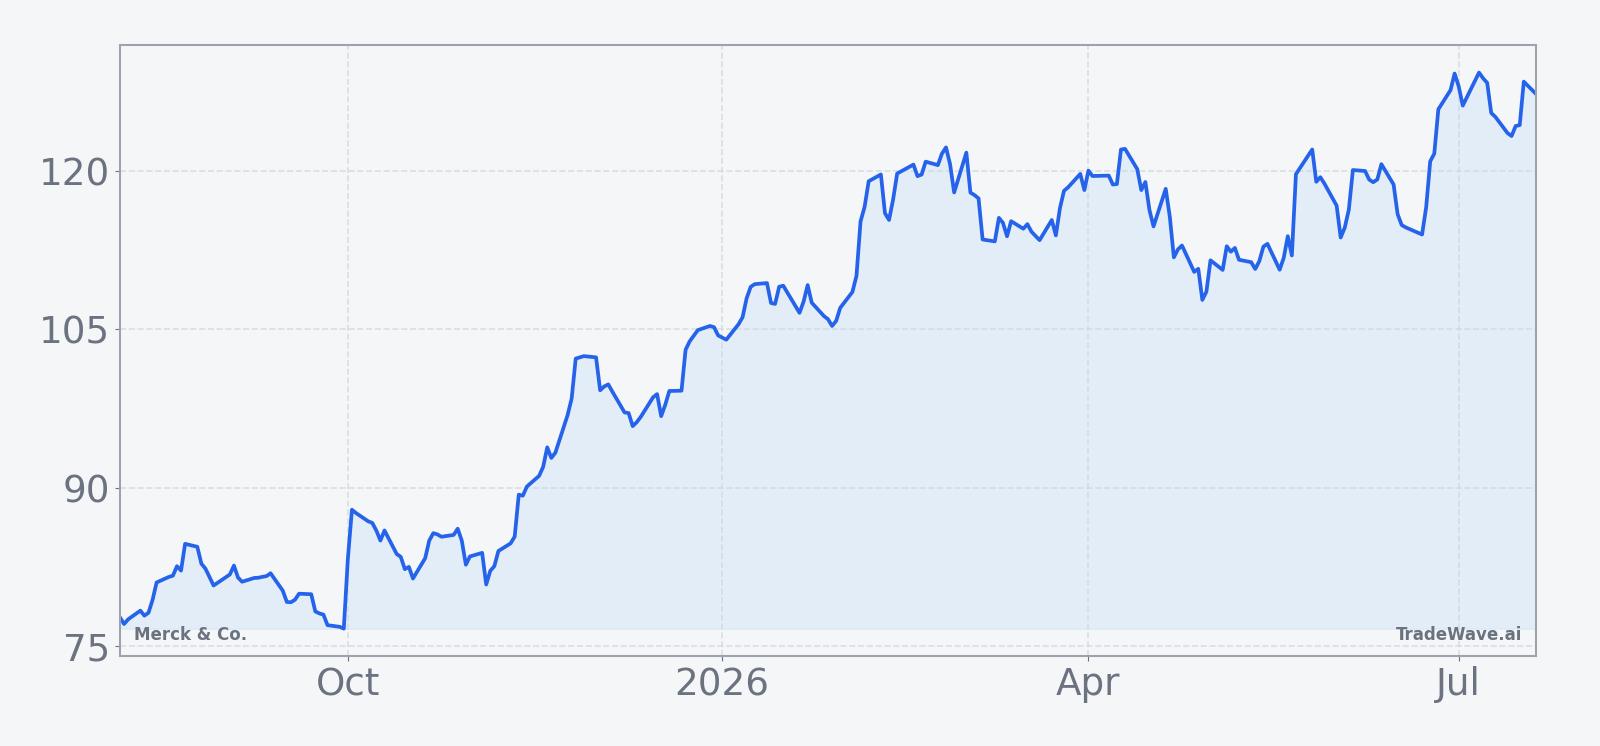
Merck & Co. closed at $128.86 on Tuesday, up 1.6% on the session and sitting just 1.1% below its 52-week high of $130.29, capping a roughly 8.22% gain over the past month. Trading volume of about 8.7 million shares came in below the 20-day average of roughly 12.3 million, suggesting the latest push higher has not yet attracted heavy momentum money.
Fundamentally, the story is still anchored in oncology. In late April 2026, Merck narrowed its 2026 revenue guidance to $65.8 billion to $67.0 billion and raised its adjusted earnings outlook to $5.04 to $5.16 per share, citing strength from Keytruda and newer products along with foreign-exchange tailwinds.[4] Earlier in 2026, management acknowledged that 2026 sales would likely land below some Street expectations because of patent losses on diabetes drugs like Januvia and Janumet and pressure from Medicare pricing changes under the Inflation Reduction Act.[3]
Strategically, Merck & Co. has been leaning into oncology deal-making as it prepares for Keytruda’s eventual loss of exclusivity. In January 2026, reports surfaced that the company was in talks to buy Revolution Medicines for about $30 billion, a move that would significantly expand its cancer pipeline.[2] By late March 2026, Reuters reported that Merck was nearing a roughly $6 billion all-cash acquisition of Terns Pharma to further bolster its cancer portfolio and support a dedicated oncology division.[12]
Those moves build on a 2025 backdrop where Merck & Co. posted higher third-quarter sales as Keytruda growth offset a drop in Gardasil, and where the company highlighted new growth opportunities that could drive revenue toward $70 billion by the mid-2030s.[5][6] Together, they help explain why the stock has been able to grind toward fresh highs even as investors weigh looming patent cliffs and policy risk.
The chart below shows how that mix of oncology growth, patent overhang and deal activity has translated into price action, alongside a short-term seasonal projection.
What should traders watch as this Merck & Co. seasonal window approaches?
First, the calendar. The 283-day window begins on Aug 6, 2026, so the next few weeks are about setting the starting point. If Merck & Co. continues to hover near its 52-week high into that date, the historical pattern suggests the stock has often been able to build on strength rather than mean-revert lower during this specific midterm-to-pre-election stretch.
Second, policy and pricing headlines. The macro backdrop includes ongoing pressure from Medicare price negotiations and patent expirations that management has already flagged as a drag on 2026 sales.[3] Any fresh guidance on how Merck & Co. plans to offset those headwinds, especially through oncology launches or pricing strategy, will shape how much investors are willing to lean into a historically bullish seasonal window.
Third, the oncology deal pipeline. Follow-through on the reported Revolution Medicines talks and the near-$6 billion Terns Pharma acquisition would reinforce the narrative that Merck & Co. is aggressively rebuilding its cancer portfolio ahead of Keytruda’s loss of exclusivity.[2][12] If those transactions close on terms the market likes, they could provide catalysts that line up with the early and middle portions of the seasonal window, where past cycles have often seen the strongest trend.
Finally, price behavior inside the window itself will be the real test of this MRK seasonal trend. Historically, pullbacks of 5% to 10% within the window have been common even in strong years, so traders will be watching whether any early dip behaves like a typical shakeout or something more structural. If Merck & Co. can absorb policy noise, digest M&A and still hold its uptrend through those swings, it would be acting in line with a 10-for-10 pattern that has favored long exposure in this part of the election cycle.
Sources
- Forbes: Why Is Merck Stock Surging? (Nov 26, 2025)
- Seeking Alpha: Key deals this week: Merck, Glencore, CrowdStrike, Marvell Technology, Steel Dynamics and more (Jan 10, 2026)
- Reuters: Merck forecasts 2026 sales below estimates on patent losses (Feb 3, 2026)
- CNBC: Merck beats quarterly estimates on strength of Keytruda and new products, narrows outlook (Apr 30, 2026)
- Reuters: Merck posts higher third-quarter sales as Keytruda growth offsets drop from Gardasil (Oct 30, 2025)
- Reuters: Merck says new growth opportunities to drive revenue of $70 billion by mid-2030s (Jan 13, 2026)
- Reuters: Merck nears $6 billion acquisition of Terns Pharma to boost cancer portfolio, FT reports (Mar 25, 2026)
- Forbes: Is Merck Stock’s Run Legitimate? (Dec 24, 2025)
About this seasonal analysis
Seasonal pattern data is sourced from TradeWave.ai, which analyzes historical price behavior across annual calendar windows going back up to 30 years. Read the full data methodology or the book The 100-Year Pattern by Afshin Moshrefi (2026 edition). Past performance of seasonal patterns does not guarantee future results. This article is for informational purposes only and does not constitute investment advice.