Memory Squeeze From AI Data Centers Tests Margins, but Apple (AAPL) Enters Strong Seasonal Stretch
Apple shares are pulling back from record territory even as the stock approaches a long seasonal window that has often delivered outsized gains and sharp swings.
Price as of Jun 25, 2026: $279.39 (intraday).

What is the seasonal pattern for Apple (AAPL)?
Apple has risen in 34 of 45 years during this 337-day window, with an average gain of 58.11% in winning years.
- 34 wins vs 11 losses in this window, with winning years averaging 58.11% gains and all years averaging 39%.
- The upcoming seasonal window starts on Oct 3, 2026 and runs for 337 trading days, forming a long bullish regime in Apple’s historical seasonality.
- Percent Profitable stands at 76%, with 34 winners and 11 losers across 45 years of AAPL seasonal trend data.
- Avg Profit reflects winners only at 58.11%, while Avg Profit - All, which includes losing years, is still a hefty 39%.
- Individual years have seen maximum favorable moves above 150% and adverse drawdowns near 40%, underscoring both upside potential and real downside risk.
- The TradeWave Ratio of 1.07 and a Sharpe ratio of 0.65 point to a historically strong but volatile long-side trading window for Apple.
According to historical data from TradeWave.ai, Apple’s behavior in this long autumn-to-late-summer stretch has been anything but random, with a clear long-side bias that stands out from typical calendar months.
How strong is Apple’s upcoming 337-day seasonal window?
Apple has risen in 34 of the past 45 iterations of this 337-day window, with winning years averaging 58.11% gains and all years averaging 39%. The next run of this pattern begins on Oct 3, 2026, at a time when the stock is trading at $279.39, about 11.8% below its 52-week high of $317.40 and roughly 41.6% above its 52-week low.
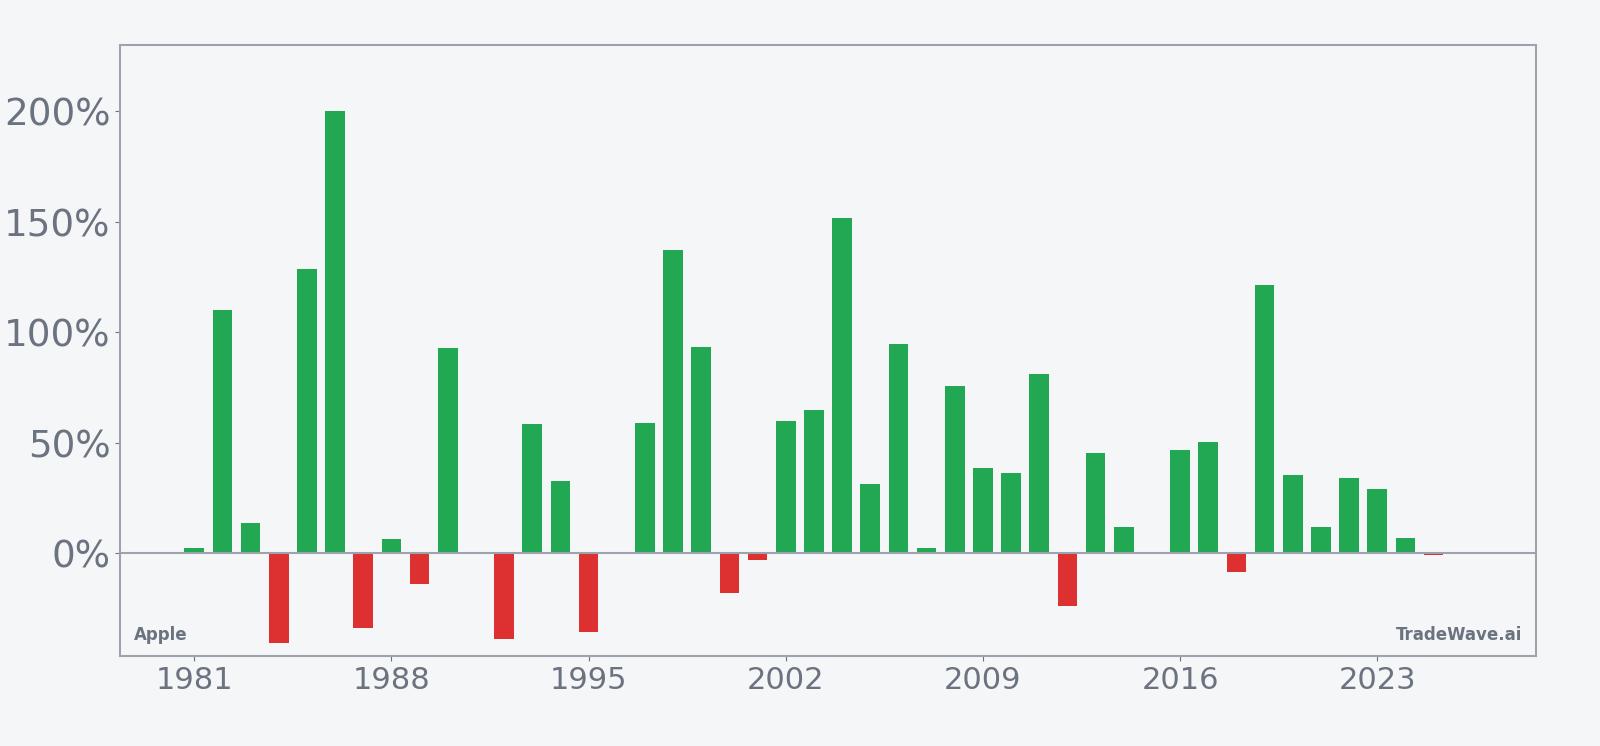
For this long window the trade direction is explicitly long, and the historical record backs that up. Across 45 years, 34 seasons finished higher and 11 ended lower, giving a 76% win rate for long exposure. Average gains in the winning years came in at 58.11%, while including the losing years pulls the all-years average down to 39%, still a strong result for such a long stretch.
The distribution of outcomes shows why traders care about the distinction between winners and all years. The average loss across down seasons was -19.85%, so when the pattern has failed it has not been a mild drift lower. In 2018, for example, Apple finished the window down 8.46%, with a worst intraperiod drawdown of about -38.6% from the entry point, even though the maximum favorable move was barely positive.
On the upside, some years have been explosive. In 2019, Apple’s net gain over the window was 121.28%, with a maximum favorable excursion of 152.42% and only a -3.2% worst drawdown from entry. That kind of profile, where the best run-up dwarfs the worst pullback, is what lifts the TradeWave Ratio to 1.07 and supports a positive Sharpe ratio of 0.65 despite the volatility.
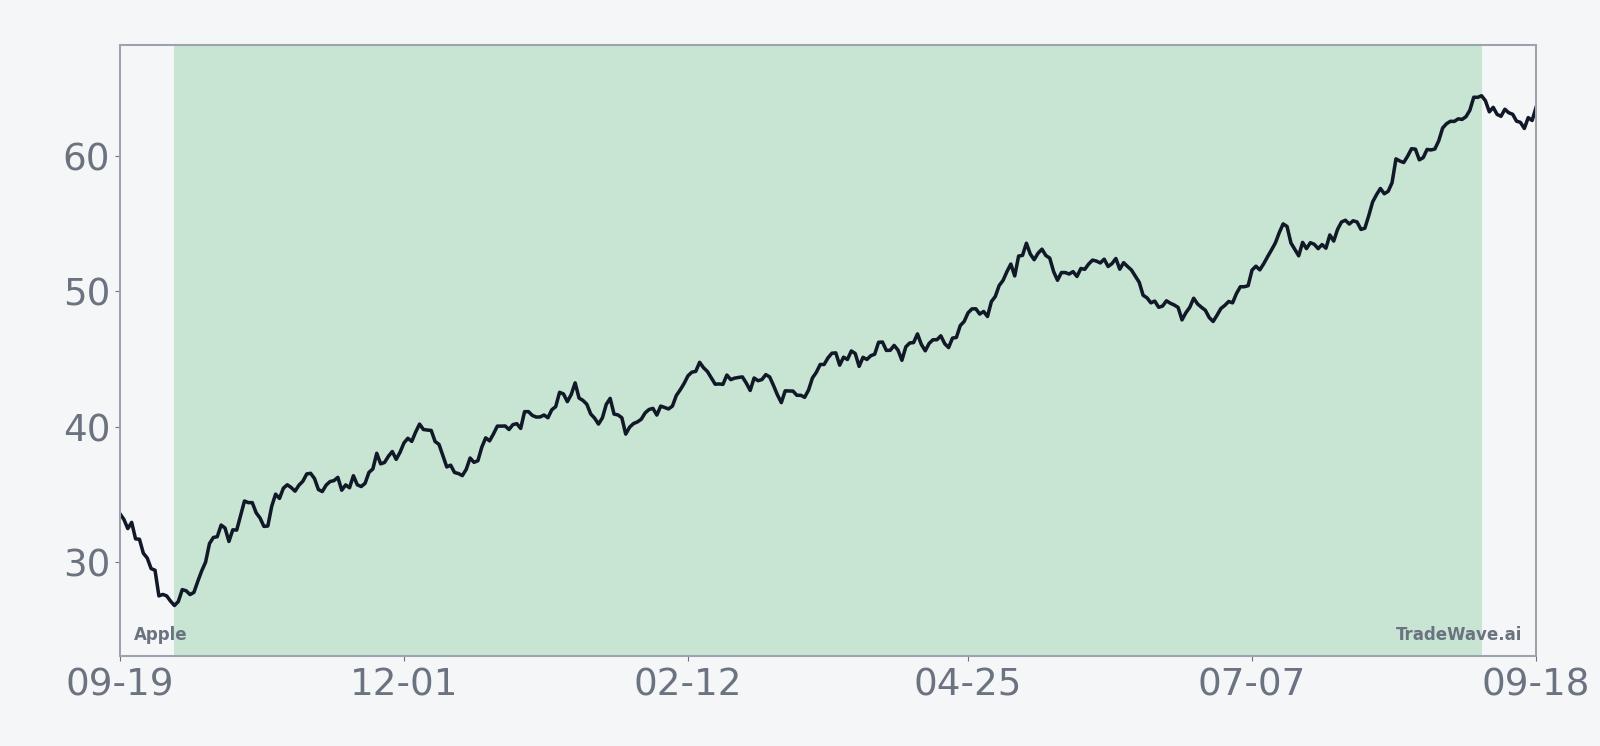
The 45-year seasonal trend chart shows a pattern of gains that tend to build over the life of the window rather than arriving in a single burst. The average path slopes higher, with periods of consolidation, which fits a long regime where multiple product cycles, earnings reports and macro turns play through.
A stacked view of yearly net returns alongside best and worst excursions shows how often big upside has come with meaningful drawdowns.
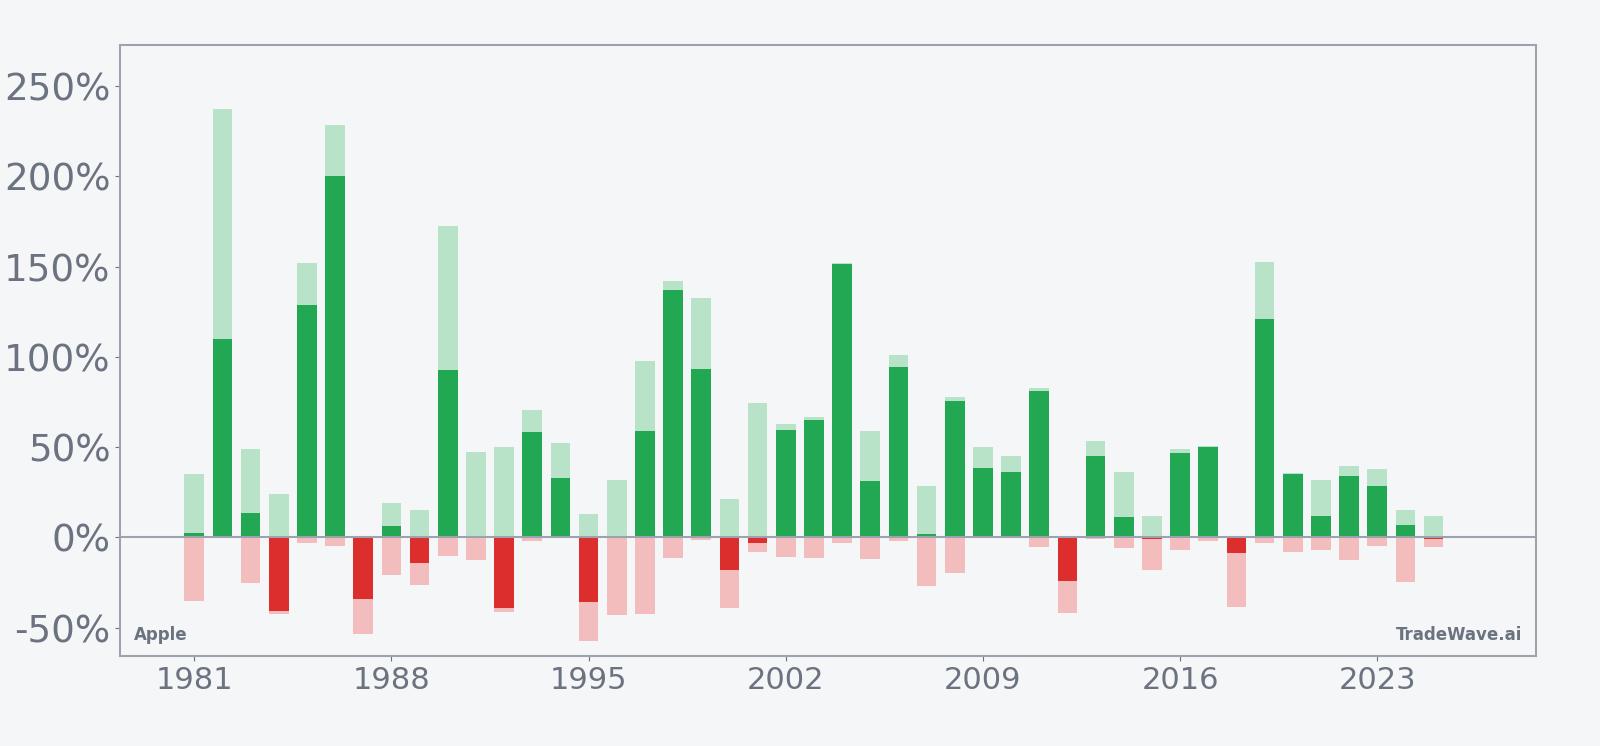
The stacked bars of net return, maximum favorable move and maximum adverse move make the trade-off clear. Many winning years show large positive excursions with relatively contained drawdowns, but others, like 2024, pair a modest 6.75% net gain with a -24.85% worst drawdown inside the window. That mix of strong upside and real downside is what defines this as a powerful but high-variance long window rather than a smooth grind higher.
History does not guarantee future results; adverse excursions (MAE) can be large even in winning windows.
Why does Apple (AAPL) follow this seasonal pattern?
One likely driver is the way Apple’s product and earnings calendar clusters around the fall iPhone launch and holiday quarter, which often sets the tone for the following year. Institutional portfolio rebalancing around fiscal year-ends and benchmark changes can amplify those moves, especially for a mega-cap that dominates major indices. The pattern may also reflect recurring cycles in consumer electronics demand, where upgrade waves and services growth tend to build over multi-quarter stretches that line up with this long window.
What is driving Apple (AAPL) today?
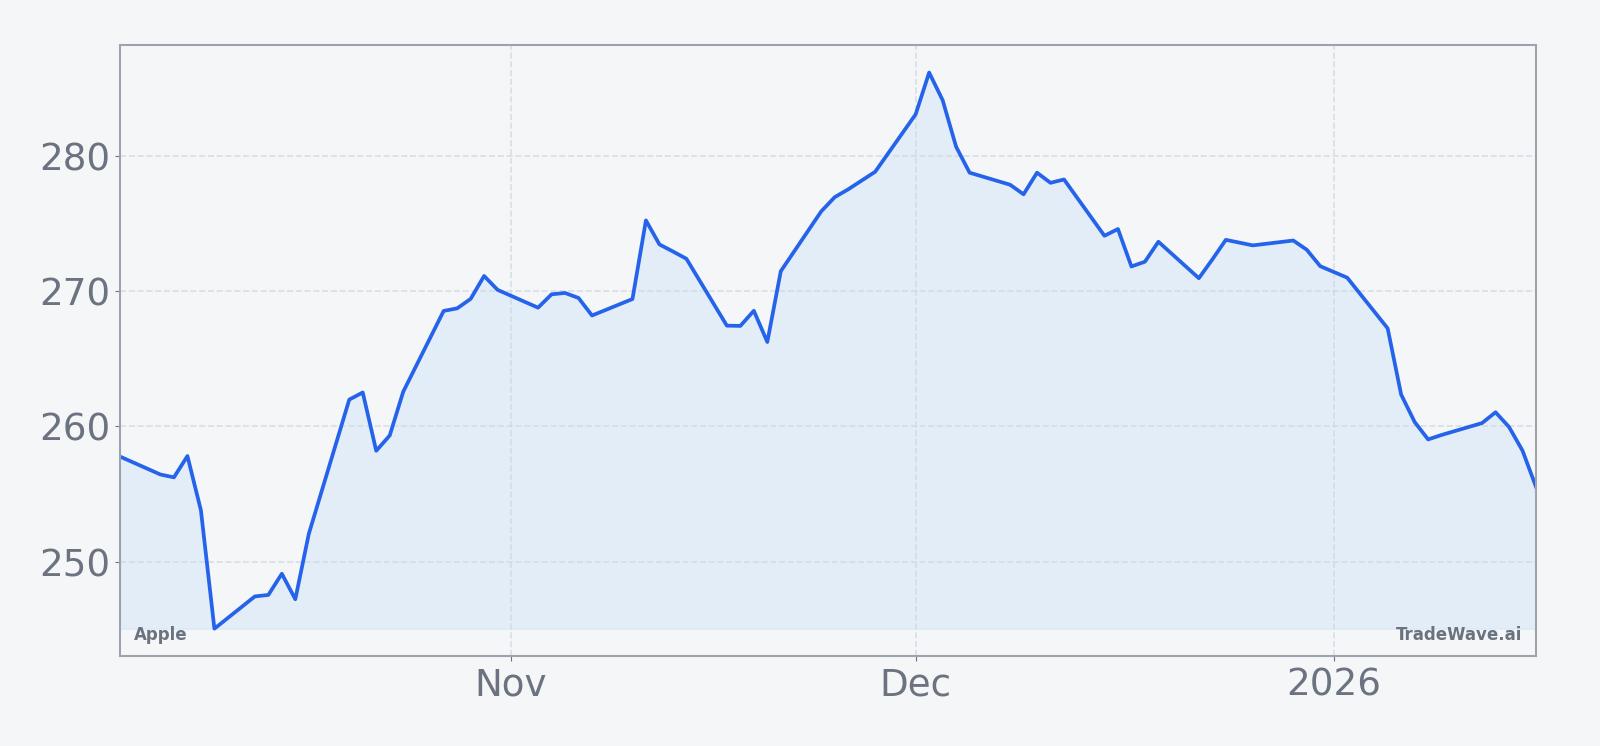
Apple closed Thursday at $279.39, down 4.5% on the day, after trading between $278.52 and $288.80 in a heavy session that saw roughly 12.1 million shares change hands. That leaves the stock about 11.8% below its 52-week high of $317.40 and roughly 41.6% above its 52-week low, a pullback that comes after a strong multi-quarter run tied to iPhone 17 and growing AI expectations.
The latest fundamental check-in came on Apr 30, when Apple reported fiscal Q2 revenue of $111.2 billion and EPS of $2.01, topping Bloomberg consensus on both lines as iPhone and Greater China demand surprised to the upside.[1] iPhone revenue reached $56.99 billion, Services hit $30.97 billion and Greater China delivered $20.49 billion, reinforcing the idea that Apple’s core hardware and ecosystem engines are still running hard.[1] Management commentary around “extraordinary” iPhone 17 demand helped frame 2026 as another big product-cycle year rather than a late-cycle fade.
Back in January, Apple projected 13% to 16% revenue growth for the March quarter, again leaning on iPhone strength and services momentum, according to earnings call coverage.[3] That guidance, while dated, set the tone for the current fiscal year and helped underpin bullish calls that framed Apple as a key AI hardware and software platform rather than just a smartphone maker.[6] In February 2026, Wedbush described a prior Apple sell-off as “unwarranted” and argued that 2026 would be the company’s year of AI, highlighting the role of on-device intelligence and cloud tie-ins in the iPhone 17 cycle.[6]
Short interest remains low, with a value of about 0.74% reported in earlier data snippets, suggesting there is not a large cohort of investors betting aggressively against the stock.[5] That limited bearish positioning can cut both ways: it reduces the risk of a violent short squeeze but also means there is less built-in buying fuel if sentiment turns sharply higher.
The chart below situates the latest move in its recent multi-month context and overlays a short-term seasonal projection.
How do earnings, AI and macro themes intersect with this seasonal trend?
Apple’s upcoming seasonal window will span at least three earnings reports, including the critical holiday quarter that captures iPhone and services demand. In April, the company’s Q2 beat showed that iPhone 17 and Greater China remain key swing factors for revenue and sentiment.[1] Earlier, management’s projection of double-digit March-quarter growth signaled confidence that the current cycle has legs, even if the exact numbers are now in the rearview mirror.[3]
Analysts have framed 2026 as a pivotal year for Apple’s AI positioning, with firms like Wedbush arguing that on-device AI and ecosystem integration could unlock a new wave of hardware and services upgrades.[6] That narrative matters for the seasonal pattern because the 337-day window starting in October will likely capture the market’s verdict on Apple’s AI execution, from developer tools to consumer-facing features. If AI features drive higher average selling prices or services attach rates, the historical tendency for strong gains in this window could intersect with a powerful fundamental story.
On the macro side, Apple and the broader smartphone and PC complex are navigating a global memory shortage tied to AI data center build-out, which could pressure margins if component costs stay elevated.[1] For a company that ships hundreds of millions of devices, even small shifts in memory pricing can move the needle on gross margin. That adds another layer of volatility potential inside a window that has already shown large maximum favorable and adverse moves in prior years.
What should traders watch as this seasonal window approaches?
First, watch how Apple trades around key levels in the coming months. The 52-week high near $317.40 is the obvious upside reference, while the 50-day moving average around $290.63 and the recent close at $279.39 frame the current consolidation zone. A sustained break back above the 50-day and toward the highs would signal that the pullback is being bought ahead of the October seasonal window, while a deeper slide toward the lower end of the recent range would set up a very different starting point.
Second, earnings and guidance will be crucial markers inside this Apple trading window. The next few quarters will show whether the strong Q2 beat and earlier double-digit growth projections were the start of a durable trend or a high-water mark.[1][3] Investors will be looking for evidence that iPhone 17 demand is holding up, that services growth remains robust and that AI features are driving incremental monetization rather than just marketing buzz.[6]
Third, monitor how macro and supply-chain headlines evolve around memory and other key components. If the global memory shortage tied to AI data centers eases, Apple could see margin relief that supports the kind of strong upside excursions seen in years like 2019.[1] If shortages worsen or pricing spikes, the historical pattern of sizable intraperiod drawdowns could reassert itself even in an otherwise positive year.
Finally, keep an eye on positioning and sentiment. With short interest still low around 0.74%, any shift toward heavier shorting or a wave of downgrades would mark a change from the backdrop that has accompanied many of the strong historical years.[5][7] Inside a window that has often delivered big moves in both directions, how investors are positioned going into October may matter as much as the calendar itself.
Sources
- Yahoo Finance: Apple tops Q2 earnings estimates on strong iPhone, China sales (Apr 30, 2026)
- CNBC: Apple gets price target boost from JPMorgan ahead of earnings thanks to strong iPhone demand (Jan 26, 2026)
- Seeking Alpha: Apple projects 13%-16% revenue growth for March quarter as iPhone demand drives record results (Jan 29, 2026)
- CNBC: 3 reasons Apple deserves its initiation into the $4 trillion club — and what to expect next (Oct 29, 2025)
- Seeking Alpha: Apple plans new features for iPhone satellite services: report (Nov 10, 2025)
- Seeking Alpha: Apple sell-off 'unwarranted,' as Wedbush says 2026 is the tech giant's year of AI (Feb 17, 2026)
- Bloomberg: Apple analyst sentiment hits five-year low after two downgrades (Sep 11, 2025)
- Barchart: Apple's Free Cash Flow Surges, Implying AAPL Stock Could Be 20% Too Cheap (Nov 2, 2025)
- MarketWatch: With Apple stock near a record high as earnings loom, here’s the options trade to make (Oct 20, 2025)
- CNBC: Apple gave up its earnings pop. How to trade it from here (Oct 31, 2025)
- Seeking Alpha: Apple expected to report 'good headline numbers' says Wedbush, commentary on iPhone 17 to watch out for (Jul 30, 2025)
- Morningstar / PR Newswire: Apple investigation initiated by former Louisiana Attorney General (Aug 16, 2025)
About this seasonal analysis
Seasonal pattern data is sourced from TradeWave.ai, which analyzes historical price behavior across annual calendar windows going back up to 30 years. Read the full data methodology or the book The 100-Year Pattern by Afshin Moshrefi (2026 edition). Past performance of seasonal patterns does not guarantee future results. This article is for informational purposes only and does not constitute investment advice.