10-for-10 Midterm Streak: Merck & Co. (MRK) Enters a 301-Day Window With 100% Profitable Years
Merck & Co. is trading near record territory as it approaches a 301-day midterm-election-year seasonal window that has never been negative in the last 10 cycles, just as investors weigh guidance, M&A and looming patent pressure.
Price as of Jun 26, 2026: $128.66 (last close).

What is the seasonal pattern for Merck & Co. (MRK)?
Merck & Co. has risen in 10 of 10 midterm-election-year windows starting Jul 23 and lasting 301 calendar days, with an average gain of 30.61% in winning years.
- 10 for 10 in this window, with Merck & Co. averaging 30.61% gains across all winning years.
- Seasonal window starts Jul 23 and runs 301 calendar days, covering the back half of the midterm election year into the pre-election year.
- Percent Profitable is 100%, with 10 winners and 0 losers across the last 10 midterm-election-year cycles.
- Median profit of 34.05% and a TradeWave Ratio of 2.11 point to strong upside travel in the trade direction.
- Sharpe ratio of 1.83 signals a historically favorable risk-adjusted profile for long exposure during this MRK seasonal trend.
- Individual years have still seen drawdowns inside the window, so timing and risk management matter even in a strong pattern.
According to historical data from TradeWave.ai, this upcoming stretch for Merck & Co. behaves very differently from an average year, with a distinct midterm-election-year bias that has repeated across decades.
How has Merck & Co. (MRK) traded in this midterm-year window?
Merck & Co. has posted gains in every one of the last 10 midterm-election-year windows that begin on Jul 23 and run for 301 calendar days, averaging a 30.61% profit for long positions. Shares finished Monday at 128.66, up 2.6% on the day and sitting just below a fresh 52-week high of 128.78. That puts the stock about 79.3% above its 52-week low of 71.78, underscoring how strong the backdrop has been heading into this historically powerful Merck & Co. trading window.
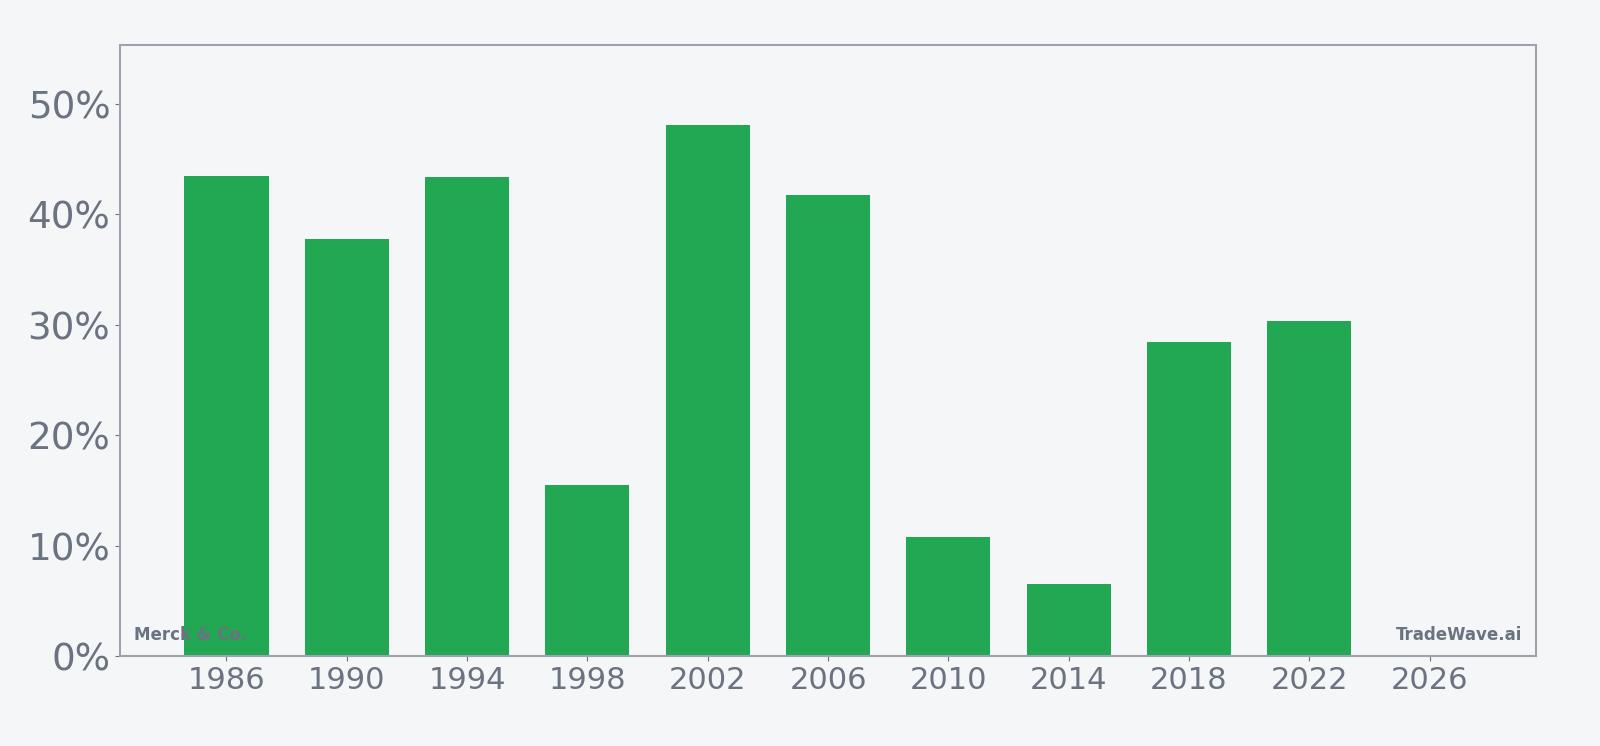
Grouping the data by the presidential election cycle matters here because this window always starts late in a midterm election year and runs into the year before the presidential election, a phase that has often coincided with friendlier policy tone and stronger risk appetite. In this specific midterm-year slice, the Trade Direction is long, and every one of the 10 historical iterations delivered a positive net return for that stance. The median profit of 34.05% sits slightly above the average, which suggests the MRK seasonal trend has not been skewed by just one or two outlier years.
Looking at individual cycles, the strongest year in this sample was 2002, when a long position in this 301-day window would have gained 48.10%, with a best intraperiod run-up of 56.55% and only a 1.25% worst drawdown from entry. At the other end of the spectrum, 2014 still finished higher by 6.56%, but the stock experienced a 9.01% adverse move at one point, showing that even “winning” years can feel uncomfortable along the way. Across the full set, the standard deviation of 14.96% and a Sharpe ratio of 1.83 point to a historically strong risk-adjusted profile rather than a coin-flip stock pattern analysis.
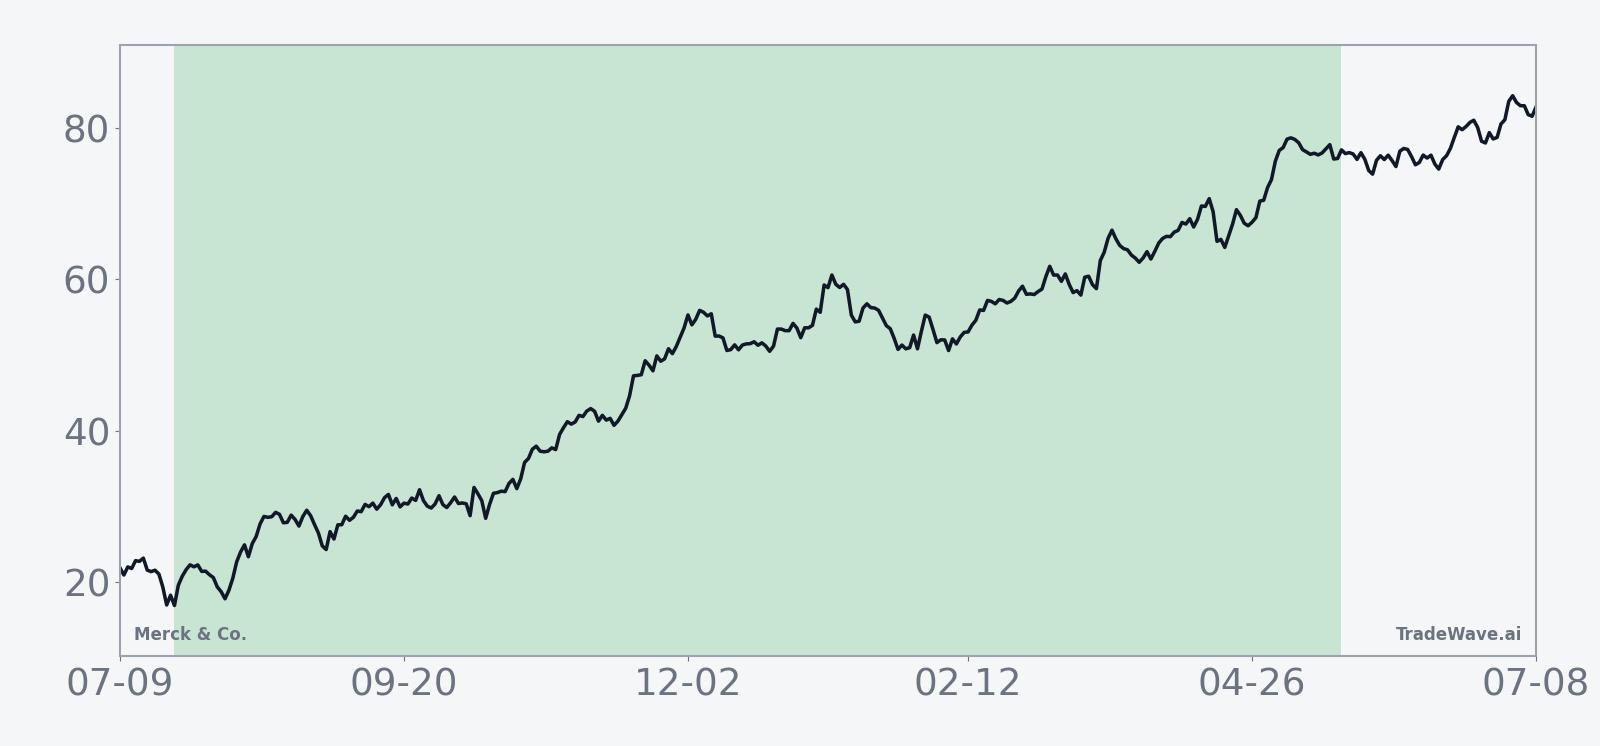
The historical seasonal average shows gains building steadily rather than in a single burst, with the trend line climbing through much of the window and only modest pauses. That fits with the long bias in the stats, where Trend Long and Trend Long1 readings are both in the 70s, indicating that MRK has tended to spend most of this period grinding higher rather than chopping sideways. For investors tracking healthcare sector seasonal outlooks, this pattern suggests that once the window opens, strength has often persisted well into the following pre-election year.
Year-by-year bars with peak run-ups and worst drawdowns show how much MRK has typically moved inside the window before settling at its final gain.
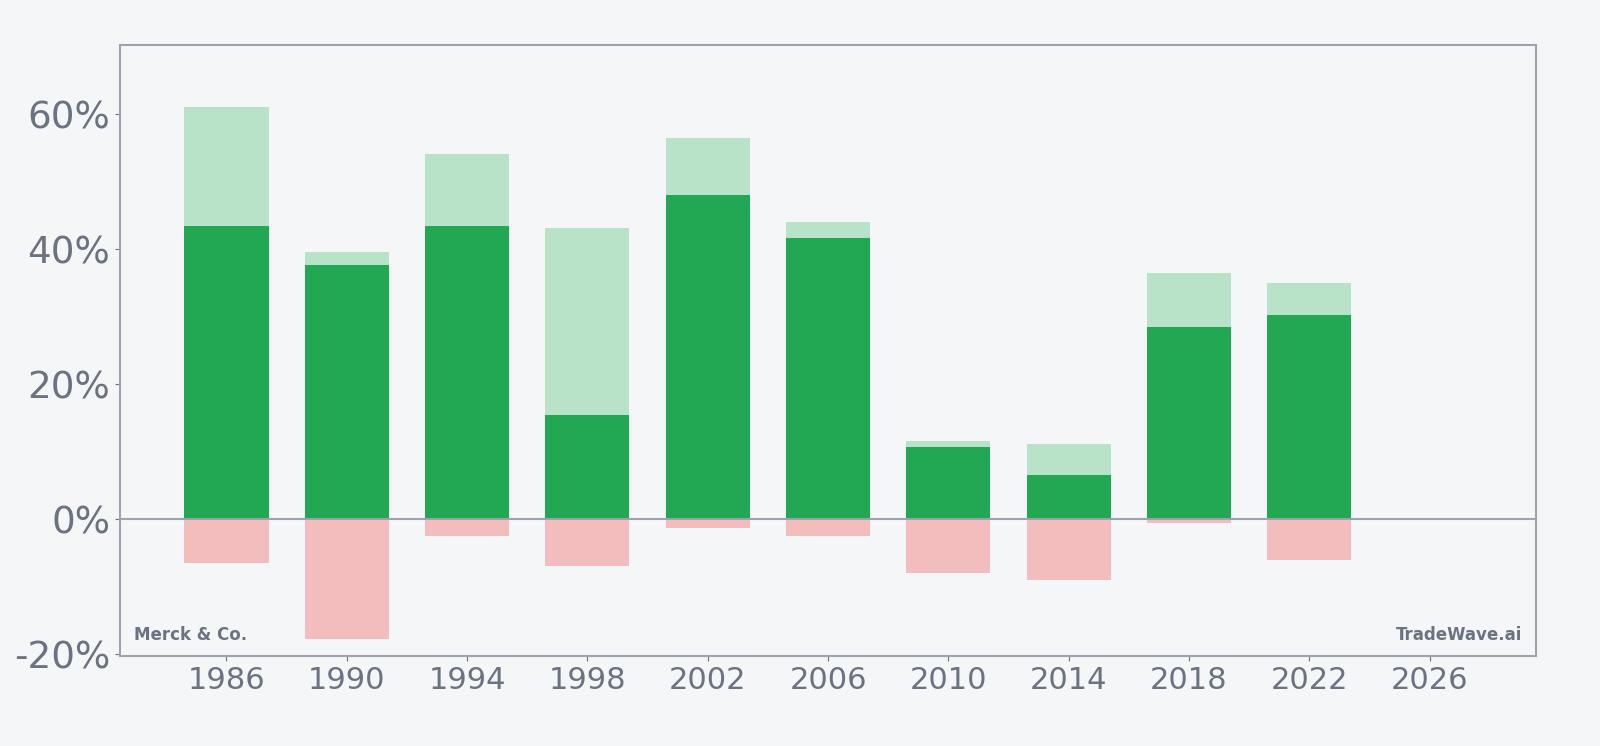
The combined net/MFE/MAE view shows that in many years MRK’s best intraperiod move has run well ahead of the final gain, consistent with a TradeWave Ratio of 2.11 that signals meaningful travel in the trade direction inside the window. At the same time, several years feature adverse excursions in the mid-to-high single digits, and 1990 saw a 17.65% worst drawdown even though the trade still finished up 37.75%. Add it up: this has been a powerful long-biased Merck & Co. seasonal pattern, but one that has demanded a strong stomach when volatility hits.
History does not guarantee future results; adverse excursions can be large even in winning windows, and past seasonal strength does not ensure similar outcomes for upcoming cycles.
Why does Merck & Co. (MRK) follow this seasonal pattern?
One likely driver is the way Merck’s earnings calendar and drug trial news tend to cluster in the back half of the midterm election year and into the year before the presidential election, when risk appetite across equities has often been stronger. Analysts have also pointed to institutional portfolio repositioning around healthcare policy and drug pricing debates in Washington, which can ease as the political focus shifts toward the presidential race. For a large pharma name like Merck & Co., that combination of earnings visibility, sector rotation and a friendlier macro policy tone may help explain why this long midterm-year window has repeatedly favored the bulls.
What is driving Merck & Co. (MRK) today?
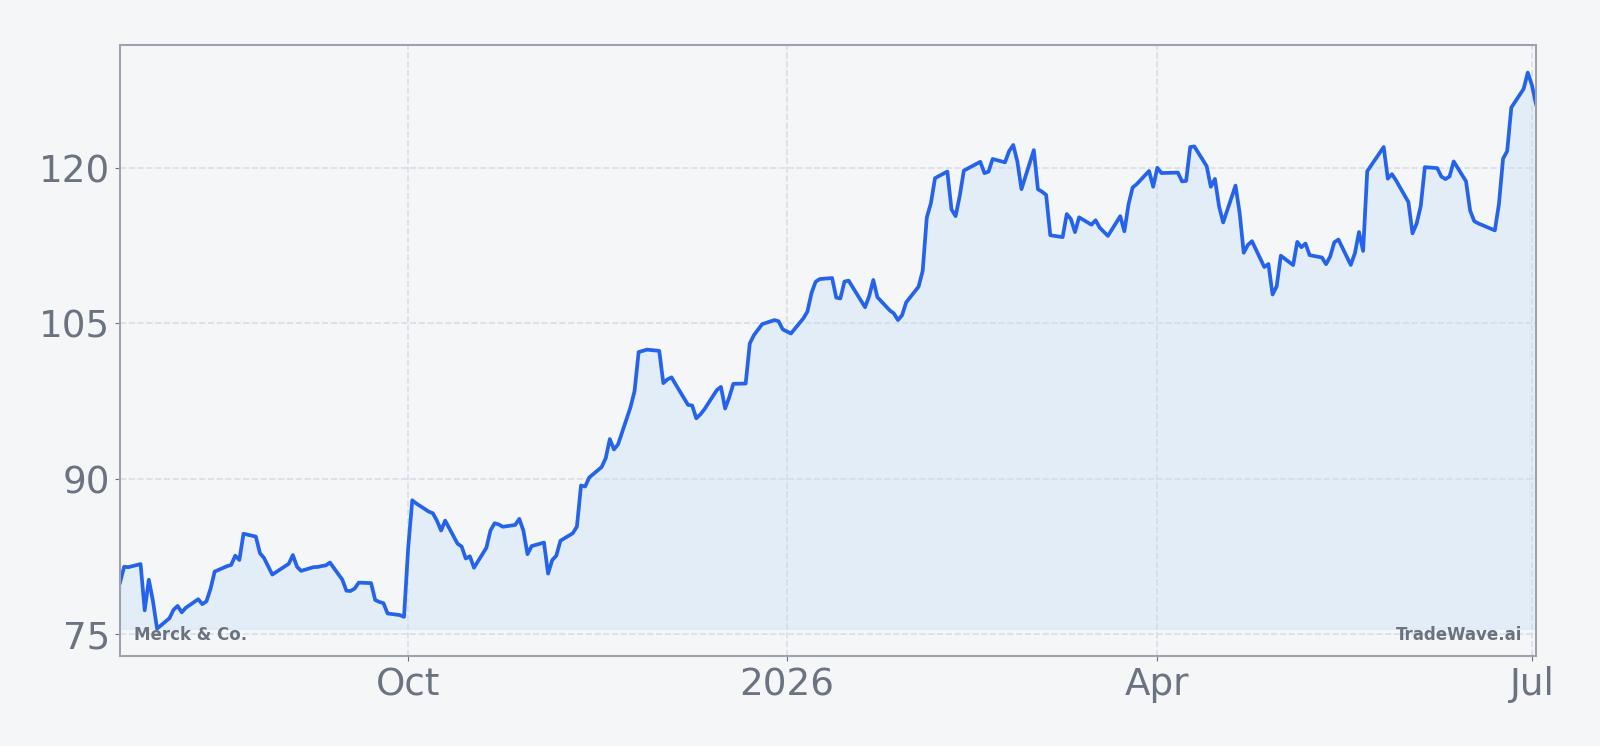
Merck & Co. closed at 128.66 on Monday, up 2.6% on the session, with the stock trading about 0.1% below its 52-week high of 128.78 and roughly 79.3% above its 52-week low of 71.78. The move extends a run that has been fueled by a string of earnings beats and guidance tweaks, including Q1 2026 results in late April that topped revenue expectations, narrowed full-year sales guidance to 65.8 billion to 67.0 billion dollars and lifted the adjusted earnings outlook to 5.04 to 5.16 dollars per share.[4] That report also reinforced the message that new products and pipeline assets are starting to offset looming patent expiries on legacy drugs.
In April, CNBC reported that Merck’s Q1 2026 revenue reached 16.29 billion dollars versus 15.82 billion expected, even as the company posted an adjusted loss per share of 1.28 dollars tied to acquisition-related charges and research spending.[4] Management used that update to reiterate that 2026 will be a transition year, with patent losses and U.S. pricing reforms weighing on some franchises while oncology and other growth drivers scale up. For a stock already near record highs, that mix of solid execution and acknowledged headwinds is central to how investors frame risk heading into the next MRK seasonal trend.
Macro and policy forces are part of the story. Reuters has highlighted how loss of exclusivity on drugs such as Januvia and Janumet, combined with Medicare price negotiations under the Inflation Reduction Act, are expected to pressure Merck’s 2026 sales, which the company has guided below prior Wall Street estimates.[3] At the same time, Merck has been leaning into oncology-focused M&A, with Reuters reporting in March that the company was nearing a roughly 6 billion dollar all-cash deal for Terns Pharma to bolster its cancer portfolio ahead of Keytruda’s patent expiry.[12] Those moves fit a broader sector playbook in which big pharma uses deals and pipeline bets to defend earnings power as pricing and patent cycles turn.
The chart below situates the latest move in its recent multi-month context, alongside a short-term seasonal projection.
Longer term, Merck has been explicit about its ambition to replace and exceed Keytruda-era revenue. In January, Reuters reported that the company projected 70 billion dollars in revenue from new growth drivers by the mid-2030s, including roughly 20 billion from cardiometabolic and respiratory products and about 15 billion from infectious disease therapies.[6] That strategic roadmap, combined with ongoing talks and deals such as the potential 30 billion dollar purchase of Revolution Medicines reported earlier this year,[2] helps explain why investors have been willing to look through near-term patent and pricing pressure as they assess the healthcare sector’s seasonal outlook into the next election phase.
For traders watching MRK’s seasonal pattern, the key tension is straightforward. The stock is already in a powerful uptrend, with 20-day average volume around 13.1 million shares and a 50-day moving average near 114.50, which sits well below the current price. The historical midterm-year window that opens on Jul 23 has never produced a losing year in this dataset, but it has included sharp intraperiod swings. How Merck trades around upcoming policy headlines, drug-pricing developments and any additional M&A will shape whether this cycle rhymes with the past or breaks the pattern.
What should traders watch as this MRK seasonal window approaches?
First, the calendar. The 301-day window starting Jul 23 spans the late stages of the midterm election year and runs deep into the year before the presidential election, a phase that has often coincided with friendlier conditions for large-cap healthcare. Traders will be watching how MRK behaves around that start date, especially if the stock remains pinned near its highs when the window opens. A firm hold above the 50-day moving average and continued support on pullbacks would be one sign that behavior is tracking the historical pattern.
Second, the policy and earnings tape. Any fresh detail on Medicare price negotiations, additional guidance updates or commentary on patent cliffs could either reinforce or challenge the bullish historical seasonality. The next few quarters of results will show whether Merck’s forecast of 65.8 billion to 67.0 billion dollars in 2026 revenue and its upgraded earnings outlook remain intact as pricing and competition bite.[3][4] Strong execution against that backdrop would align with the long-biased MRK seasonal trend; negative surprises or regulatory shocks would be the clearest way to break it.
Third, volatility inside the window. Historical MFE and MAE readings show that even in winning years, MRK has often swung several percentage points against the trade before finishing higher. Traders may want to track how deep any pullbacks run once the window opens and whether those dips are met with buying interest similar to prior cycles. If the stock starts to log larger and earlier drawdowns than the historical pattern, that would be an early sign that this iteration is behaving differently.
Finally, sector and macro tone. Because this window bridges the midterm election year into the pre-election year, broader risk appetite around healthcare, rates and fiscal policy will matter. If the market leans into a classic pre-election-year risk-on playbook, MRK’s role as a defensive growth name with a heavy oncology tilt could keep it in demand. If instead investors rotate away from big pharma on policy or valuation concerns, the stock could diverge from its 10-for-10 seasonal record even as the broader election-cycle framework remains in place.
Sources
- Forbes, “Why Is Merck Stock Surging?”, Nov 26, 2025. Link
- Seeking Alpha (SA News), “Key deals this week: Merck, Glencore, CrowdStrike, Marvell Technology, Steel Dynamics and more”, Jan 10, 2026. Link
- Reuters, “Merck forecasts 2026 sales below estimates on patent losses”, Feb 3, 2026. Link
- CNBC, “Merck beats quarterly estimates on strength of Keytruda and new products, narrows outlook”, Apr 30, 2026. Link
- Reuters, “Merck posts higher third-quarter sales as Keytruda growth offsets drop from Gardasil”, Oct 30, 2025. Link
- Reuters, “Merck says new growth opportunities to drive revenue of $70 billion by mid-2030s”, Jan 13, 2026. Link
- Reuters, “Merck nears $6 billion acquisition of Terns Pharma to boost cancer portfolio, FT reports”, Mar 25, 2026. Link
- Forbes, “Is Merck Stock’s Run Legitimate?”, Dec 24, 2025. Link
About this seasonal analysis
Seasonal pattern data is sourced from TradeWave.ai, which analyzes historical price behavior across annual calendar windows going back up to 30 years. Read the full data methodology or the book The 100-Year Pattern by Afshin Moshrefi (2026 edition). Past performance of seasonal patterns does not guarantee future results. This article is for informational purposes only and does not constitute investment advice.