This 301-Day Midterm Window Has Delivered 100% Winners for Merck & Co. (MRK)
Merck & Co. is heading into a historically powerful 301-day trading window even as investors weigh patent losses, oncology deals and a stock sitting just off record highs.
Price as of Jul 2, 2026: $129.56 (last close).

What is the seasonal pattern for Merck & Co. (MRK)?
Merck & Co. has risen in 10 of 10 midterm-election-year windows starting around Jul 23, with an average gain of 30.61% in winning years.
- 10 for 10 in this window, with Merck & Co. averaging 30.61% gains across all winning years.
- The upcoming seasonal window begins Jul 23, 2026 and runs for 301 calendar days, spanning the back half of the midterm election year into the pre-election year.
- Percent Profitable is 100%, with 10 winners and 0 losers in the last 10 midterm-election-year cycles.
- Average annualized return in the window is 29.8%, with a Sharpe ratio of 1.83 for this long setup.
- The TradeWave Ratio of 2.11 signals that price has typically traveled meaningfully in the trade direction within the window, not just at the close.
- Individual years have still seen adverse moves inside the window, with historical drawdowns before recovery in several cycles.
According to historical data from TradeWave.ai, Merck & Co. has shown a distinct election-cycle seasonal pattern that looks very different from a typical calendar-year chart. The next section walks through how that pattern has behaved in prior midterm-election years and what that backdrop means for the coming 301-day window.
How has Merck & Co. (MRK) traded in past midterm-year windows?
Merck & Co. has risen in every one of the last 10 midterm-election-year windows that start around Jul 23 and run for 301 calendar days, averaging a 30.61% gain for this long setup. Today the stock closed at $129.56, up 3.3% on the day and sitting about 0.6% below its 52-week high of $130.29. This combination of a near-record price and a historically strong late-midterm-to-pre-election seasonal regime gives traders a very different lens on a name that is already front and center in big pharma.
The pattern is built around the presidential election cycle rather than simple calendar years, grouping together the last 10 midterm-election-year instances for Merck & Co. and following each one forward for 301 calendar days. That means the historical sample captures how the stock has behaved as Washington moves from the midterm election year into the year before the presidential election, a stretch that has often coincided with clearer policy direction and more stable risk appetite for healthcare names.
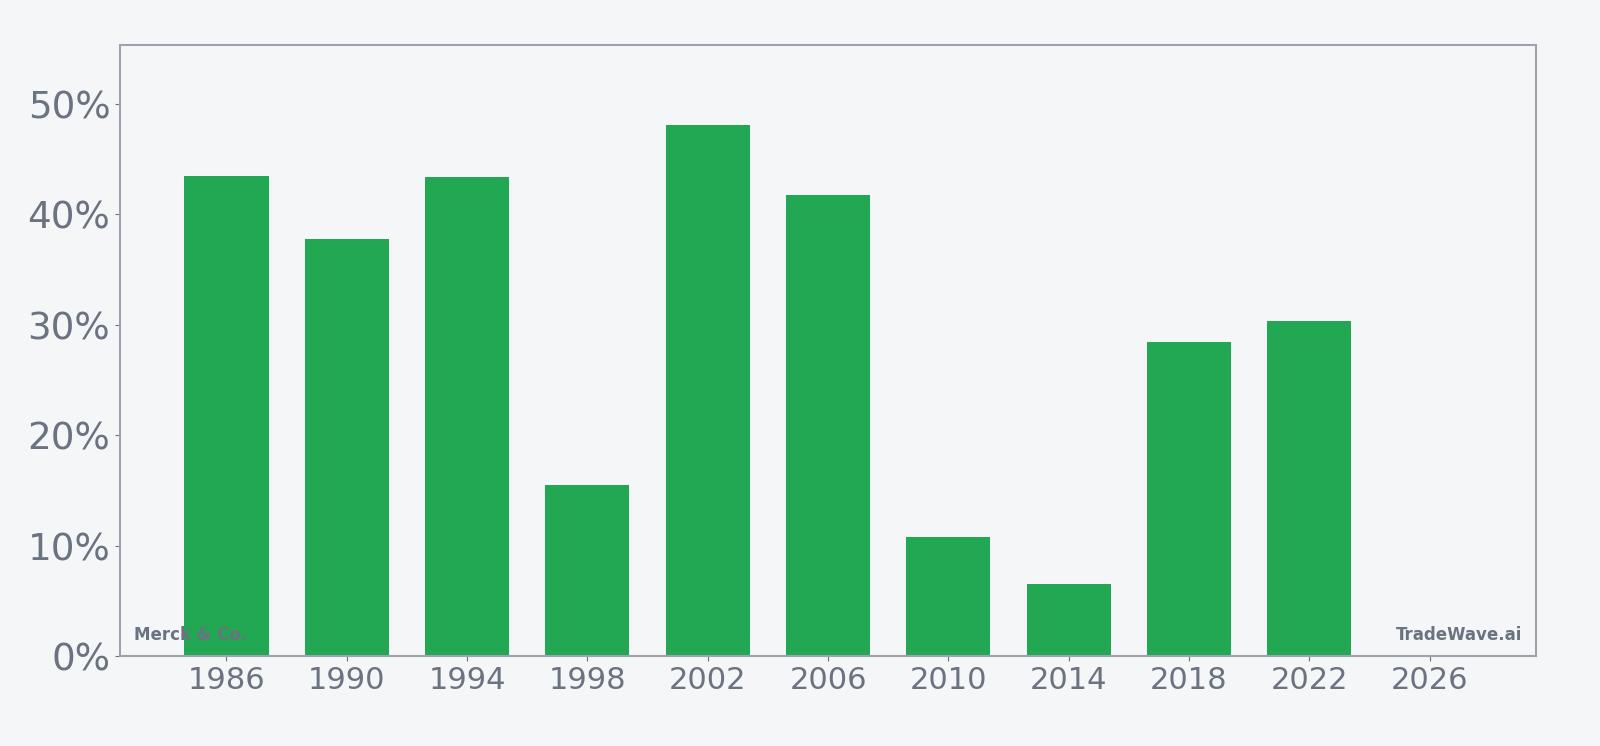
Across the 10 historical midterm-election-year samples, the strongest net return came in 2002, when the stock gained 48.10% over the window, with a maximum favorable move of 56.55% and only a shallow 1.25% worst drawdown from entry. The weakest net outcome was still positive: 6.56% in 2014, a year that saw a peak run-up of 11.11% but a 9.01% adverse move at one point before finishing higher. Even the more modest years like 2010 and 2014 still ended green, which is why the Percent Profitable metric sits at 100% with 10 winners and 0 losers.
The average winner gain of 30.61% lines up with a 29.8% annualized return, which is high for a large-cap pharmaceutical stock over a 301-day span. The Sharpe ratio of 1.83 indicates that, based on end-of-window outcomes, the reward per unit of volatility has been strong for this long pattern. The TradeWave Ratio of 2.11 suggests that within the window, price has typically traveled meaningfully in the trade direction, not just drifted there by the close.
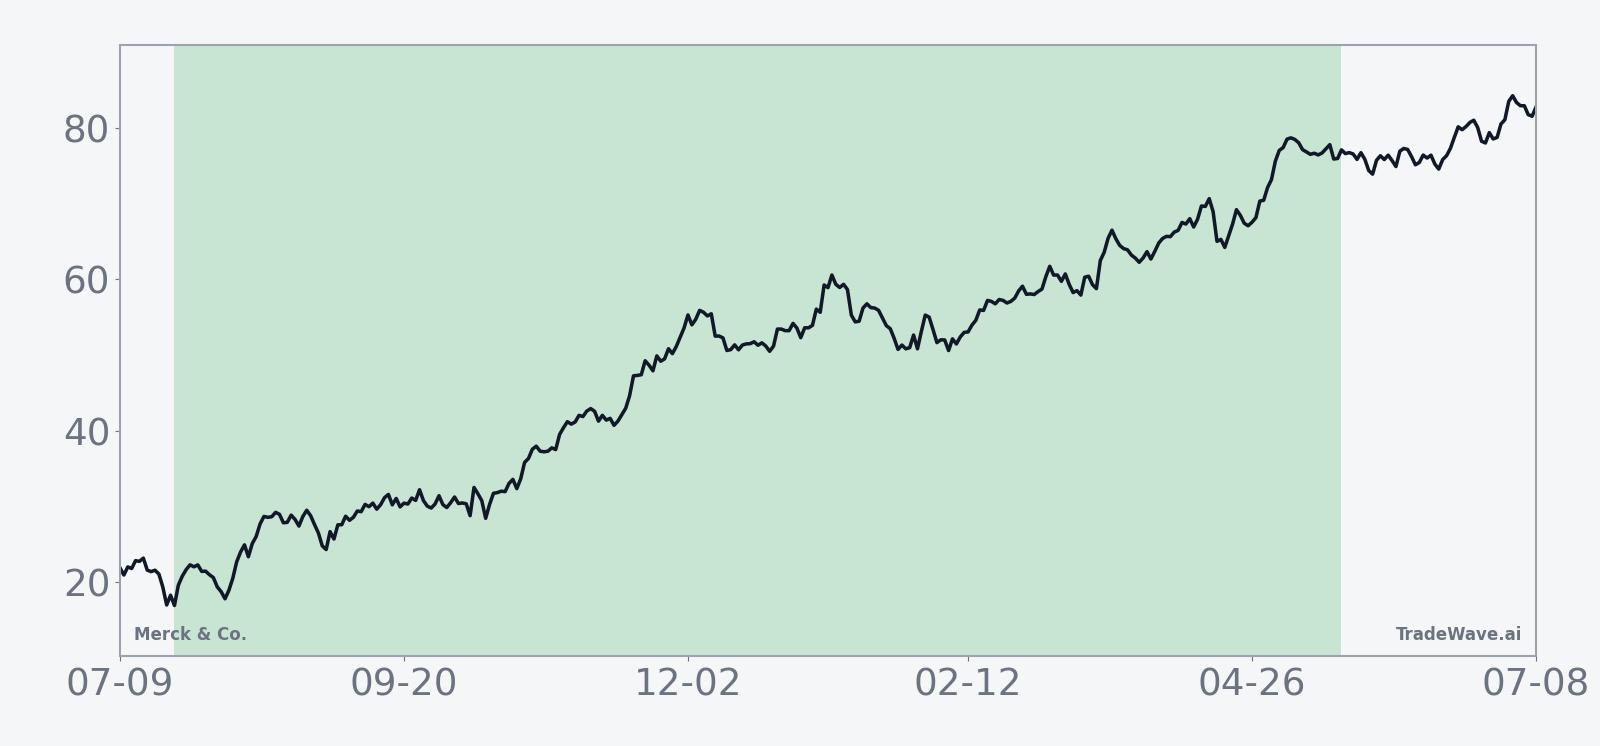
The historical seasonal trend line for this window shows gains that tend to build steadily rather than in a single burst. In several years, including 1986, 1994 and 2006, the stock saw strong advances early in the window that then consolidated, while other years such as 2018 and 2022 showed more of a stair-step pattern with rallies and pauses as the calendar moved from the midterm election year into the pre-election year.
Year-by-year bars with peak and worst intraperiod moves show how upside and drawdowns have coexisted inside this otherwise consistent pattern.
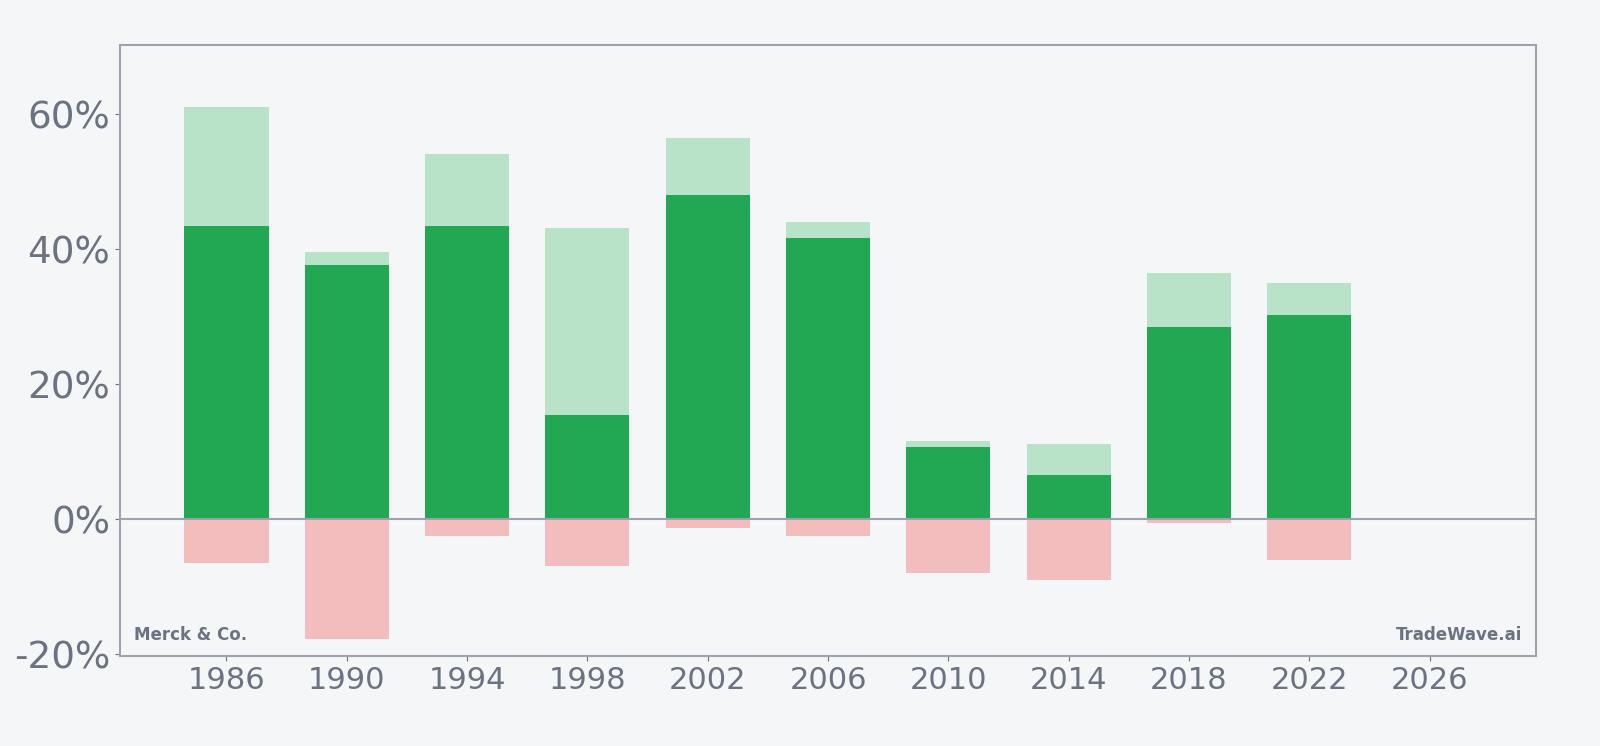
The bar chart that combines net returns with maximum favorable and adverse excursions shows that even in winning years, the ride has not always been smooth. In 1990, for example, Merck & Co. finished the window up 37.75% but experienced a worst intraperiod drawdown of 17.65% from entry before recovering. In 2010, the stock’s best run-up was 11.56% and the worst pullback was 7.97%, underscoring that this has been a positive but still volatile stretch where patience has often been required.
History does not guarantee future results; adverse excursions (MAE) can be large even in winning windows.
Why does Merck & Co. (MRK) follow this seasonal pattern?
This midterm-to-pre-election window for Merck & Co. likely reflects a mix of earnings timing, policy clarity and sector rotation. One likely driver is that major drugmakers often see clearer reimbursement and pricing signals after midterm elections, which can reduce headline risk and support valuations for oncology-heavy portfolios. Analysts have also pointed to institutional portfolio repositioning into defensive growth sectors like pharmaceuticals as the presidential election year approaches, which can funnel steady flows into names such as Merck & Co. during this specific slice of the cycle.
What is driving Merck & Co. (MRK) today?
Merck & Co. closed Friday at $129.56, up 3.3% on the session, after a strong one-month run of 14.59% that has carried the stock to within about 0.6% of its 52-week high. The move comes as investors continue to digest a 2026 revenue outlook of $65.8 billion to $67.0 billion and an adjusted earnings forecast of $5.04 to $5.16 per share, guidance the company narrowed when it reported first-quarter results in late April, while also flagging patent losses as a headwind for legacy products.[3][4]
In April, Merck reported first-quarter 2026 revenue of $16.29 billion, ahead of Wall Street expectations, helped by continued strength from cancer drug Keytruda and contributions from newer products, even as acquisition-related charges produced an adjusted loss per share that was less severe than analysts had feared.[4] Earlier in the year, management had warned that 2026 sales would likely fall short of consensus estimates because of patent expirations and U.S. pricing changes, a reminder that the company is racing to build new growth drivers before Keytruda’s own loss of exclusivity later in the decade.[3]
Strategically, Merck has been leaning into oncology-focused dealmaking to address that looming patent cliff. In January 2026, media reports said the company was in talks to acquire Revolution Medicines for about $30 billion, a move that would deepen its cancer pipeline, and by late March Reuters reported that Merck was nearing a roughly $6 billion all-cash acquisition of Terns Pharma to further bolster its oncology portfolio.[2][6] Those potential and reported deals sit alongside management’s January update that new growth opportunities across cardiometabolic, respiratory and infectious disease franchises could drive about $70 billion in annual revenue by the mid-2030s, underscoring how much of the long-term story now rests on pipeline execution rather than legacy blockbusters.[6]
Macro and policy forces are also in play. In February 2026, Merck’s leadership tied its below-consensus 2026 sales forecast in part to patent losses and Medicare pricing changes, highlighting how U.S. drug-pricing reform is feeding directly into revenue guidance for large pharmaceutical companies.[3] For a stock that investors have often treated as a defensive anchor, that mix of regulatory pressure, M&A risk and a share price near record highs makes the upcoming seasonal window particularly important to watch.
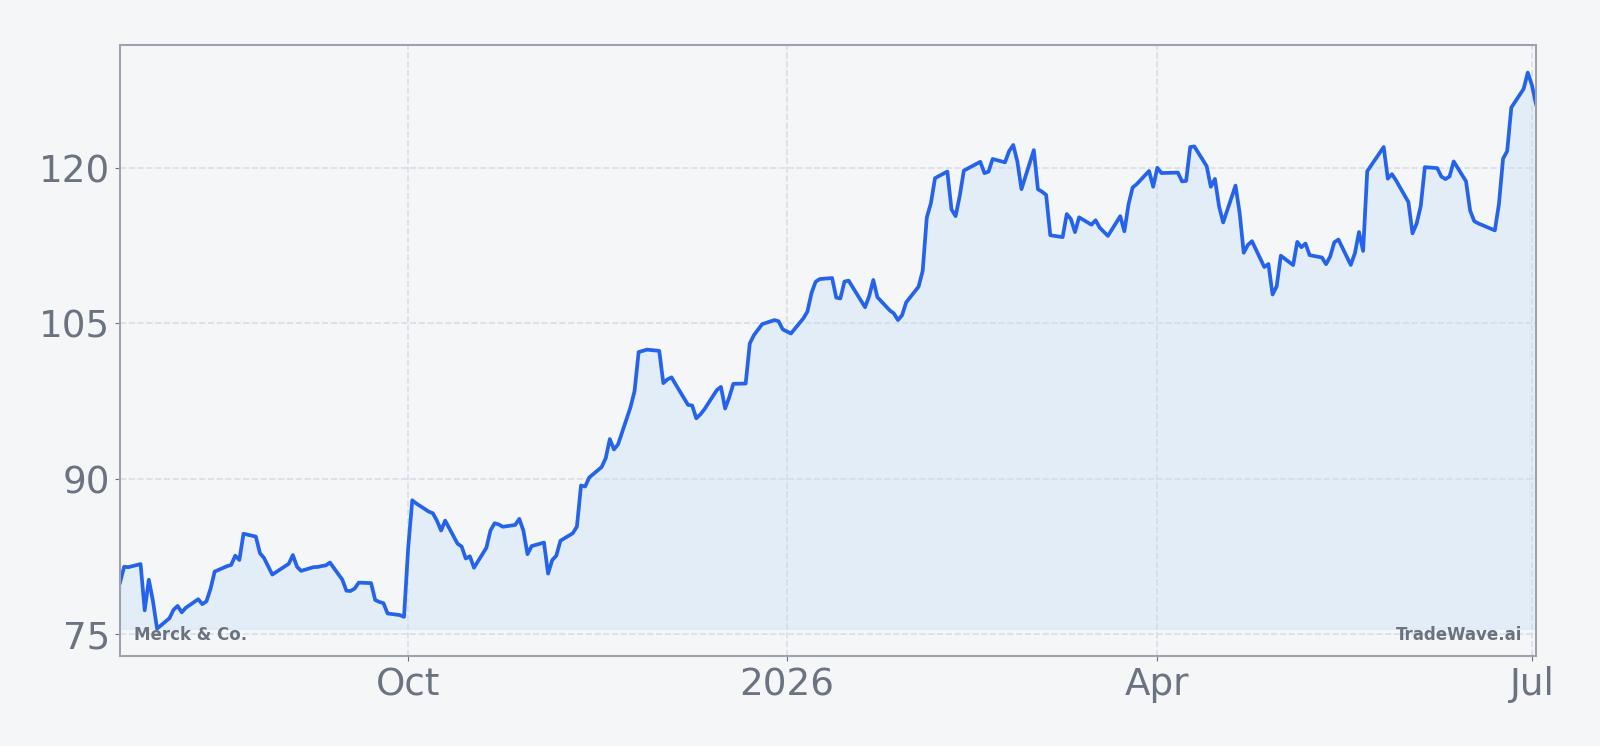
The chart below situates the latest move in its recent multi-month context and overlays a short-term seasonal projection.
What should traders watch as this seasonal window approaches?
First, the calendar. The 301-day midterm-election-year window for Merck & Co. begins on Jul 23, 2026, so the stock is still in the pre-window setup phase. How MRK behaves in the weeks leading into that date will shape the starting point for the pattern: a breakout above the recent 52-week high could mean the next window starts from an extended level, while a pullback toward the 50-day moving average around $115.60 would reset expectations for how much room the historical seasonal trend might have to work with.
Second, the policy and pricing backdrop. Any additional clarity on Medicare drug-price negotiations or broader U.S. healthcare legislation will matter, because the historical pattern is built around midterm-election-year dynamics that often include a shift from uncertainty to more stable rules of the game. Traders will be watching whether upcoming commentary from management sticks to the current 2026 revenue and earnings ranges or whether patent and pricing pressure forces another reset, which could test the stock’s ability to follow its usual midterm-to-pre-election seasonal script.[3][4]
Third, the deal pipeline. Follow-through on the reported Terns Pharma acquisition and any update on the earlier Revolution Medicines talks will be key markers for how aggressively Merck is willing to spend to defend and extend its oncology franchise.[2][6] A steady cadence of pipeline news that supports the company’s long-term $70 billion new-growth-driver target would align with the historically strong seasonal window, while any sign of deal fatigue or regulatory pushback could introduce volatility inside a period that has previously been very friendly to longs.[6]
Finally, price behavior inside the window itself will be the real test of this MRK seasonal trend. Historically, the stock has delivered double-digit gains in this 301-day stretch in every midterm-election-year sample, but several of those years included drawdowns of 7% to 18% along the way. If the next cycle again shows strong rallies with contained pullbacks, it would reinforce the idea that this election-cycle slice remains a sweet spot for Merck & Co.; if instead the stock breaks that 10-for-10 record, it will be a clear signal that the mix of patent pressure, pricing reform and M&A risk has finally overwhelmed one of the cleaner seasonal patterns in big pharma.
Sources
- Forbes, "Why Is Merck Stock Surging?", Nov 26, 2025
- Seeking Alpha (SA News), "Key deals this week: Merck, Glencore, CrowdStrike, Marvell Technology, Steel Dynamics and more", Jan 10, 2026
- Reuters, "Merck forecasts 2026 sales below estimates on patent losses", Feb 3, 2026
- CNBC, "Merck beats quarterly estimates on strength of Keytruda and new products, narrows outlook", Apr 30, 2026
- Reuters, "Merck posts higher third-quarter sales as Keytruda growth offsets drop from Gardasil", Oct 30, 2025
- Reuters, "Merck says new growth opportunities to drive revenue of $70 billion by mid-2030s", Jan 13, 2026
- Reuters, "Merck nears $6 billion acquisition of Terns Pharma to boost cancer portfolio, FT reports", Mar 24, 2026
About this seasonal analysis
Seasonal pattern data is sourced from TradeWave.ai, which analyzes historical price behavior across annual calendar windows going back up to 30 years. Read the full data methodology or the book The 100-Year Pattern by Afshin Moshrefi (2026 edition). Past performance of seasonal patterns does not guarantee future results. This article is for informational purposes only and does not constitute investment advice.