Supermicro (SMCI) Has Closed Lower in 8 of 9 Jul 30-Sep 23 Stretches, Favoring Downside
Supermicro is ripping higher on a $60 billion AI server backlog just days before a late-July to late-September window that has usually meant trouble for the stock.
Price as of Jul 22, 2026: $30.56 (last close).

What is the seasonal pattern for Supermicro (SMCI)?
Supermicro has fallen in 8 of 9 years during the Jul 30 to Sep 23 window, with an average gain of 16.03% in winning years for the short setup.
- 8 for 9 in this window, with the short side averaging 16.03% gains in winning years.
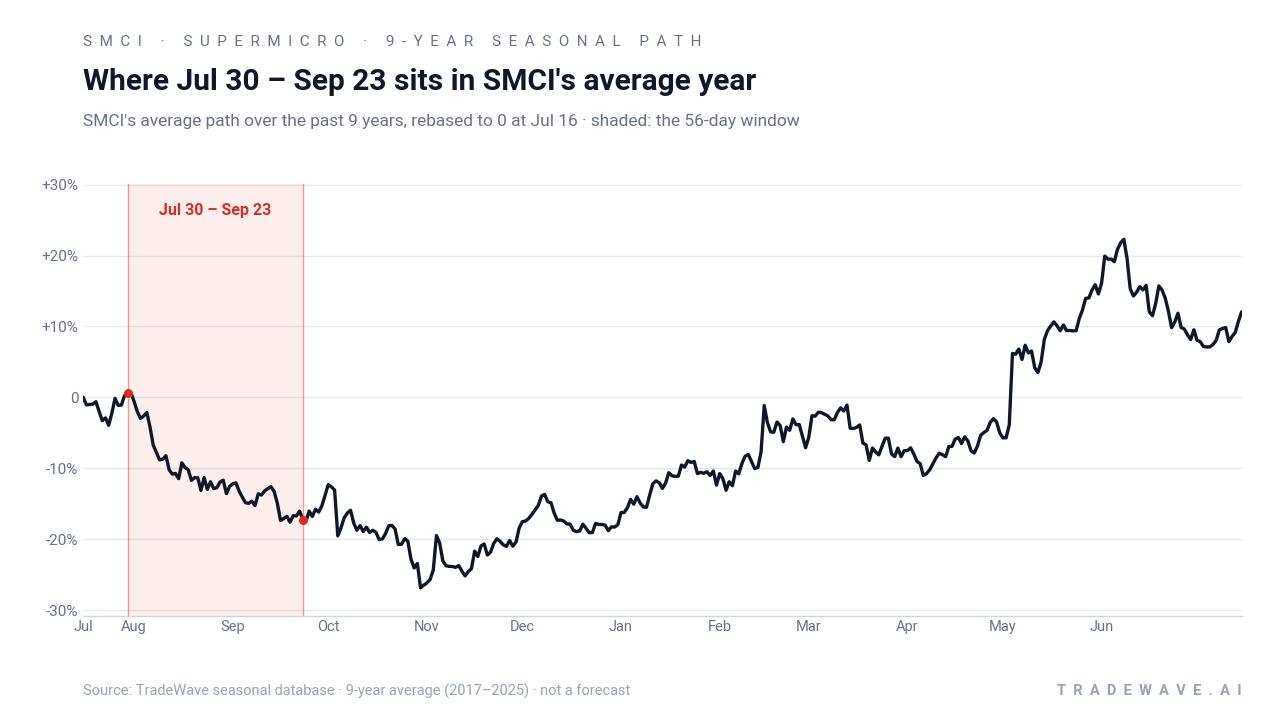
- The late-July to late-September Supermicro trading window runs 56 days, from Jul 30 to Sep 23.
- Percent Profitable is 89%, with 8 winning short years and just 1 losing year across the 9-year sample.
- Avg Profit - All, which includes the lone losing year, still comes in at a strong 14% for the short pattern.
- The TradeWave Ratio of 1.82 signals that price has typically traveled meaningfully in the trade direction within this window.
- Intraperiod swings have been large, with some years showing deep adverse moves before the short pattern ultimately worked.
According to historical data from TradeWave.ai, this late-summer stretch has behaved very differently from an average month for Supermicro, and the next iteration is only days away.
How has Supermicro (SMCI) traded in the late-July to late-September window?
Supermicro has closed lower in 8 of the past 9 Jul 30 to Sep 23 windows, a short-favoring pattern that has compounded to a 200% cumulative return for the strategy across those years. Shares finished Thursday at 30.56, up 19.8% on the day and about 51.0% below their 52-week high of 62.36, leaving plenty of room on the chart if the usual late-summer pressure shows up again.
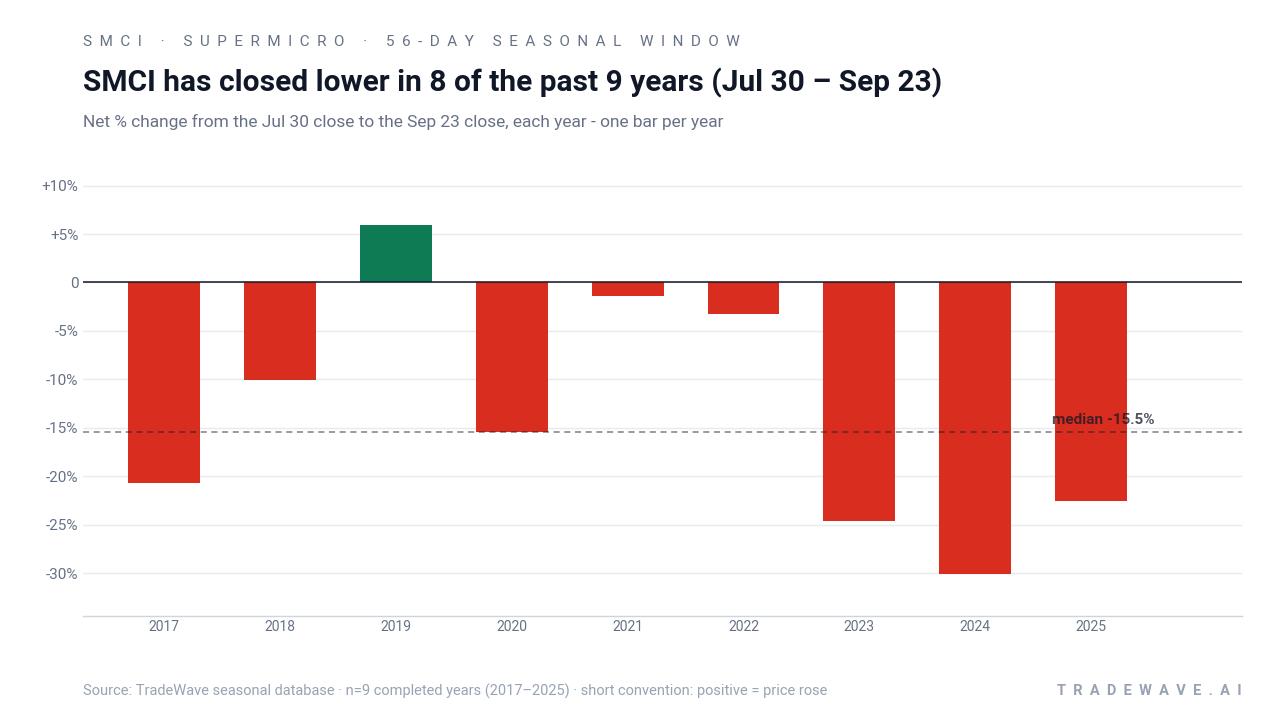
For this 56-day stretch, the trade direction is explicitly short, and the historical record has been strikingly one-sided. Percent Profitable sits at 89%, with 8 winning short years against just 1 losing year, and the average winner has delivered a 16.03% gain for the short side, compared with a still-strong 14% when every year is included. That gap between Avg Profit and Avg Profit - All shows that the lone losing year has not been large enough to erase the typical downside drift in this Supermicro seasonal trend.
The per-year breakdown shows how that has played out in practice. The strongest short year in the sample was 2024, when the stock fell 30.07% between the Jul 30 entry at 66.63 and the Sep 23 exit at 46.59, even though the best intraperiod rally reached 8.73% above the entry before rolling over. The weakest year for the pattern was 2019, when Supermicro actually rose 5.89% over the window, with a maximum favorable move for shorts of 8.48% early on before the trade reversed and finished as the only loss in the nine-year run.
A second view stacks net returns with the full intraperiod range, highlighting both rallies and drawdowns inside the window.
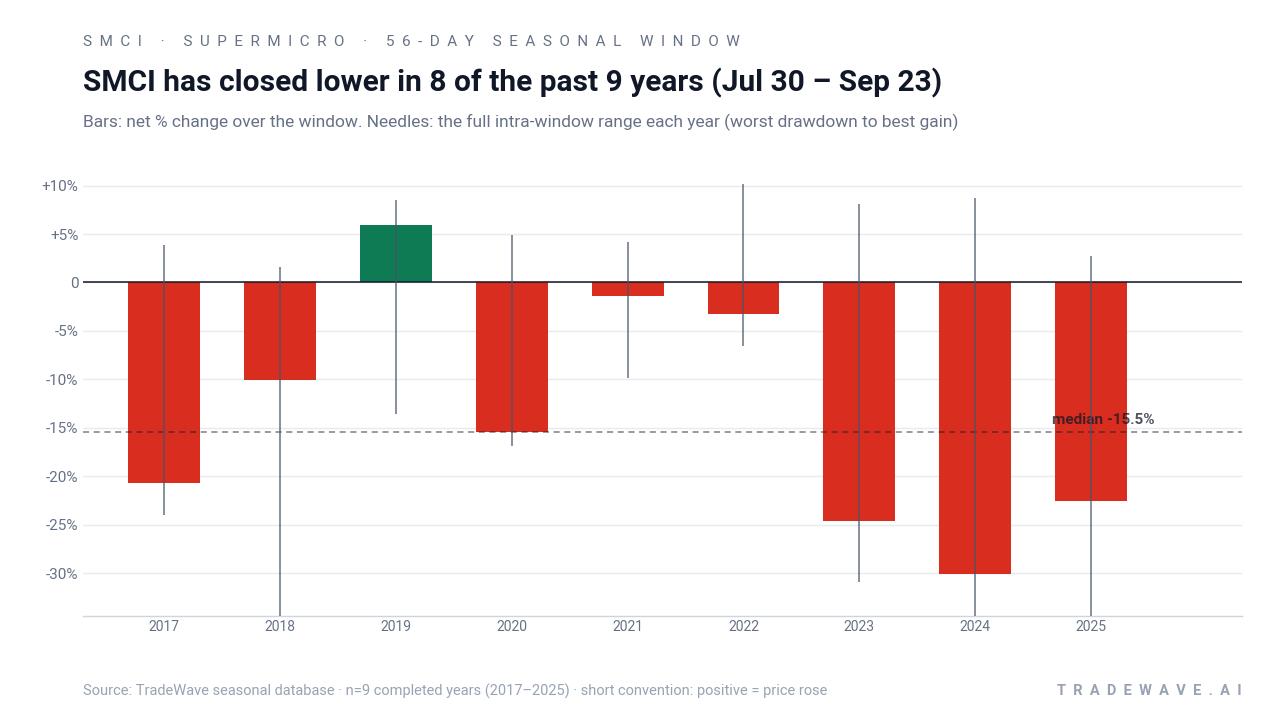
The maximum favorable move in many years has been sizable, which is what you would expect in a strong short pattern: once the stock starts to break, it has often kept sliding. At the same time, the maximum adverse move has sometimes been large as well, with years like 2018 and 2023 showing double-digit rallies against the short before the trade ultimately worked, underscoring that this late-summer Supermicro trading window has been volatile, not just one-way. The cumulative chart of stacking this window year after year compounds to roughly 200% for the short strategy, which is a rare level of consistency for a single 56-day slice of the calendar.
History does not guarantee future results; adverse excursions can be large even in winning windows, and traders can face meaningful drawdowns before any seasonal edge plays out.
Why does Supermicro (SMCI) follow this seasonal pattern?
One likely driver is the company’s earnings calendar, with fiscal fourth-quarter updates and guidance often landing in August and reshaping expectations for AI server demand and margins.[1] This window may also capture institutional portfolio repositioning around data center and AI infrastructure names as they react to those results and adjust risk into the autumn. Sector rotation between high-beta AI hardware and broader tech benchmarks can amplify those flows, turning late summer into a recurring pressure point for Supermicro.
What is driving Supermicro (SMCI) today?
Supermicro closed at 30.56 on Jul 23, up 5.06 points or 19.8% on the day, after a two-day surge that still leaves the stock well below its 52-week high of 62.36. The move followed a preliminary fiscal fourth-quarter update that flagged more than $60 billion in new orders, a record backlog, and a sharp lift in expected GAAP and non-GAAP gross margins to 15%–17%, compared with prior guidance in the 8.2%–8.4% range.[1][6][7] Management also signaled that reported revenue will likely land near the low end of the prior $11.0 billion to $12.5 billion range, roughly in line with analyst estimates clustered around $11.67 billion to $11.73 billion, which helped investors focus on profitability and demand quality rather than top-line optics.[2][6]
The company’s commentary tied the margin upgrade to a favorable mix of higher-value AI server configurations and strong demand from hyperscale and enterprise customers, reinforcing the broader AI infrastructure demand story that has been driving the stock’s longer-term narrative.[1][5] CEO Charles Liang has also highlighted a co-build of a gigawatt-scale AI data center for SpaceX and xAI, a project that has not been formally confirmed by SpaceX but has become a focal point in discussions about who sits behind the massive backlog.[1] Peers such as Dell and Hewlett Packard Enterprise traded higher in sympathy, as investors extrapolated Supermicro’s order and margin strength across the data center and AI server group.[2]
Despite the fireworks, recent coverage notes no reported insider buying or selling over the past three months, which removes one potential overhang but also means there is no insider vote of confidence at these levels.[9] The stock’s one-month return is still negative at -8.28%, reflecting how hard Supermicro had been hit into the update, and the 50-day moving average around 32.84 sits modestly above the latest close, underscoring that the stock is rebounding from a pullback rather than breaking to fresh highs. Average 20-day volume near 46.6 million shares has been dwarfed by the latest spike, with multiple reports describing the post-update move as a surge in both price and trading activity.[1][6][7]
The chart below situates the latest jump against Supermicro’s past year of trading and the median 60-day seasonal path.
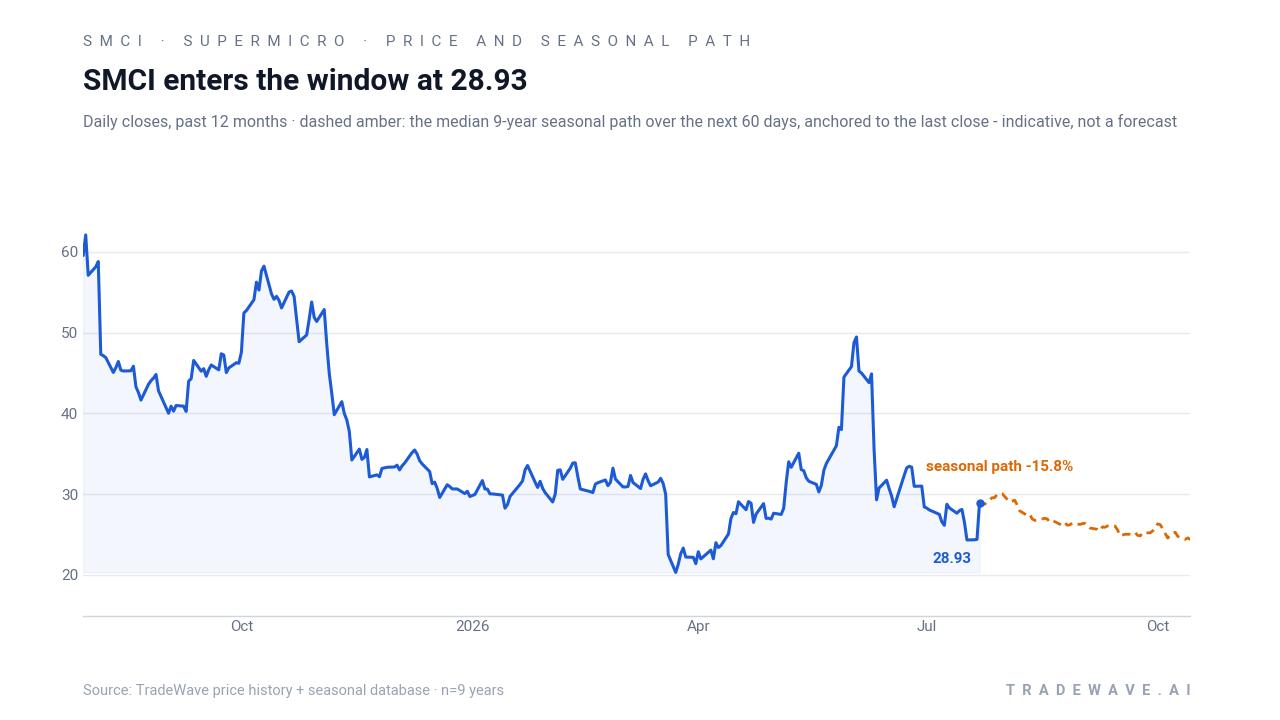
Macro context is doing Supermicro some favors. Coverage around the preliminary update has framed the $60 billion-plus order book as a direct read-through on accelerating AI server demand from cloud and enterprise buyers, a theme that has supported valuations across the AI hardware stack even as broader tech has chopped sideways.[5] Sector pieces also point out that Supermicro’s numbers helped lift sentiment for other data center and AI server suppliers, reinforcing the idea that this is a group story rather than a one-off print.[2]
Valuation is harder to pin down from the available data, but commentary from GuruFocus and others has focused on the tension between Supermicro’s explosive growth profile and the volatility that comes with being a key AI infrastructure pure play.[9] With no fresh consensus rating or price target data in the current set of sources, the market is effectively trading the stock on momentum, backlog visibility, and margin trajectory into the Aug 11 full Q4 release rather than on a neat earnings multiple. Street expectations for that report center on how much of the backlog converts to revenue in fiscal 2027 and whether the 15%–17% margin band proves sustainable as the mix of customers and GPU configurations evolves.[2][6]
What should traders watch as this Supermicro seasonal window approaches?
The next 56-day Supermicro seasonal window starts on Jul 30 and runs through Sep 23, overlapping the company’s Aug 11 Q4 report and any follow-on guidance updates.[1][6] Traders watching this SMCI seasonal trend will focus on whether the stock can hold above the 50-day moving average near 32.84 or whether late-summer selling pressure pulls it back toward the low-20s band that has acted as a floor over the past year. A sustained break below that moving average during the window would rhyme with the historical pattern of weakness, while a grind higher or sideways consolidation would mark a clear departure from the past nine years.
The recent volume and price spike around the preliminary update is the other key tell. If elevated trading activity persists into and through the earnings date, with the stock repeatedly sold into strength after intraday pops, that would echo prior years where rallies inside the window ultimately gave way to lower closes by late September.[1][6][7] On the other hand, if post-earnings flows show buyers absorbing supply on dips and volume normalizing without heavy distribution, it would signal that the AI server story is overpowering the usual late-summer drag.
Into Aug 11, watch three things: any change to the $60 billion-plus order narrative, especially around cancellations or delays; the durability of the 15%–17% gross margin band; and management’s tone on capacity and lead times for next-generation GPU systems.[1][2][6] Add it up, and this is a rare setup where a powerful fundamental story, a sharp near-term rally, and a historically bearish late-summer seasonal window are all colliding in the same few weeks.
Sources
- Yahoo Finance (Insider Monkey excerpt), "Super Micro (SMCI) Climbs 27% as Orders Surge to $60B" (Jul 22, 2026)
- Yahoo Finance, "DELL, HPE Stock Gain After-Hours As SMCI's Strong Margin Outlook Lifts Server Peers" (Jul 22, 2026)
- Proactive via Yahoo Finance Canada, "Supermicro shares jump after preliminary Q4 update signals stronger margins, record orders" (Jul 22, 2026)
- Yahoo Finance / Investing.com, "Supermicro shares surge 20% as robust margins, $60B backlog eclipse soft revenue" (Jul 21, 2026)
- GuruFocus, "AI Startups Redefining Workforce Efficiency: A New Era for Busin (SMCI mentions)" (Jul 20, 2026)
About this seasonal analysis
Seasonal pattern data is sourced from TradeWave.ai, which analyzes historical price behavior across annual calendar windows going back up to 30 years. Read the full data methodology or the book The 100-Year Pattern by Afshin Moshrefi (2026 edition). Past performance of seasonal patterns does not guarantee future results. This article is for informational purposes only and does not constitute investment advice.