6-for-6 Midterm Run: Amazon (AMZN) Enters 17-Day Late-July Window Averaging 5.32% Gains
Amazon is heading toward a late-July trading window that has been quietly reliable in past midterm election years, even as the stock sits well below its 52-week high.
Price as of Jul 13, 2026: $247.31 (last close).

What is the seasonal pattern for Amazon (AMZN)?
Amazon has risen in 6 of 6 midterm-year late-July windows during this 17-day pattern, with an average gain of 5.32% in winning years.
- 6 for 6 in this window, with Amazon averaging 5.32% gains across all winning years.
- The upcoming seasonal window starts Jul 31, 2026 and runs for 17 trading days in midterm election years.
- Percent Profitable is 100%, with 6 winners and 0 losers in the TradeWave.ai lookback sample.
- Average winner gains cluster between roughly 3% and 7%, with individual years reaching up to 6.94%.
- Intraperiod swings have been meaningful, with some years seeing adverse moves larger than 10% before finishing higher.
- The pattern aligns with the midterm-to-pre-election transition, a phase when large-cap tech leadership often reshuffles.
According to historical data from TradeWave.ai, this late-July stretch has behaved differently from an average month for Amazon in past midterm election years, and the next iteration is about to open again.
How has Amazon (AMZN) traded in this late-July midterm-year window?
Amazon has risen in 6 of the last 6 midterm election years during this 17-day late-July window, averaging a 5.32% gain for long positions. The next instance begins on Jul 31, 2026, with the stock last changing hands at 247.31, about 11.2% below its 52-week high of 278.56 and well above its 52-week low of 196.00. Grouping the data by the presidential election cycle matters here because this pattern specifically reflects how Amazon has behaved in the midterm year phase, not across random calendar years.
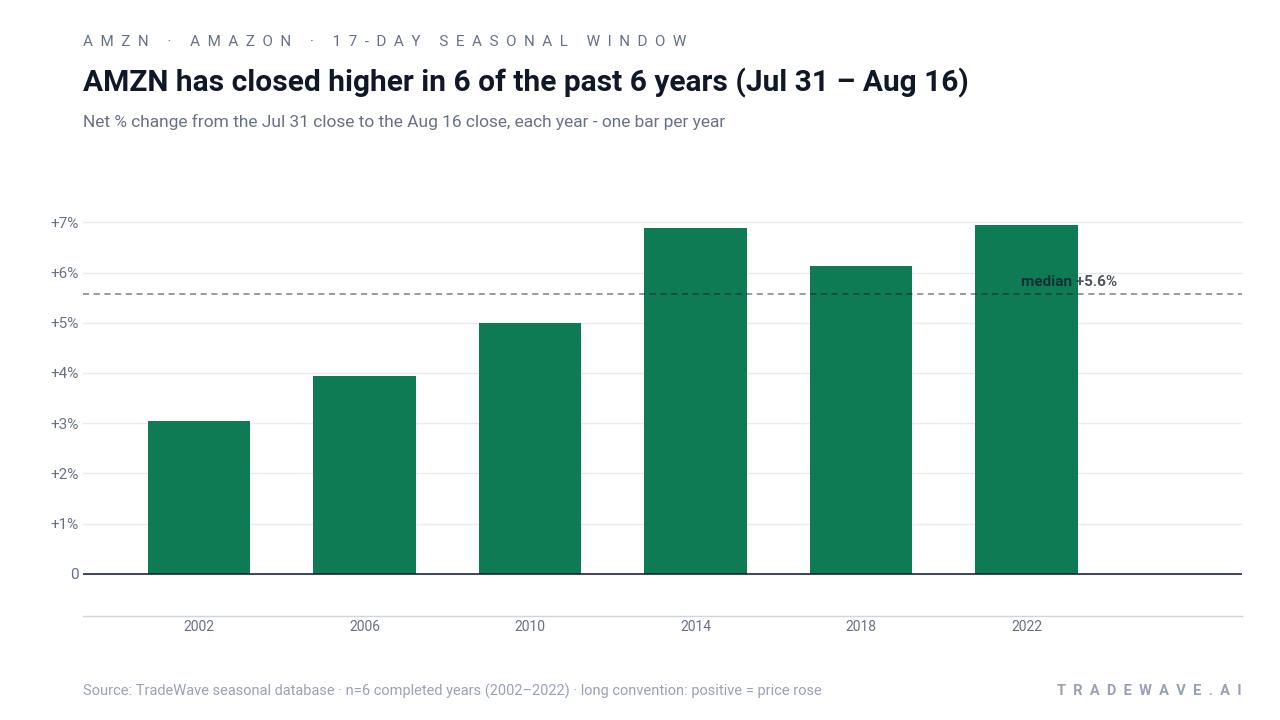
Across the six midterm election years in this sample, the strongest net gain came in 2022, when Amazon advanced 6.94% during the window, while the softest outcome was still a positive 3.04% in 2002. Average gains of 5.32% across all years line up with a 36% cumulative return and a 5.31% annualized pace, which is unusually steady for a short 17-day slice of the calendar. The Sharpe ratio of 3.2, based on end-of-window outcomes, points to a historically favorable risk-adjusted profile for long exposure in this specific Amazon trading window.
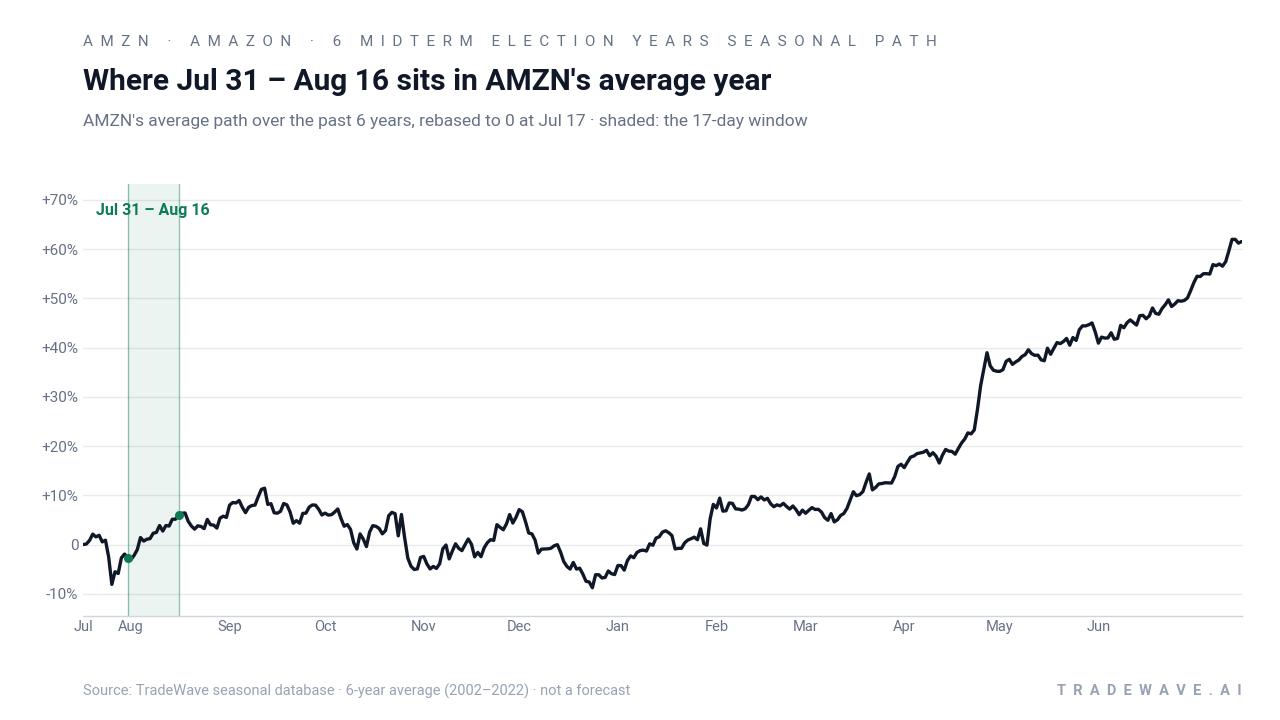
The historical seasonal trend line suggests that gains have tended to build fairly smoothly across the 17 days rather than arriving in a single spike. In several years, the curve shows early strength that continues into the back half of the window, which is consistent with the pattern’s long bias and the absence of any losing samples. The cumulative return chart for this pattern, which stacks each year’s path, reinforces that the window has behaved more like a steady grind higher than a coin-flip trading range.
Year-by-year net returns and intraperiod swings show how much room Amazon has historically had to run, and how deep drawdowns have gotten, before the window closed higher.
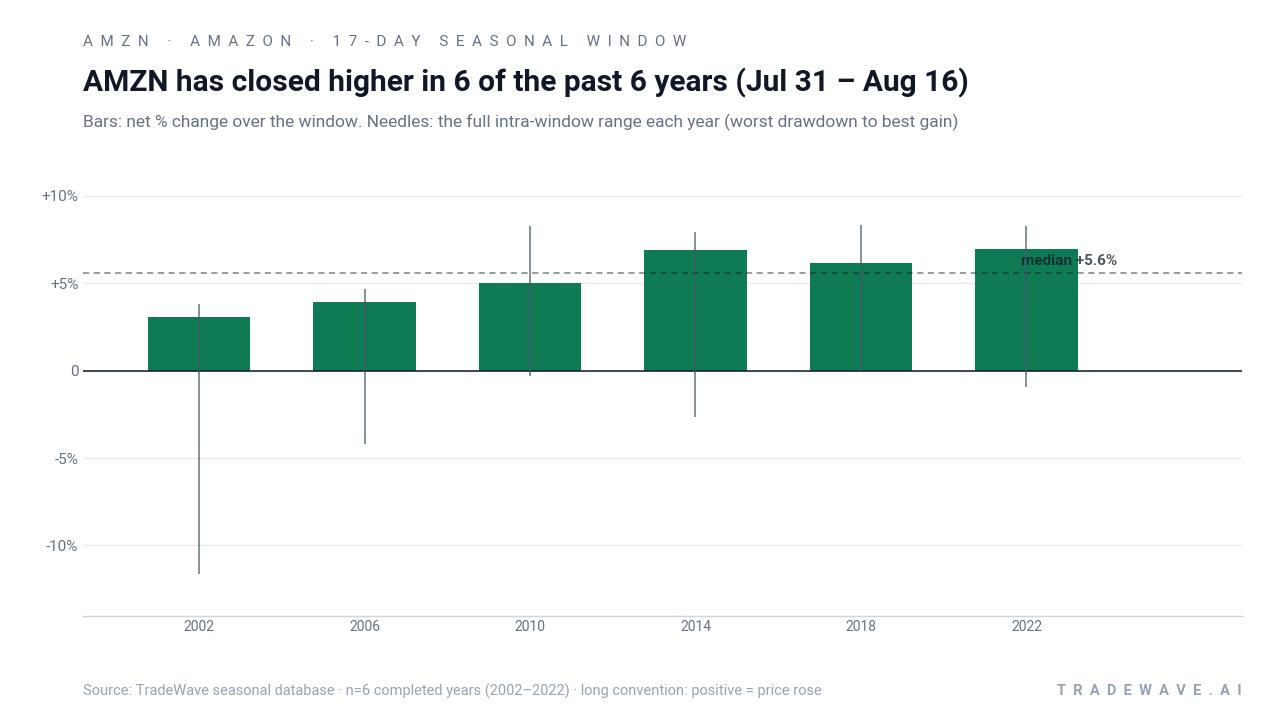
Intraperiod behavior has not been gentle. In 2002, for example, Amazon finished the window up 3.04% but endured a worst drawdown of 11.62% from the entry before recovering, while the best run-up that year reached 3.8%. In more recent cycles such as 2018 and 2022, maximum favorable moves have pushed into the 8% area, with adverse excursions generally contained below 3%, which fits the idea of a bullish but still volatile tech window. The TradeWave Ratio of 3.23 captures how far price has typically traveled in the trade direction within the window, independent of the final close, and underscores that when this pattern has worked, it has often delivered meaningful intraperiod upside.
History does not guarantee future results; adverse excursions can still be large even in windows that have always finished higher.
Why does Amazon (AMZN) follow this seasonal pattern?
One likely driver is the way Amazon’s calendar lines up with the broader midterm election year, when investors often reassess large-cap tech exposure ahead of policy and spending debates. Late July also tends to sit between Prime Day and the back-to-school ramp, when analysts refine revenue expectations and portfolio managers adjust positions around e-commerce and cloud growth themes. This pattern may reflect a mix of those fundamental catalysts with systematic flows tied to index rebalancing and options positioning in a stock that anchors major benchmarks.
What is driving Amazon (AMZN) today?
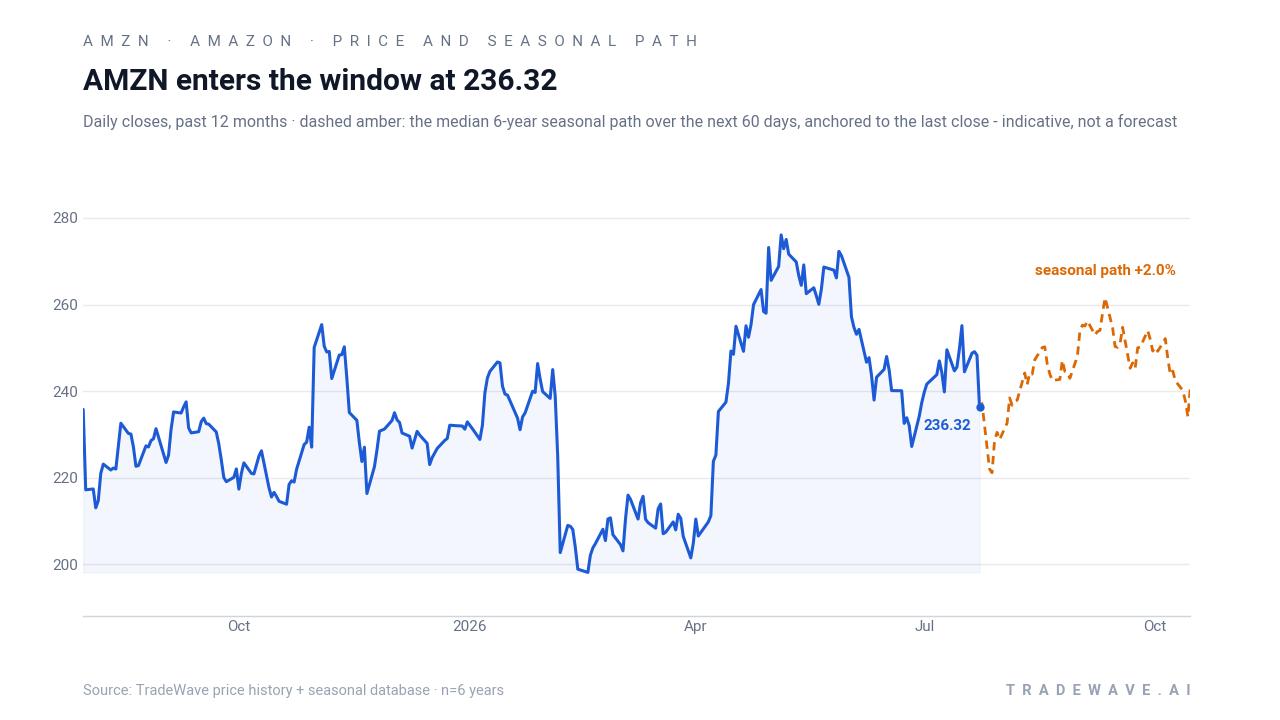
Amazon shares closed Monday at 247.31, up 0.8% on the day, trading between 244.18 and 249.65 on volume of about 33.3 million shares. That leaves the stock roughly 11.2% below its 52-week high of 278.56 and comfortably above its 52-week low of 196.00, with the 50-day moving average sitting higher at 253.72 and 20-day average volume around 61.6 million shares. The one-month return of 2.4% points to a modest grind higher rather than a breakout, as investors weigh the durability of Amazon’s cloud and advertising momentum against a still-uncertain macro backdrop for big tech.
In Oct 2025, Amazon’s Q3 report showed AWS net sales growth around 20% and a strong contribution from advertising services, which helped power a post-earnings surge in the stock price despite margin pressures.[3] That same period also highlighted how workforce-related costs and severance charges can tug at operating income, even when top-line trends look solid.[6] Earlier, in Aug 2025, management and analysts pointed to AI-related capacity constraints as both a headwind and a future tailwind for AWS, arguing that easing constraints could unlock another leg of cloud growth.[7] Together, those episodes frame the current setup: Amazon is still seen as a core beneficiary of AI and digital ad spending, but investors have been quick to punish any sign that cloud growth is slowing or costs are creeping higher.
The chart below situates the latest move in its recent multi-month context, alongside a 60-day seasonal projection path.
From a macro and policy perspective, the market is in the midterm election year phase of the presidential cycle, a period that often brings regulatory noise around big tech, debates over antitrust and content moderation, and shifting expectations for fiscal support. For a platform company like Amazon, that can translate into headline risk around cloud competition, labor relations and marketplace practices, even as core businesses like AWS and advertising remain central to earnings growth.[1] The seasonal pattern flagged for late July sits inside this backdrop, offering a data-driven lens on how the stock has historically traded when politics, policy and positioning collide in the middle of the cycle.
What should traders watch as this Amazon seasonal window approaches?
First, the calendar: the 17-day window opens on Jul 31, 2026, so price action in the second half of July will set the starting point. A push back toward the 50-day moving average near 253.72 ahead of the window would frame the pattern against a firmer tape, while a drift closer to the 52-week low would make any historical upside feel more like a bounce attempt than a continuation. Second, watch how AWS and advertising narratives evolve in upcoming commentary and research; renewed focus on AI capacity easing or ad growth acceleration would rhyme with the growth-led rallies that followed the Q3 2025 beat.[3][7]
Third, monitor intraday volatility and depth of pullbacks once the window opens. History shows that even winning years have seen sharp adverse moves, including double-digit drawdowns in 2002, before finishing higher, so a deeper dip inside the window would not automatically invalidate the pattern. Finally, track how Amazon trades relative to other mega-cap tech names and key indices: if the stock begins to outperform into early August while broader markets remain choppy, that would be consistent with the historical midterm-year seasonal trend. If instead Amazon lags or breaks below recent support during the window, it would mark a clear departure from the 6-for-6 record and signal that this cycle’s macro and policy mix is overpowering the usual seasonal tailwind.
Sources
- Business Insider: Amazon earnings on deck with focus on AI and AWS as the stock lags Mag 7 (Oct 30, 2025)
- CNBC: UBS lifts Amazon price target ahead of e-commerce giant’s earnings (Oct 28, 2025)
- Seeking Alpha: Amazon surges after Q3 beat driven by AWS, ad growth, offsetting margin pressures (Oct 30, 2025)
- Seeking Alpha: Amazon: Workforce Related Challenges Show Up, Again (Nov 3, 2025)
- Reuters: Amazon slumps after cloud computing growth underwhelms investors (Aug 1, 2025)
About this seasonal analysis
Seasonal pattern data is sourced from TradeWave.ai, which analyzes historical price behavior across annual calendar windows going back up to 30 years. Read the full data methodology or the book The 100-Year Pattern by Afshin Moshrefi (2026 edition). Past performance of seasonal patterns does not guarantee future results. This article is for informational purposes only and does not constitute investment advice.