Merck & Co. (MRK) Has Rallied in 10 of 10 Aug. 5 Midterm Windows, Averaging 29.14% Gains
Merck & Co. is trading near record territory as it approaches an Aug. 5 seasonal window that has never produced a losing midterm-year run, setting up a key test of its pharma-sector momentum.
Price as of Jul 10, 2026: $123.54 (last close).

What is the seasonal pattern for Merck & Co. (MRK)?
Merck & Co. has risen in 10 of 10 midterm election years during this Aug. 5-to-late-spring window, with an average gain of 29.14% in winning years.
- 10 for 10 in this window, averaging 29.14% gains in winning years across the last 10 midterm election cycles.
- Seasonal window starts Aug. 5, 2026 and runs 284 trading days, spanning late in the midterm election year into the following pre-election year.
- Percent Profitable is 100%, with 10 winners and 0 losers for a long trade setup in this Merck & Co. trading window.
- Median profit of 32.86% and cumulative return of 1,127% highlight how strong this MRK seasonal trend has been historically.
- TradeWave Ratio of 2.17 and Sharpe ratio of 1.95 point to sizable directional moves with attractive risk-adjusted returns in prior cycles.
- Intraperiod pullbacks have still occurred, but maximum adverse moves have been modest compared with the best rallies, keeping every year in the green.
According to historical data from TradeWave.ai, this upcoming stretch for Merck & Co. has behaved very differently from an average year in past midterm cycles, and the next iteration is about three weeks away.
How strong is Merck & Co. (MRK) in the Aug. 5 midterm-year seasonal window?
Merck & Co. has posted gains in every one of the last 10 midterm election years during the 284-trading-day window that begins on Aug. 5, averaging a 29.14% profit for long positions. Shares finished Monday at $123.54, down 1.2% on the day and about 5.2% below their 52-week high of $130.29, leaving the stock close enough to the top of its range that a strong seasonal phase could matter for positioning. The consistency of this MRK seasonal trend stands out in a sector where drug trial headlines and regulatory decisions often dominate short-term trading.
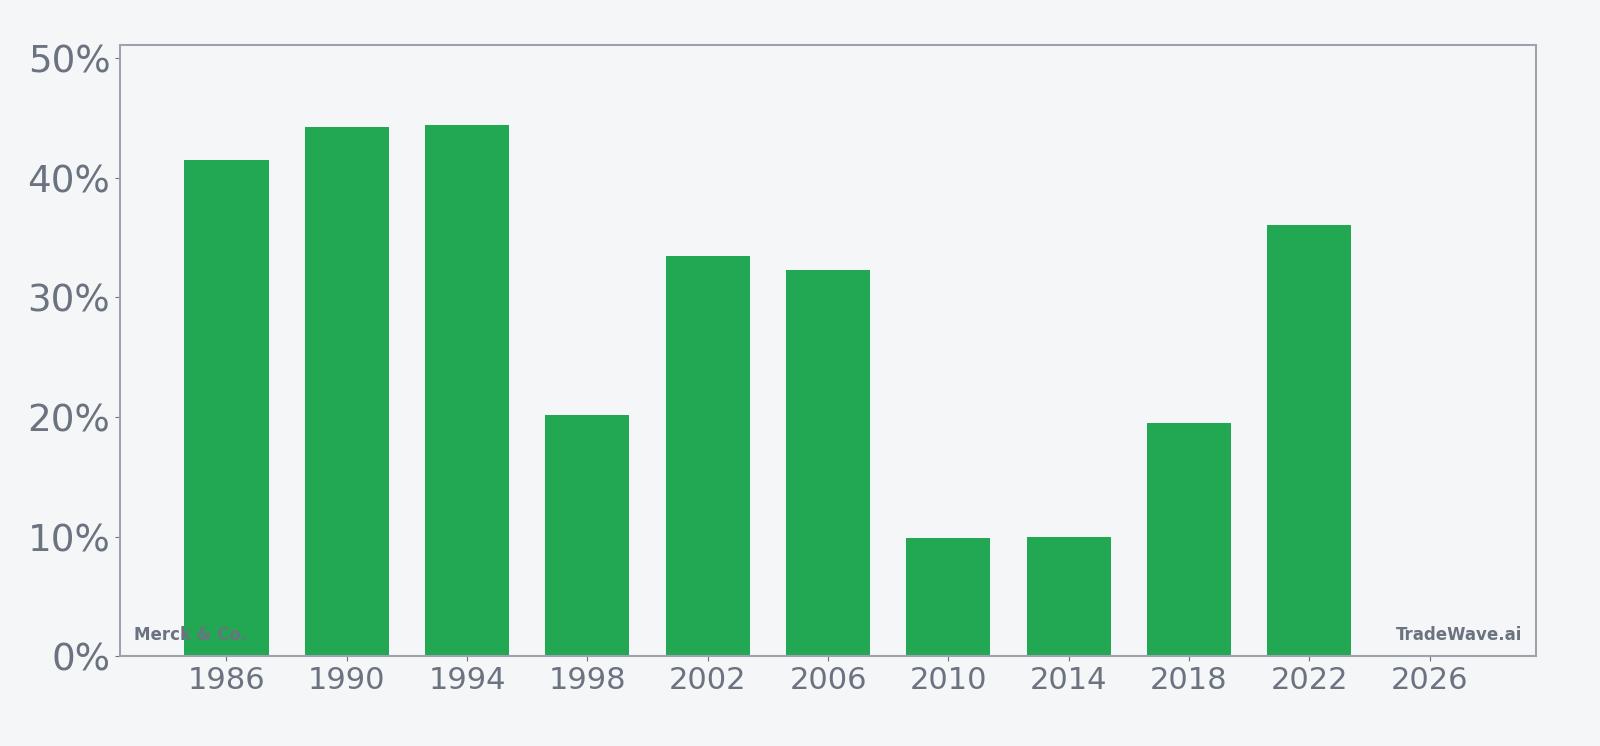
The pattern is grouped by the presidential election cycle, focusing on the last 10 midterm election years rather than consecutive calendar years. That matters because midterm years often bring policy uncertainty, drug-pricing debates and shifting fiscal priorities, which can change how healthcare stocks trade compared with election or pre-election years.
Across those 10 midterm-year samples, the long trade direction has been unambiguously favorable. Percent Profitable sits at 100%, with 10 winners and 0 losers, and the median profit of 32.86% is even higher than the average, which suggests the gains are not just driven by one or two outlier years. The annualized return of 28.5% and cumulative return of 1,127% across the sample underline how powerful this specific Merck & Co. trading window has been for long exposure.
Average profit of 29.14% means that in a typical winning year, a long position held from early August of the midterm year through the end of the 284-day window would have gained just under 30%. Because there were no losing years in this sample, the average profit across all years is effectively the same as the average winner, and the reported average loss is 0%. The Sharpe ratio of 1.95 indicates that these returns have come with relatively attractive risk-adjusted characteristics compared with many single-stock seasonal patterns.
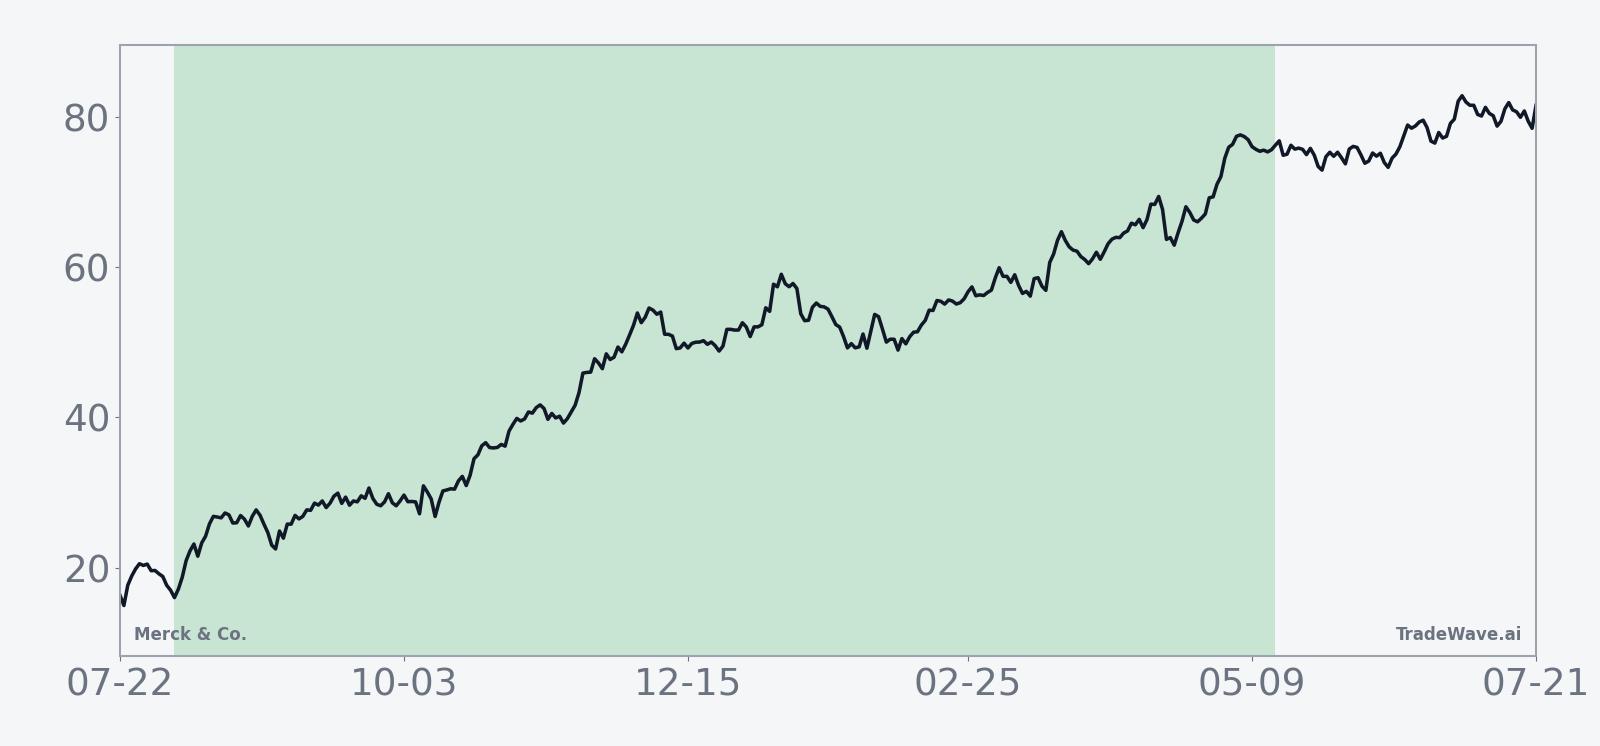
The historical seasonal average trend line shows gains that build steadily rather than in a single spike, with the pattern tending to stay in positive territory for most of the window. That fits a story where Merck benefits from a mix of late-cycle risk appetite and pre-election-year optimism, especially as investors look for defensive growth in large-cap pharmaceuticals.
A closer look at yearly net returns and intraperiod swings shows how much room MRK has historically had to run, and how deep the typical pullbacks have been.
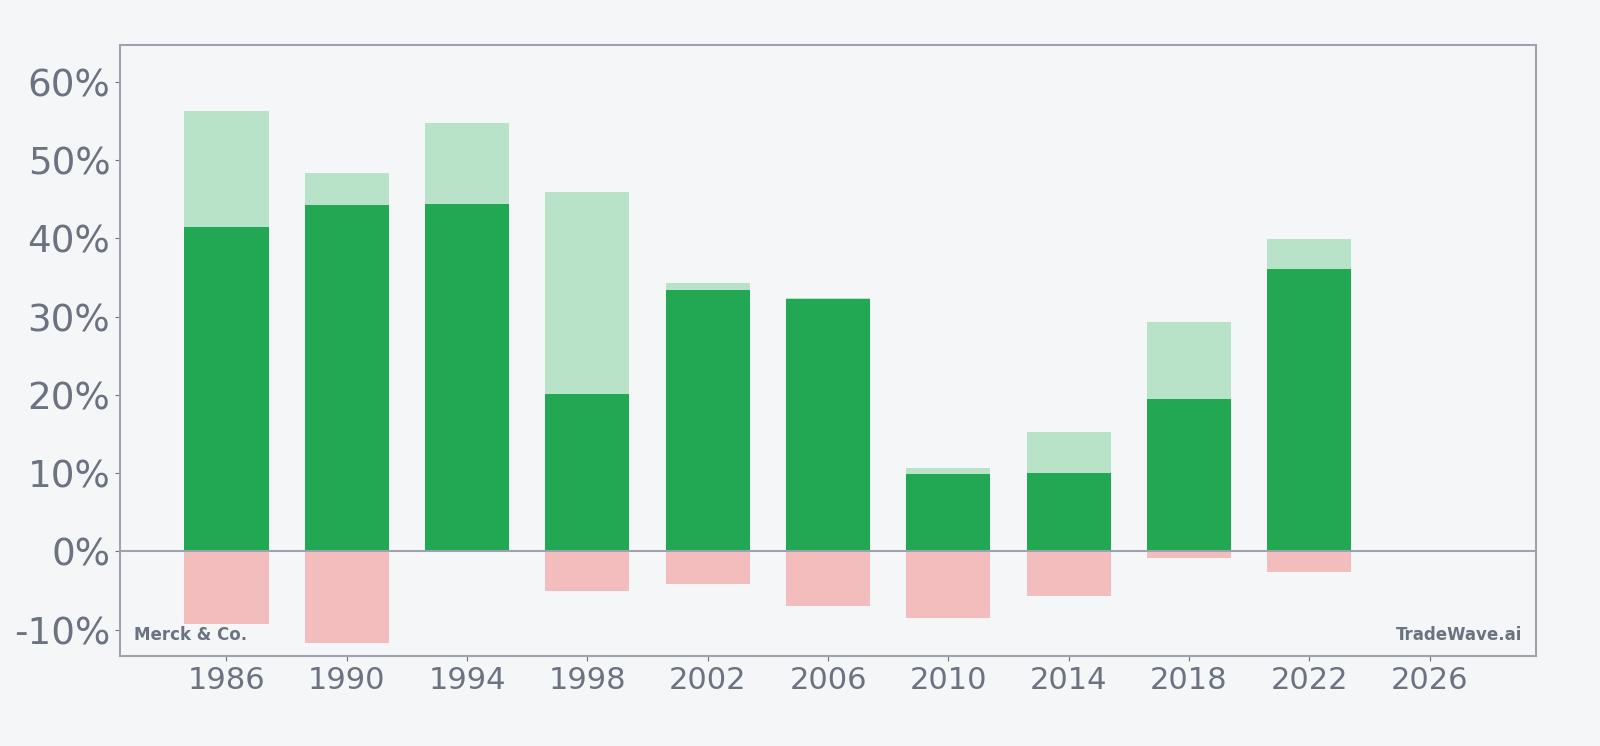
The stacked net, peak-rally and worst-drawdown bars show that in strong years like 1986, 1990 and 1994, Merck’s best intraperiod moves reached between roughly 48% and 56% while the worst pullbacks stayed in single digits. Even in softer years such as 2010 and 2014, the stock still finished up around 10%, with maximum adverse excursions of less than 9%, which is modest given the length of the window. The TradeWave Ratio of 2.17 captures this tendency for price to travel meaningfully in the trade direction within the window, while the maximum favorable and adverse excursions highlight that upside has historically dominated downside in this specific slice of the calendar.
History does not guarantee future results; adverse excursions can still be meaningful even in windows where every historical sample finished with a gain.
Why does Merck & Co. (MRK) follow this seasonal pattern?
This pattern may reflect how the presidential election cycle shapes healthcare policy risk and investor positioning. One likely driver is that midterm election years often see heavy rhetoric on drug pricing, followed by clearer policy signals and renewed risk appetite as markets transition into the year before the presidential election, which has historically been supportive for equities. For a large-cap pharmaceutical name like Merck & Co., that combination of policy clarity, steady earnings from flagship drugs and portfolio repositioning by institutions can cluster gains into this late-midterm-to-pre-election stretch.
What is driving Merck & Co. (MRK) today?
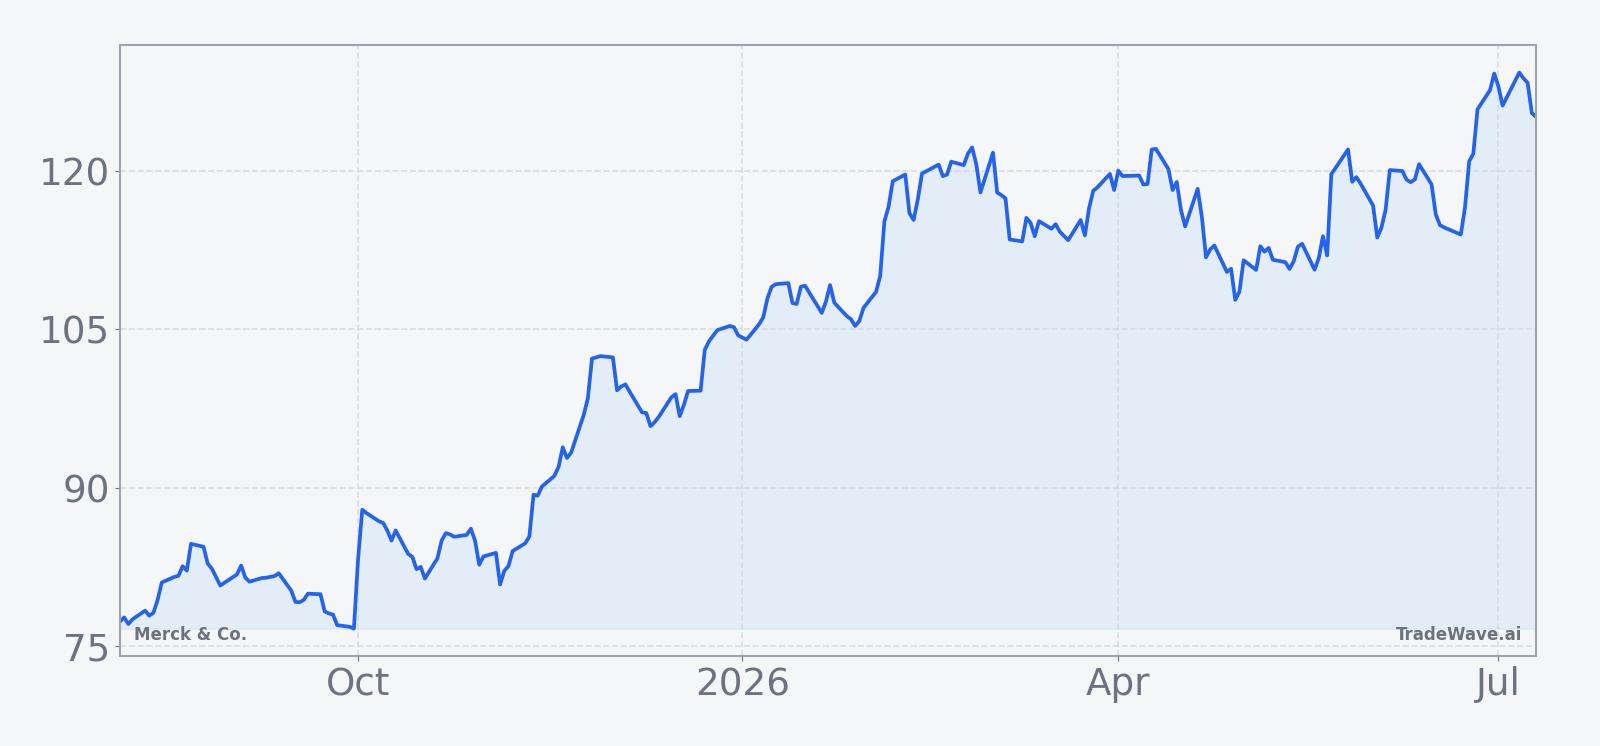
Merck & Co. shares closed at $123.54 on Monday, down 1.53 points or 1.2% on the session, after trading between $122.90 and $125.56 on volume of about 8.2 million shares. That leaves the stock roughly 5.2% below its 52-week high of $130.29 and well above its 52-week low near $71.78, with the 50-day moving average around $117.17 and 20-day average volume close to 11.9 million shares, a setup that keeps MRK in a firm uptrend heading into its next catalysts.
Near term, the calendar is dominated by Merck’s next earnings release, with Q2 2026 results expected on Aug. 4 and consensus estimates calling for earnings per share of $2.13 on revenue of $16.52 billion.[5] That report lands one trading day before the Aug. 5 seasonal window opens, which could amplify any reaction if guidance or commentary shifts expectations for the back half of the year. In 2025, Merck’s quarterly updates highlighted steady revenue growth and strong contributions from cancer drug Keytruda, and management narrowed full-year 2025 revenue guidance to a range of $64.5 billion to $65.0 billion, reinforcing the company’s large-cap defensive growth profile.[11]
Strategic moves have also been in focus. In March 2026, Reuters reported that Merck was nearing a roughly $6 billion all-cash acquisition of Terns Pharma to bolster its cancer portfolio, underscoring the company’s push to extend its oncology franchise beyond Keytruda.[12] Earlier this year, separate reports flagged talks to acquire Revolution Medicines for about $30 billion, a reminder that Merck is willing to deploy significant capital to secure future growth in targeted therapies.[9] These potential deals sit alongside a steady stream of regulatory milestones, including prior approvals for Keytruda combinations and a subcutaneous formulation in Europe that have been cited as important drivers of sentiment around the stock.[8]
On the positioning side, MarketBeat data as of Jul. 13, 2026 shows Merck carrying a “Moderate Buy” consensus rating, with analysts generally positive on the company’s earnings trajectory and pipeline depth.[5] Sector commentary from Seeking Alpha and others has framed Merck as a core holding within the broader pharmaceuticals group, benefiting from both its oncology leadership and a balance sheet that supports continued deal-making.[4] For traders watching the MRK seasonal pattern, that backdrop of constructive analyst coverage and active M&A talk provides the fundamental context into which the historically strong Aug. 5 window will open.
The chart below situates the latest pullback and the upcoming earnings date against Merck’s broader 12-month trend and the near-term seasonal projection.
What should traders watch as the Aug. 5 seasonal window opens?
First, the Aug. 4 earnings release is the obvious catalyst to watch, given it lands on the eve of a window that has historically been very favorable for long MRK exposure.[5] How the stock trades in the first few sessions after that report, especially relative to the $130 area near the 52-week high, will show whether investors are willing to lean into the historical seasonality or fade it.
Second, policy and regulatory headlines around drug pricing and oncology approvals will matter more than usual as markets move deeper into the midterm election year and start to look ahead to the presidential race.[8] Any shift in tone from U.S. or European regulators on reimbursement, or new data around Keytruda combinations, could either reinforce or challenge the historical pattern of strength in this late-midterm-to-pre-election stretch.
Third, traders should keep an eye on deal flow and capital allocation. Follow-through on the reported Terns Pharma acquisition or any update on the Revolution Medicines talks would signal how aggressively Merck intends to extend its oncology moat, which has been a key part of the bull case in prior cycles.[9][12] Strong execution on M&A and pipeline development would align with the historical pattern of sustained gains across the 284-day window, while delays or regulatory pushback could introduce volatility even within an otherwise favorable seasonal regime.
Finally, watch how MRK trades relative to the broader pharmaceuticals sector and large-cap benchmarks. If the stock begins to outperform into and through the seasonal window while maintaining controlled drawdowns on pullbacks, that would echo the historical profile of steady upside with manageable adverse moves. If instead the stock stalls below its highs or starts to show deeper intraperiod selloffs, it would be an early sign that this midterm-year iteration may diverge from the clean 10-for-10 record that has defined the pattern so far.
Sources
- ChartMill: MRK Forecast, Price Target & Analyst Ratings
- Business Insider / Markets: Merck Stock Price | MRK Stock Quote, News, and History
- Forbes: Merck & Co. | MRK Stock Price, Company Overview & News
- Seeking Alpha: Merck & Co., Inc. (MRK) Stock Price, Quote, News & Analysis
- MarketBeat: Merck & Co., Inc. $MRK Stock Holdings Boosted by Procyon Advisors LLC
- Finviz: MRK - Merck & Co Inc Stock Price and Quote
- MarketBeat: Merck & Co., Inc. (MRK) Stock Forecast and Price Target 2026
- Forbes (Great Speculations): Why Is Merck Stock Surging?
- Seeking Alpha: Key deals this week: Merck, Glencore, CrowdStrike, Marvell Technology, Steel Dynamics and more
- Forbes (Great Speculations): Is Merck Stock’s Run Legitimate?
- Reuters: Merck posts higher third-quarter sales as Keytruda growth offsets drop from Gardasil
- Reuters: Merck nears $6 billion acquisition of Terns Pharma to boost cancer portfolio, FT reports
About this seasonal analysis
Seasonal pattern data is sourced from TradeWave.ai, which analyzes historical price behavior across annual calendar windows going back up to 30 years. Read the full data methodology or the book The 100-Year Pattern by Afshin Moshrefi (2026 edition). Past performance of seasonal patterns does not guarantee future results. This article is for informational purposes only and does not constitute investment advice.