10-for-10: Merck & Co. (MRK) Has Rallied in Every Aug. 6 Midterm Window, Averaging 28.15%
Merck & Co. is heading toward an Aug. 6 trading window that has been consistently strong in past midterm election years, even as shares sit below their 52-week high and investors weigh patent and policy risks.
Price as of Jul 20, 2026: $124.40 (last close).

What is the seasonal pattern for Merck & Co. (MRK)?
Merck & Co. has risen in 10 of 10 midterm election years during this Aug. 6 plus 283-day window, with an average gain of 28.15% in winning years.
- 10 for 10 in this window, with Merck & Co. averaging 28.15% gains across all winning years.
- Seasonal window starts Aug. 6 and runs 283 trading days, spanning the midterm election year into the year before the presidential election.
- Percent Profitable is 100%, with 10 winners and 0 losers in the last 10 midterm election cycles.
- Annualized return across these windows is 27.57%, with a Sharpe ratio of 1.97 on end-of-window outcomes.
- The TradeWave Ratio of 2.2 signals that price has typically traveled meaningfully in the long direction within the window, even before final closes.
- Maximum adverse moves have still appeared inside winning years, so traders have had to sit through drawdowns to capture the seasonal upside.
According to historical data from TradeWave.ai, this upcoming stretch for Merck & Co. behaves very differently from an average year, with a distinct midterm-to-pre-election pattern that has repeated across multiple cycles.
How has Merck & Co. (MRK) traded in this midterm-year window?
Merck & Co. has posted gains in every one of the last 10 midterm election years during the 283-trading-day window that begins on Aug. 6, averaging a 28.15% advance for long positions. Shares finished the prior session at 124.40, down 2.4% on the day and about 5.6% below their 52-week high of 131.74, leaving room above if the historical pattern repeats.
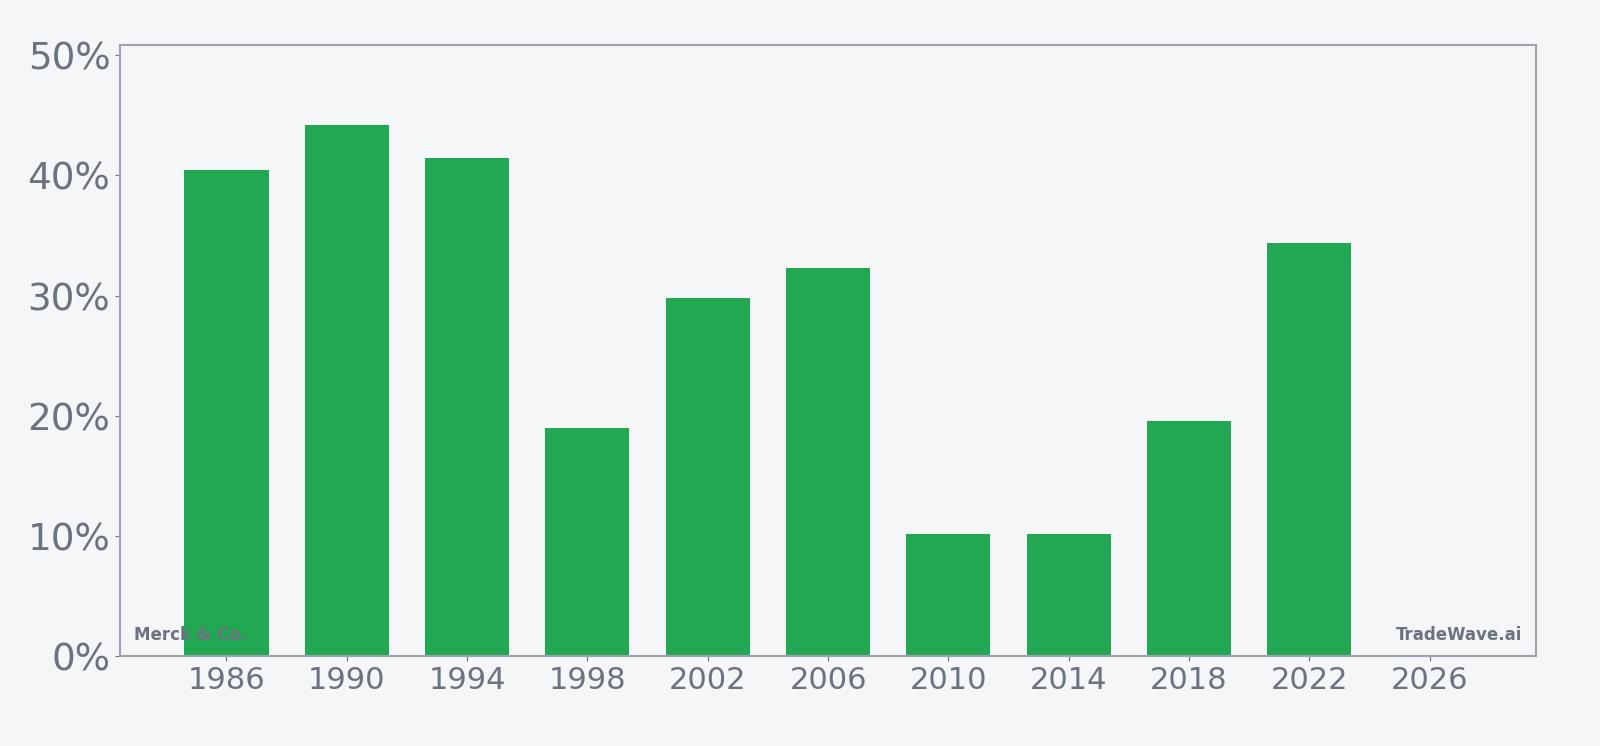
The pattern is grouped by the presidential election cycle, focusing on the last 10 midterm election years rather than consecutive calendar years. That matters for a large pharmaceutical stock like Merck because policy risk, drug pricing debates and Medicare reimbursement rules often follow a four-year rhythm, with midterm years and the following pre-election years seeing shifts in regulation and fiscal priorities that can move healthcare names together.
Across those 10 midterm-year windows, the trade direction is long, and every single instance finished positive. The strongest year in the sample was 1990, when the stock gained 44.22% from entry to exit, while the softest outcome was 2010, which still delivered a 10.17% net return over the window. Add it up and the cumulative return across all 10 windows is 1,041%, with an annualized return of 27.57%.
Average profit of 28.15% means that, on a typical midterm-year iteration, a long position held from early August through the end of the 283-day window has historically produced a high double-digit gain. Because there were no losing years in this sample, the average profit across all years is the same as the average winner, and the reported average loss is 0%.
The risk-adjusted profile is also unusually strong. A Sharpe ratio of 1.97 indicates that the end-of-window returns have been high relative to their volatility, while the TradeWave Ratio of 2.2 suggests that price has typically traveled substantially in the trade direction within the window, not just drifted higher by the close.
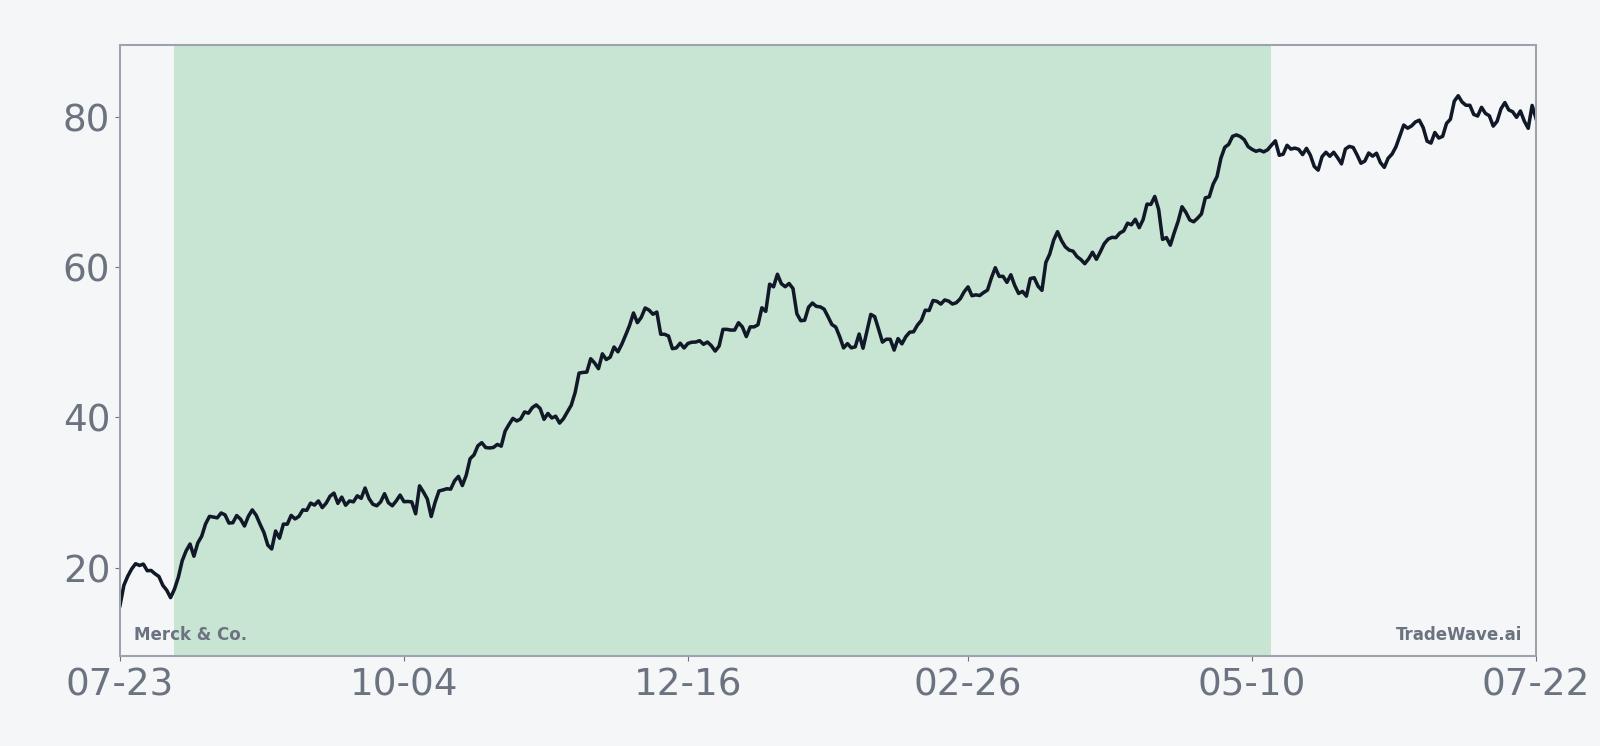
The historical seasonal trend line shows gains building steadily across the window rather than spiking in a single month. In several years, including 1986 and 1994, the stock saw strong advances early in the period, while other years such as 2018 and 2022 showed more of a stair-step pattern, with rallies clustered around earnings seasons and policy milestones.
Year-by-year net returns and intraperiod swings show how much upside and downside Merck has historically seen inside this window.
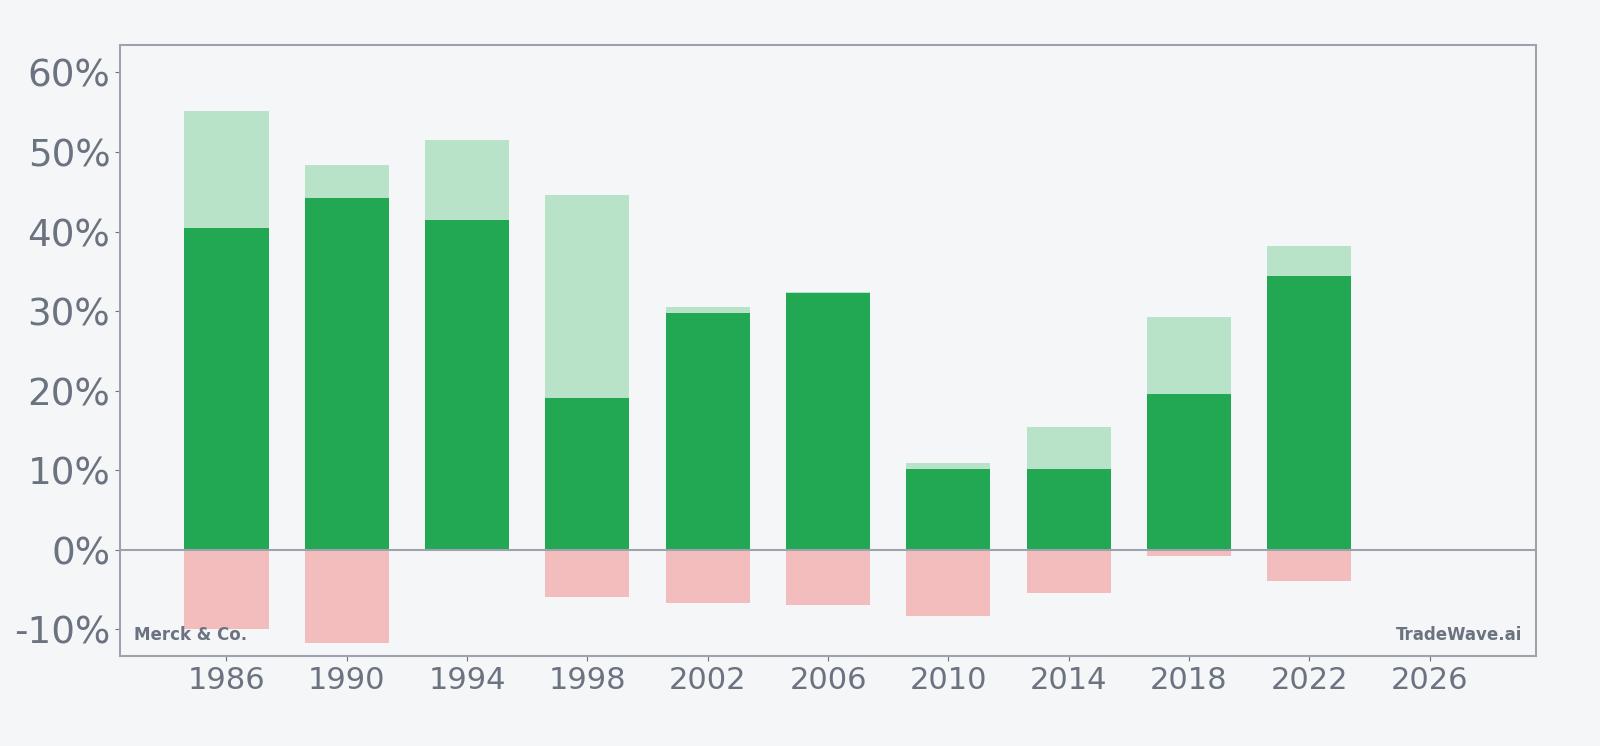
Maximum favorable moves have often been larger than the final net gains, with years like 1986 and 1994 showing peak run-ups above 50% before settling back by the exit date. At the same time, maximum adverse excursions have reached roughly 10% in several cycles, including 1990 and 2010, which means even winning years required sitting through meaningful drawdowns before the seasonal tailwind reasserted itself.
History does not guarantee future results; adverse excursions can still be large inside this window even when the final outcome has been positive in past years.
Why does Merck & Co. (MRK) follow this seasonal pattern?
This midterm-year pattern may reflect a mix of earnings clustering, policy shifts and sector rotation. One likely driver is that the window spans multiple quarterly reports and guidance updates, which can compound when investors are focused on drug pipelines and patent cliffs. Analysts have also pointed to the way healthcare stocks often benefit as markets look ahead to the year before the presidential election, when fiscal and regulatory uncertainty can ease and defensive growth names like Merck come back into favor.
What is driving Merck & Co. (MRK) today?
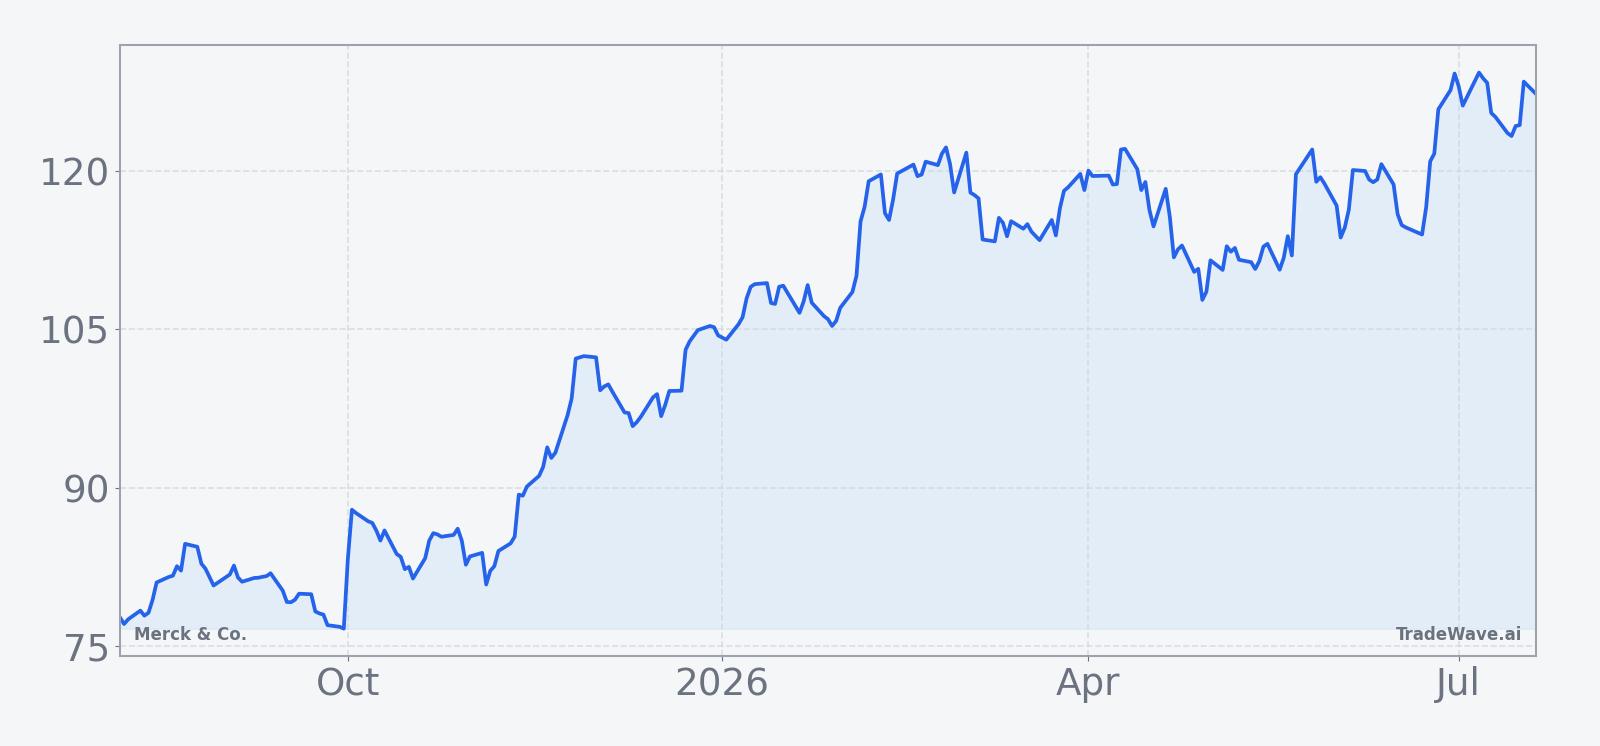
Merck & Co. ended the latest session at 124.40, down 3.10 points or 2.4% on the day, after trading between 124.22 and 127.89 on volume of about 7.7 million shares, below its 20-day average of roughly 10.3 million. The stock is about 5.6% below its 52-week high of 131.74 and sits above its 50-day moving average of 118.88, leaving it in a constructive uptrend but no longer stretched at the top of its range.
Fundamentally, the story is a tug-of-war between near-term execution and longer-term patent and pricing pressure. In Q1 2026, Merck reported revenue of $16.29 billion, ahead of expectations, and narrowed full-year sales guidance to $65.8 billion to $67.0 billion while raising its adjusted earnings outlook to $5.04 to $5.16 per share, helped by continued strength from cancer drug Keytruda and newer products.[4] Earlier guidance updates in February flagged that 2026 revenue would likely come in below prior Wall Street estimates as legacy products such as diabetes drug Januvia face loss of exclusivity and new Medicare pricing rules under the Inflation Reduction Act start to bite.[3]
Strategically, Merck has been leaning hard into oncology and new growth platforms to offset those headwinds. In November 2025, the company agreed to acquire Cidara Therapeutics for about $9.2 billion to add a long-acting antiviral for seasonal flu prevention, part of a broader push into infectious disease and respiratory franchises.[9] Around the same time, reports surfaced that Merck was in talks to buy Revolution Medicines and nearing a roughly $6 billion all-cash deal for Terns Pharma, moves aimed at deepening its cancer pipeline and extending the Keytruda franchise with next-generation combinations.[2][13]
Management has framed these deals and internal programs as the backbone of a new growth plan. In January 2026, Merck raised its mid-2030s target, saying it expects $70 billion in revenue from new businesses by that time, with larger contributions from cardiometabolic, respiratory and infectious disease assets alongside oncology.[6] That long-term ambition sits against a macro backdrop where patent expirations and drug pricing reforms are expected to pressure legacy sales, forcing large pharma names to buy or build their way into fresh revenue streams.[3]
The chart below situates the latest pullback in the context of Merck’s past year of trading and a 60-day seasonal projection.
What should traders watch as this seasonal window approaches?
First, the calendar. The Aug. 6 start date is less than three weeks away, and the 283-day span runs deep into the year before the presidential election, a phase that has often been friendlier to risk assets and healthcare stocks than the midterm year itself. How Merck trades into that date, especially around any guidance tweaks or pipeline headlines, will shape how much “fuel” the stock carries into a historically strong stretch.
Second, levels. On the upside, the 52-week high near 131.74 is the obvious reference point, with the 50-day moving average around 118.88 as a first line of support if volatility picks up. A pattern where pullbacks toward that moving average are bought, keeping price above the recent low near 124, would be consistent with the historical midterm-year seasonal trend. A decisive break below the 50-day line with heavy volume would be an early sign that this cycle may diverge from the past.
Third, the policy and patent tape. Any fresh detail on Medicare price negotiations, additional drugs added to pricing lists, or clarity on the timing of Keytruda’s eventual loss of exclusivity could change how investors value Merck’s long-duration cash flows.[3] At the same time, confirmation of large oncology or infectious disease deals, or positive trial data for pipeline assets, would reinforce the narrative that Merck can grow through the patent cliff.[6][9][13]
Finally, behavior inside the window itself will be the real test of this MRK seasonal trend. In prior midterm election years, the stock has often absorbed 5% to 10% drawdowns inside the window before finishing with strong gains. If this iteration sees similar intraperiod dips that are quickly reversed, with rallies clustering around earnings and regulatory milestones, it would fit the historical pattern. A choppy tape where selloffs deepen and bounces fade would signal that the election-cycle tailwind is being outweighed by company-specific or macro forces.
Sources
- Forbes, "Why Is Merck Stock Surging?", Nov 26, 2025
- Seeking Alpha, "Key deals this week: Merck, Glencore, CrowdStrike, Marvell Technology, Steel Dynamics and more", Jan 10, 2026
- Reuters, "Merck forecasts 2026 sales below estimates on patent losses", Feb 3, 2026
- CNBC, "Merck beats quarterly estimates on strength of Keytruda and new products, narrows outlook", Apr 30, 2026
- Reuters, "Merck posts higher third-quarter sales as Keytruda growth offsets drop from Gardasil", Oct 30, 2025
- Reuters, "Merck says new growth opportunities to drive revenue of $70 billion by mid-2030s", Jan 12, 2026
- Reuters, "Merck bets on flu prevention with $9.2 billion deal for Cidara Therapeutics", Nov 14, 2025
- Reuters, "Merck nears $6 billion acquisition of Terns Pharma to boost cancer portfolio, FT reports", Mar 24, 2026
- Forbes, "Is Merck Stock’s Run Legitimate?", Dec 24, 2025
About this seasonal analysis
Seasonal pattern data is sourced from TradeWave.ai, which analyzes historical price behavior across annual calendar windows going back up to 30 years. Read the full data methodology or the book The 100-Year Pattern by Afshin Moshrefi (2026 edition). Past performance of seasonal patterns does not guarantee future results. This article is for informational purposes only and does not constitute investment advice.