Ford Motor Company (F) Has Dropped in 9 of 10 Midterm Late-Summer Windows Since 1986
Ford Motor Company is up about 12% year to date, but a mid-August trading window tied to the midterm election year has historically leaned sharply bearish for the stock.
Price as of Jul 21, 2026: $14.27 (last close).

What is the seasonal pattern for Ford Motor Company (F)?
Ford Motor Company has fallen in 9 of 10 midterm-year late-summer windows starting around Aug 16, with an average loss of 5.2% in winning years for the short side.
- 9 for 10 in this window for shorts, with average winning-year declines of 5.2% and a 4% average move across all years.
- The 30-day trading window begins on Aug 16 and is grouped across the last 10 midterm election years, not consecutive calendar years.
- Percent Profitable is 90%, with 9 winning short years and just 1 losing year for this Ford Motor Company seasonal pattern.
- Avg Profit reflects only the years when the short worked, while Avg Profit - All folds in the lone losing year to show the full distribution.
- Intraperiod swings have been meaningful, with best-case runs in the trade direction and sharp adverse moves both showing up in individual years.
- The pattern sits in the midterm election year, just ahead of the transition into the historically stronger pre-election phase for cyclicals like autos.
According to historical data from TradeWave.ai, this late-summer stretch has behaved very differently from an average month for Ford, and the next iteration is approaching again.
How has Ford Motor Company (F) traded in this mid-August window?
Ford Motor Company has fallen in 9 of the last 10 midterm election years during the 30-day window that starts around Aug 16, making this one of the stock’s most consistently negative seasonal stretches for shorts to date. Shares finished Tuesday at $14.27, up 2.0% on the day and roughly 12% higher year to date, leaving the stock about 19.8% below its 52-week high of $17.78. That mix of a firm year-to-date gain and a historically weak late-summer window gives traders a clean contrast between current momentum and what the calendar has often delivered in past midterm cycles.
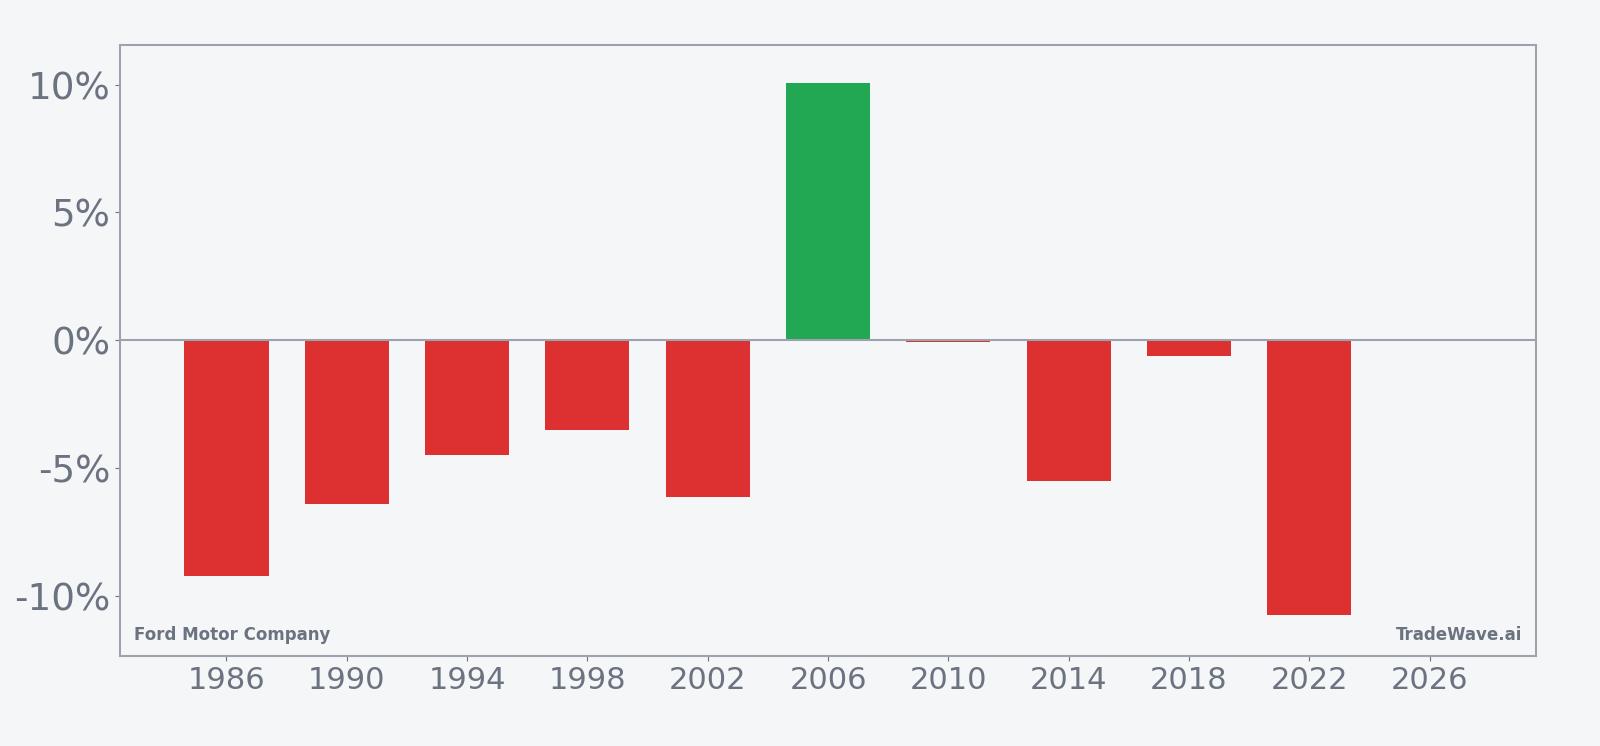
Because this pattern is grouped by the presidential election cycle, it only looks at Ford’s behavior in the midterm election year, then lines up those years on the calendar. That matters in 2026 because the market is in the midterm election year today and will roll into the year before the presidential election in 2027, a phase that has often been friendlier to cyclicals and autos than the midterm itself.
Across the last 10 midterm election years, the short side has been favored in this Ford Motor Company trading window. Percent Profitable sits at 90%, with 9 winning short years and just 1 losing year, and the average profit in those winning years is 5.2% for the short, compared with a 4% average move when every year is included. For a short pattern, that means Ford has typically drifted or broken lower during this slice of late summer, with only one year delivering a meaningful squeeze against the trade.
The per-year table shows how that plays out in individual cycles. In 2022, for example, the short would have gained 10.77% as Ford slid from an entry around $12.51 to an exit near $11.16, with the worst intraperiod drawdown from entry reaching about 12.05% at one point. In 1998, the short still finished ahead with a 3.52% gain, but the stock first rallied as much as 8.07% against the position before reversing, a reminder that even “good” years for the pattern have not been smooth.
On the flip side, 2006 stands out as the one losing year for shorts, with Ford rising 10.05% during the window and posting a maximum favorable move for longs of 14.77% while the short endured an adverse swing of about 11.5% from entry. That year is the outlier that drags the all-years average down from the 5.2% winner-only figure to 4%, and it shows how a single strong rally can dent an otherwise consistent short pattern.
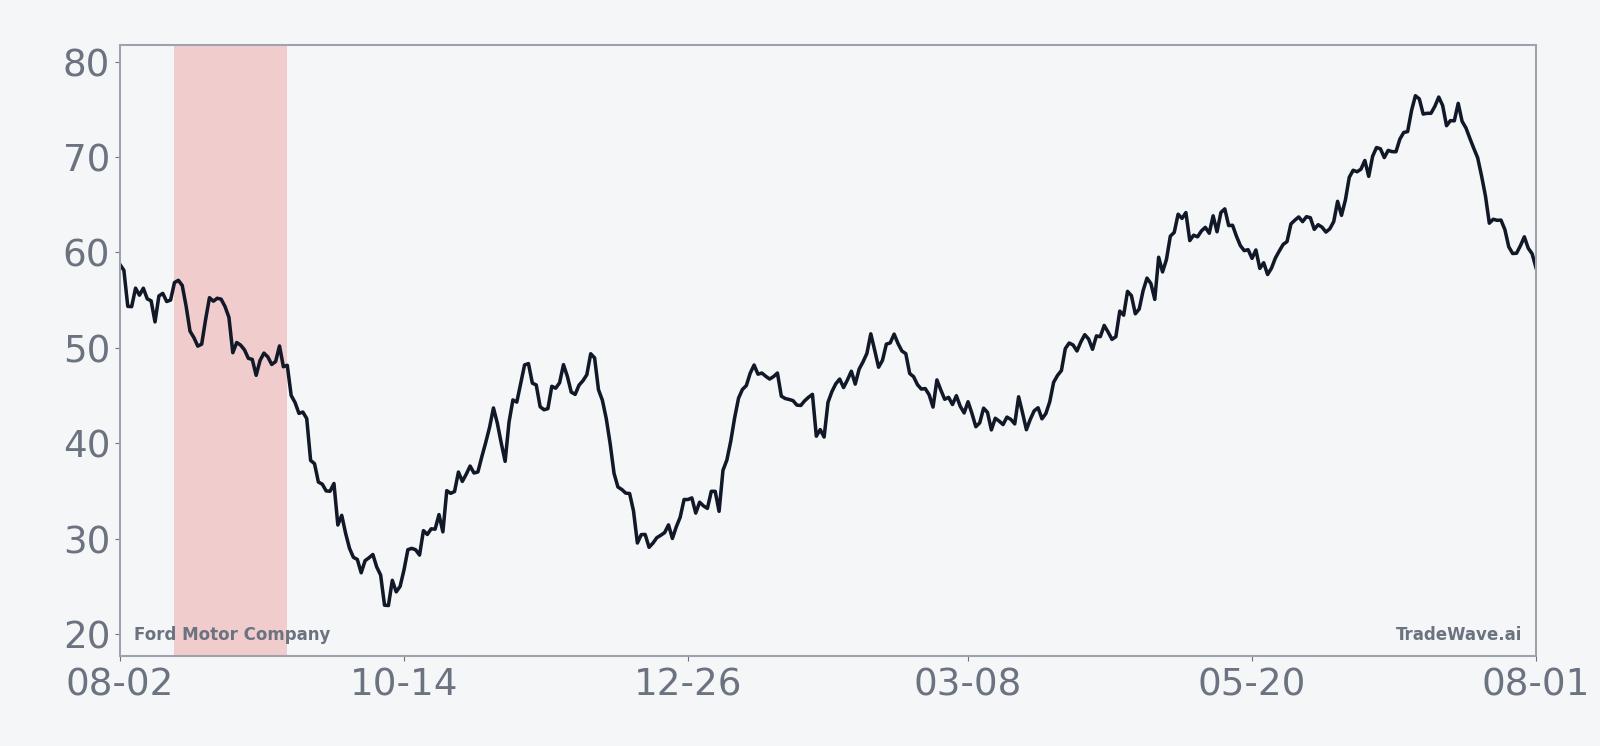
The historical seasonal average curve slopes gently in favor of the short side, with much of the net move accruing in the middle of the 30-day span rather than in a single sharp break. That suggests a tendency for Ford to weaken in stages during this period in midterm years, even though individual cycles have featured both early pops and late fades.
Year-by-year net returns and intraperiod swings show how often shorts have worked and how large the rallies and drawdowns have been.
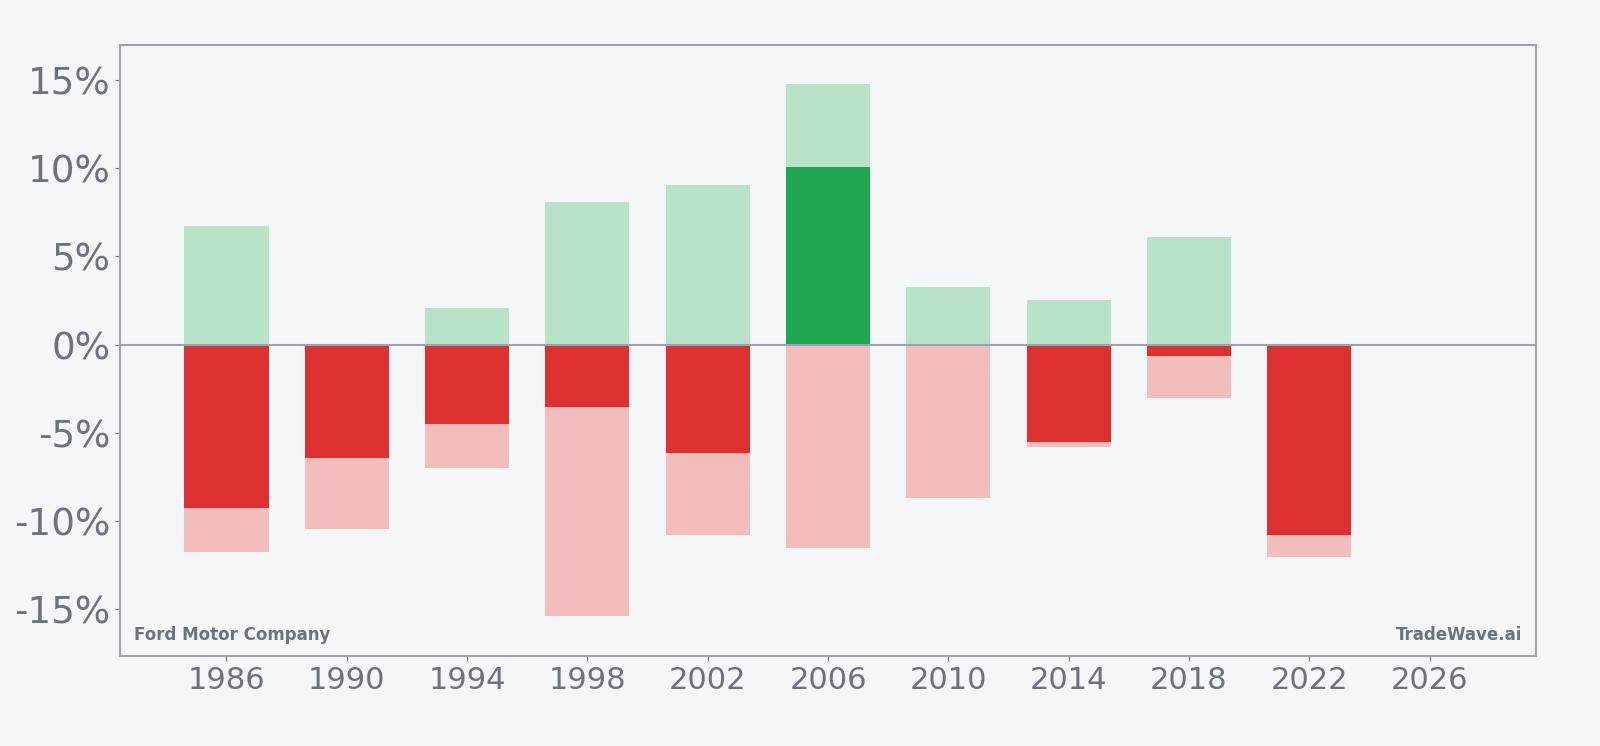
The combined net/MFE/MAE bars highlight a key feature of this Ford seasonal trend: even in years when the short ultimately paid off, the stock often staged sizable countertrend rallies before rolling over. Large maximum favorable moves for the short sit alongside notable adverse excursions, which means this has historically been a window where direction has favored shorts but volatility has demanded patience and risk control.
History does not guarantee future results; adverse excursions can be large even in winning windows, and past seasonal behavior may not repeat.
Why does Ford Motor Company (F) follow this seasonal pattern?
One likely driver is the way the auto sector lines up its production schedules, incentives and model-year transitions around late summer, which can pressure pricing and margins just as investors reassess demand. Analysts have also pointed to midterm election years as periods when policy uncertainty around tariffs, emissions rules and tax credits can weigh more heavily on cyclical names like Ford. This pattern may reflect that combination of model-cycle noise and policy risk hitting the tape at the same time each midterm year.
What is driving Ford Motor Company (F) today?
Ford Motor Company closed Tuesday at $14.27, up 2.0% on the session, with the stock roughly 12% higher so far in 2026 and trading just above its 50-day moving average around $14.20 on 48.8 million shares of volume. The move comes a few weeks after Ford reported that its U.S. sales for the second quarter of 2026 fell 10.3% to 549,200 vehicles, driven by a 40.7% drop in EV sales even as Bronco and Maverick Hybrid set records, underscoring a pivot toward hybrids and profitable trucks as pure EV demand cools.[5]
The chart below situates the latest move in its recent multi-month context, alongside a 60-day seasonal projection.
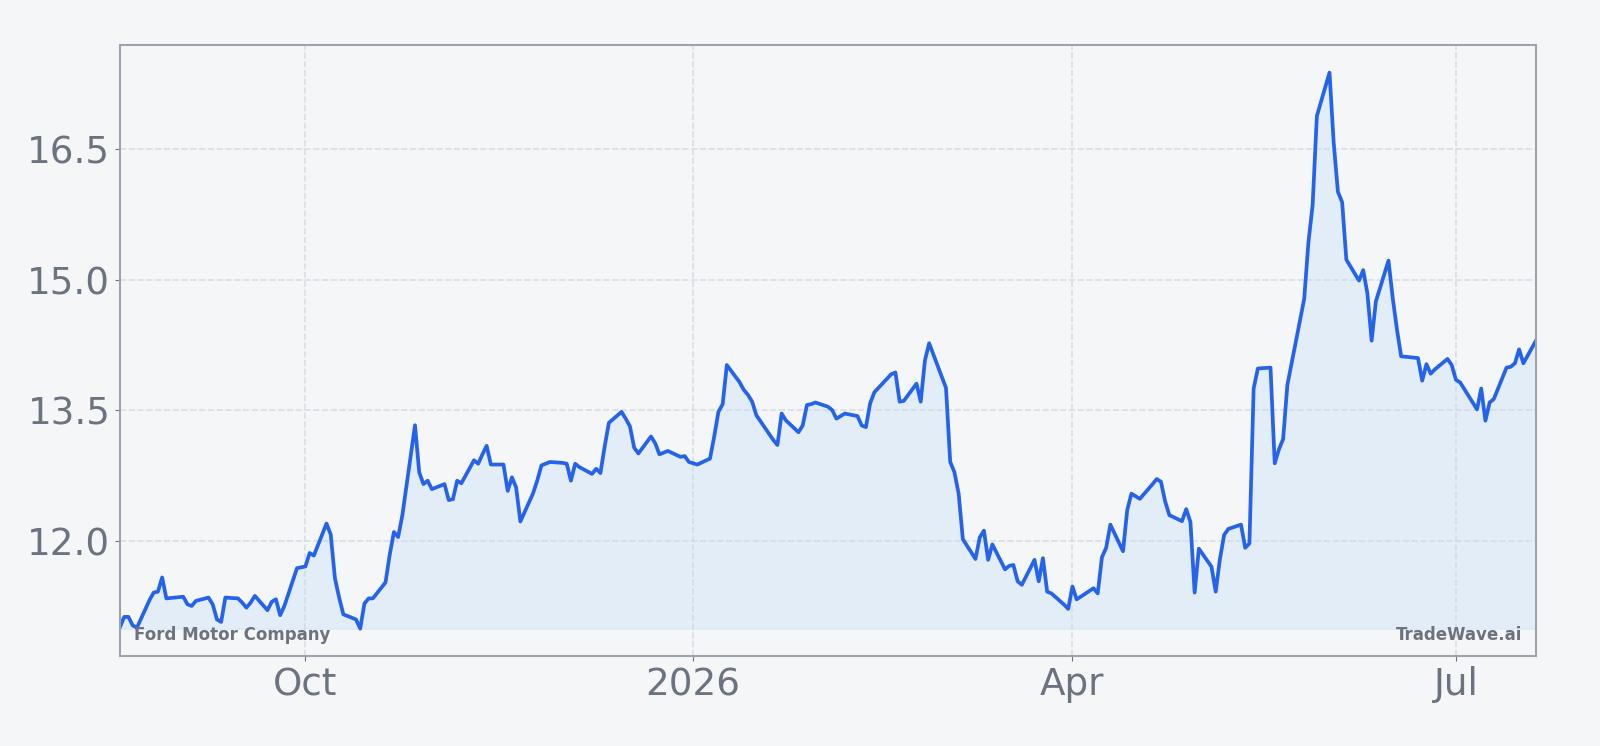
In May 2026, Ford also launched its Ford Energy subsidiary targeting at least 20 GWh of annual energy storage deployments by late 2027, a move that drew praise from some Wall Street analysts as an “AI-adjacent” growth avenue and helped spark double-digit daily gains in the stock around the announcement.[4][6] Those volume spikes signaled that investors are willing to pay up for credible non-auto earnings streams, even as the core EV business faces pressure from weaker demand and shifting U.S. tax incentives.[5]
Macro and policy crosscurrents remain part of the story. In 2025, analysts highlighted tariffs and supply-chain disruptions, including a Novelis plant fire, as headwinds for Ford’s production and margins, while also flagging the impact of changing EV tax credits on demand.[1][2] By early 2026, Ford’s Q4 2025 earnings preview pointed to sizable one-time restructuring charges and postretirement adjustments, reinforcing the sense that the company is still mid-transition as it retools its portfolio and cost base for a slower EV ramp and new energy-storage ambitions.[3]
Layered on top of that is the presidential election cycle backdrop. The market is in the midterm election year today, a phase that has often been choppier for cyclicals as investors digest policy risk, before the historically stronger year before the presidential election kicks in. For Ford, the upcoming mid-August seasonal window sits squarely in that midterm phase, which has historically been a time when the stock has drifted lower even when the broader auto narrative looked constructive.
What should traders watch as this Ford seasonal window approaches?
First, the calendar: the 30-day window begins on Aug 16, so price action in the final weeks of July and early August will set the starting point for any seasonal move. A push back toward the $17 area before the window opens would give shorts more room to work if history rhymes, while a slide closer to the 52-week low would blunt the typical downside. Second, watch how Ford trades around upcoming macro headlines on tariffs, EV incentives and industrial activity, since prior midterm years have seen policy noise amplify moves in this stock.[1][2]
Third, monitor whether the volume and enthusiasm that greeted Ford Energy in May resurface on any new announcements or customer wins, or whether that interest fades into the background as investors refocus on autos.[4][6] Persistent heavy upside volume into the window would look more like 2006, the one losing year for shorts, while a quieter tape with rallies that stall quickly would be more in line with the nine prior winning short cycles. Finally, traders will be watching whether Ford’s behavior in this midterm-year window lines up with its historical pattern or instead starts to resemble the more constructive tone that has often emerged as markets transition into the year before the presidential election.
Sources
- CNBC, "Ford Motor is set to report earnings after the bell. Here's what Wall Street expects" (Jul 30, 2025)
- CNBC, "Ford Motor is set to report earnings after the bell. Here's what Wall Street expects" (Oct 23, 2025)
- CNBC, "Ford Motor is set to report results after the bell. Here's what Wall Street expects" (Feb 10, 2026)
- Yahoo Finance, "Ford shares jump 6% as Morgan Stanley hails CATL-backed energy business" (May 13, 2026)
- Yahoo Finance, "Ford Q2 sales slide 10% on EV drop and model phase-outs; Bronco and Maverick hybrid set records" (Jul 2, 2026)
- MarketWatch, "Ford’s stock is the S&P 500’s biggest gainer. The carmaker is putting a very Tesla spin on things." (May 13, 2026)
About this seasonal analysis
Seasonal pattern data is sourced from TradeWave.ai, which analyzes historical price behavior across annual calendar windows going back up to 30 years. Read the full data methodology or the book The 100-Year Pattern by Afshin Moshrefi (2026 edition). Past performance of seasonal patterns does not guarantee future results. This article is for informational purposes only and does not constitute investment advice.