Merck & Co. (MRK) Near Highs as 100% Profitable Aug 29-Apr 29 Window Opens for Bulls
Merck & Co. is about to enter a historically powerful 244-day trading window just as shares hover near record highs after a pipeline-fueled run, raising the stakes for options-heavy bulls.
Price as of Aug 27, 2026: $149.54 (last close).

What is the seasonal pattern for Merck & Co. (MRK)?
Merck & Co. has risen in 15 of 15 midterm-year windows starting Aug 29, with an average gain of 22.48% in winning years.
- 15 for 15 in this window, averaging 22.48% gains in winning years across the last 15 midterm election cycles.
- Seasonal window runs from Aug 29 through Apr 29, spanning 244 calendar days in the midterm election year.
- Percent Profitable is 100%, with 15 winners and 0 losers over the historical sample.
- Median outcome is a 22.85% gain, with a Sharpe ratio of 2.02 that signals unusually strong risk-adjusted returns.
- TradeWave Ratio of 2.22 indicates price has typically traveled meaningfully in the long direction within the window, not just at the close.
- Intraperiod swings have included double-digit drawdowns in some years, so the path has not been a straight line even in winning cycles.
According to historical data from TradeWave.ai, this upcoming stretch for Merck & Co. has behaved very differently from an average year in past midterm election cycles. The next section walks through how that pattern has played out and where the risks have clustered.
How strong is Merck & Co. (MRK) in the Aug 29 to Apr 29 midterm-year window?
Merck & Co. has posted gains in every one of the last 15 midterm-year windows starting on Aug 29, averaging a 22.48% advance over 244 days. Shares finished Thursday at $149.54, down 2.3% on the day but still up 50.9% year to date and about 4.7% below their 52-week high of $156.92.[1][7] Heavy call-option buying and a spike in derivatives volume tied to positive melanoma vaccine data have added fuel to the bullish setup heading into this historically strong stretch.[10]
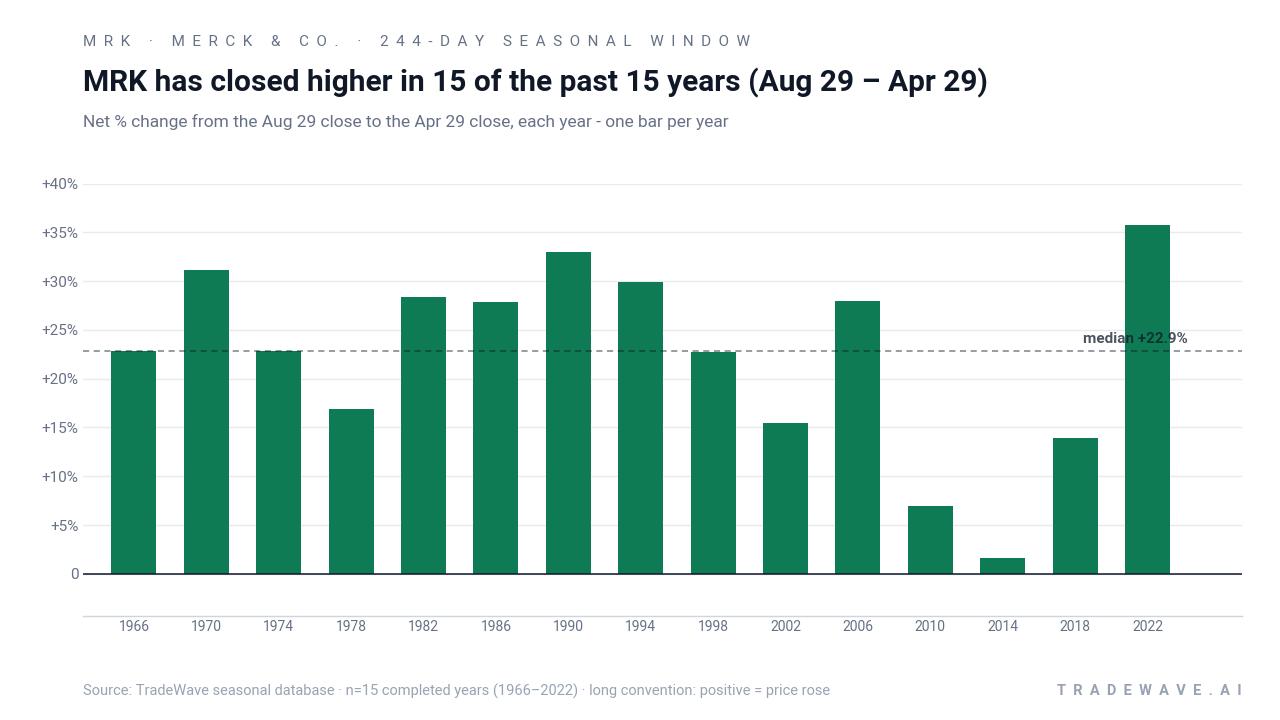
Grouping the data by the presidential election cycle matters here because this window sits in the midterm election year, a phase that often brings policy noise early on and a more constructive risk tone as markets look ahead to the pre-election year. In Merck’s case, the Aug 29 to Apr 29 slice captures that transition, from mid-cycle uncertainty into a period when healthcare policy and reimbursement risk tend to be clearer.
Across the last 15 midterm election years, the long-only strategy in this window has delivered a 22.1% annualized return and a 1,897% cumulative gain when the window is stacked year after year. The median outcome of 22.85% is close to the average, which suggests the pattern is not being skewed by a single outlier year. For a large-cap drug manufacturer, that is an unusually consistent seasonal trend.
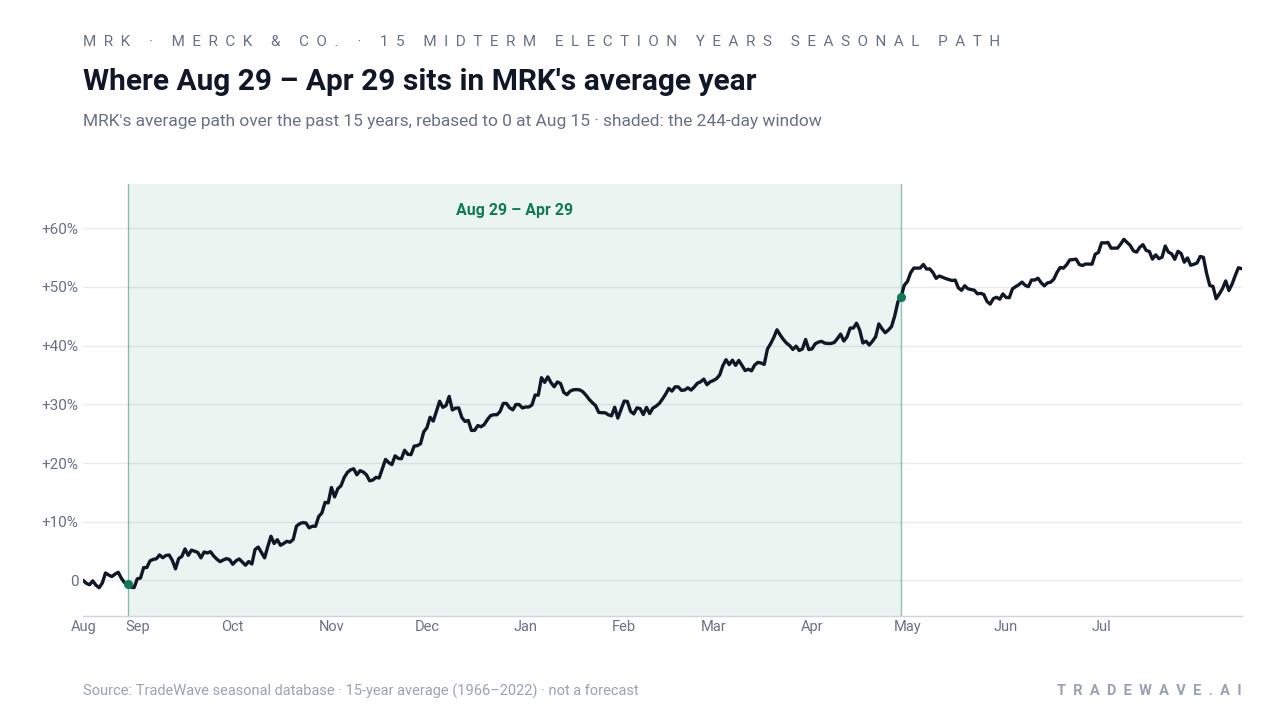
A second view shows how far MRK has typically swung both for and against longs inside each of those winning years.
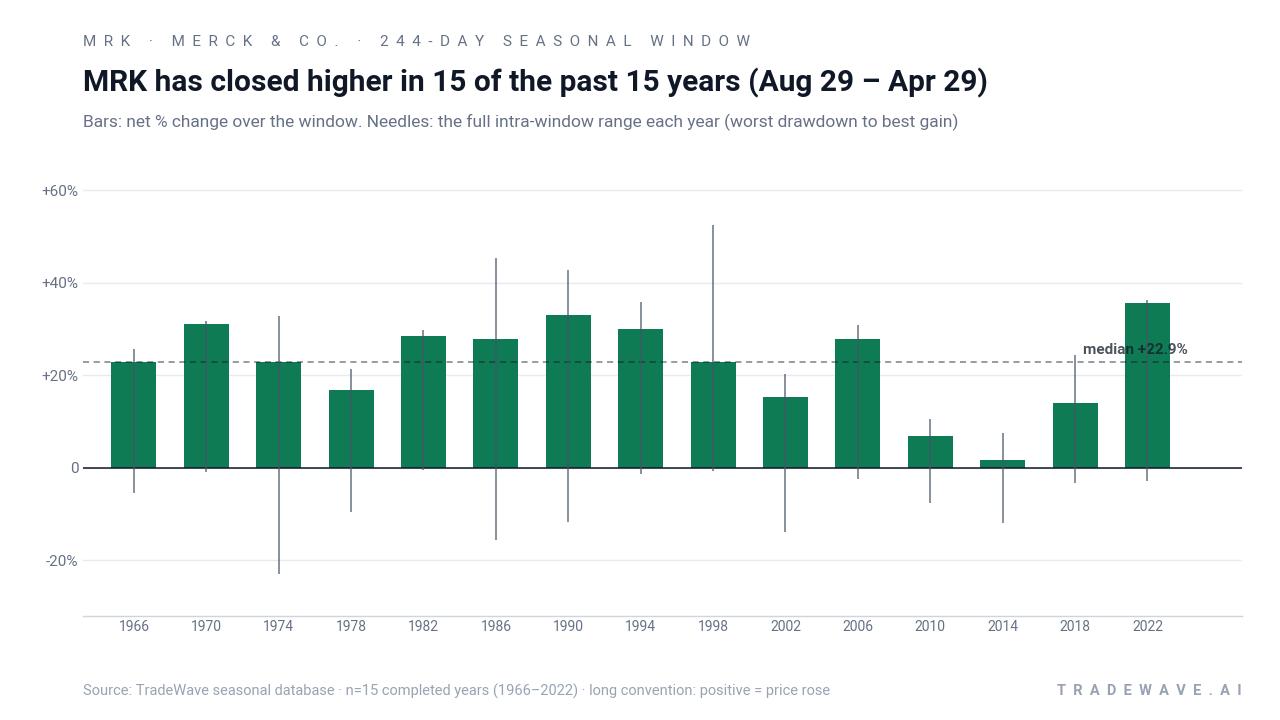
Per-year data show how that plays out in practice. In 2022, Merck gained 35.72% over the window, with a best intraperiod run-up of 36.33% and a worst drawdown of just 2.88% from the entry. Earlier cycles were choppier: in 1986 the stock finished up 27.88% but endured a 15.69% drawdown at one point, while 1998 saw a 22.78% gain with a 52.44% peak rally and only a shallow 0.81% dip from entry. The mix of large maximum favorable moves and sometimes deep maximum adverse moves underlines that this has been a high-conviction long window, but not a low-volatility one.
The cumulative chart of this midterm-year window is almost a straight climb, compounding to a 1,897.8% gain across the 15-sample history. There are no flat stretches where the pattern stalls for multiple cycles, which is unusual for a single-stock seasonal regime. Add it up: 15 for 15 with double-digit average gains and a Sharpe ratio above 2 is a rare combination for a blue-chip healthcare name.
History does not guarantee future results; even in a perfect 15-for-15 record, intraperiod drawdowns have reached double digits in some years, and MAE can be large before the window ultimately finishes higher.
Why does Merck & Co. (MRK) follow this seasonal pattern?
One likely driver is the way Merck’s earnings calendar and major oncology data releases cluster between late summer and the following spring, which can keep a steady stream of catalysts in front of investors.[5][7] Institutional portfolio rebalancing around year-end, combined with healthcare’s defensive role when macro or policy uncertainty is high in midterm election years, may also support flows into large-cap drug makers during this stretch.[1] The pattern may further reflect sector rotation as investors move from early-year growth themes into more stable cash-generating names ahead of the pre-election year.
What is driving Merck & Co. (MRK) today?
Merck shares closed Thursday at $149.54, down 2.3% on the session after a strong run that has left the stock up 50.9% year to date and within striking distance of a fresh 52-week high at $156.92.[1][7] The move caps a week in which Merck notched a new high on the back of positive Phase III data for a personalized melanoma vaccine developed with Moderna, a result that has reinforced the company’s leadership in oncology and helped justify a valuation premium to the broader drug manufacturers group.[1][7]
In August 2026, Zacks-linked coverage highlighted that Merck’s most recent quarter delivered $16.29 billion in revenue, up 4.9% year over year and ahead of consensus, with full-year EPS and revenue estimates pointing to low single-digit growth from an already elevated base.[2][5] That fundamental backdrop has drawn in institutional buyers, with recent filings showing new or increased positions from firms including First National Bank of Omaha, Jupiter Wealth Management, Oversea Chinese Banking Corp and Great Lakes Advisors.[11][12][13][14] At the same time, MarketBeat reported a surge in call-option activity, with 68,587 call contracts trading in one session, roughly 188% above average, as traders positioned around the melanoma vaccine news.[9][10]
The chart below puts this year’s rally and the latest pullback in context, alongside a historical seasonal projection for the next two months.
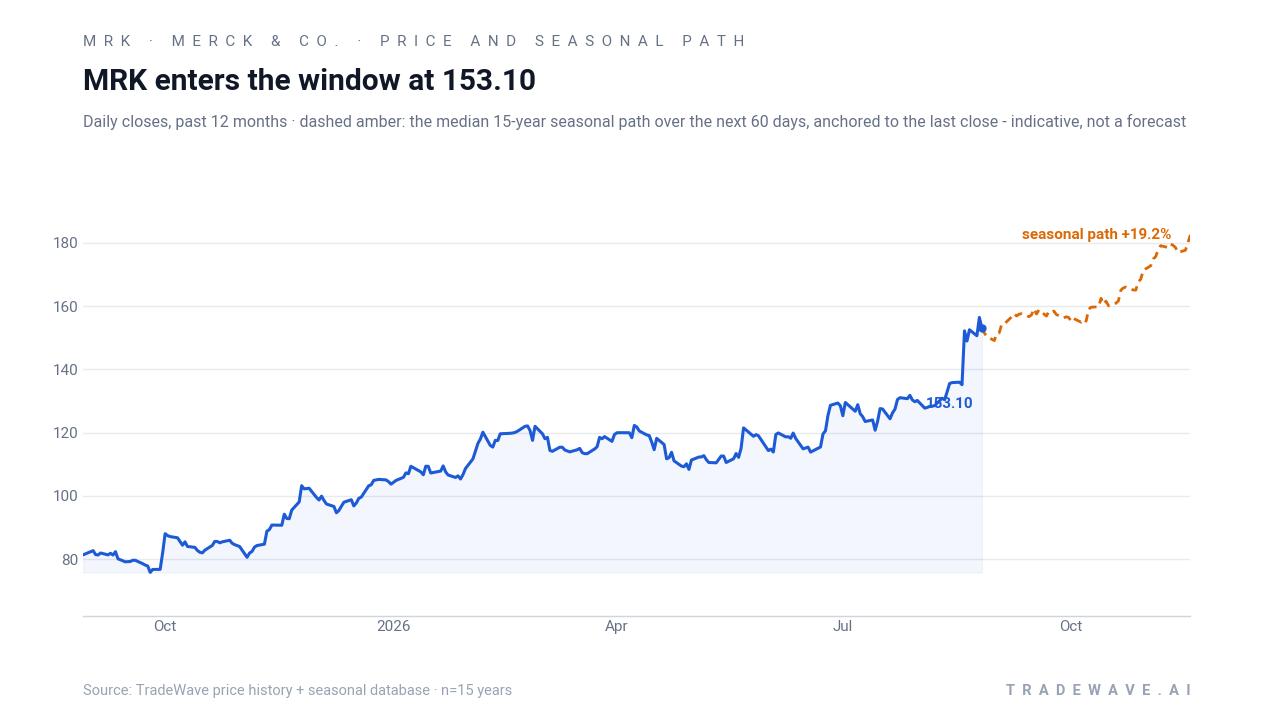
Macro conditions have also been supportive. Federal Reserve commentary around the path of interest rates has helped fuel a broader equity rally, and large-cap healthcare has benefited as investors look for earnings resilience in a slowing but still growing economy.[6] Within that healthcare seasonal outlook, Merck’s combination of a strong oncology franchise, visible earnings and a powerful midterm-year trading window has made it a focal point for both long-only managers and options traders.
What should traders watch as this Merck & Co. seasonal window opens?
As the Aug 29 start date hits, the first thing to watch is whether MRK respects the historical pattern of grinding higher through the fall and into early spring, or whether a deeper drawdown appears early in the window. Price action around the $156.92 52-week high and any attempt to build support in the mid-$140s will offer a quick read on whether this cycle is tracking the historical seasonal trend or breaking from it.[1][7]
Second, the options tape bears close monitoring. If call volumes remain elevated and implied volatility stays bid following the melanoma vaccine headlines, that would suggest speculative and hedging demand is reinforcing the long seasonal bias.[9][10] A sharp fade in call activity or a rotation into puts, especially around upcoming earnings dates or major policy headlines, would signal that traders are less willing to lean on the 15-for-15 track record.
Third, institutional flows will matter. Continued 13F and filing activity from banks, wealth managers and overseas institutions would confirm that the recent buying spree was not a one-off reaction to trial data but part of a broader allocation into large-cap pharma.[8][11][12][13][14] A pause or reversal in those flows during the window would not invalidate the historical pattern, but it would reduce one of the tailwinds that has often been present in prior cycles.
Finally, the policy calendar looms in the background. As the midterm election year gives way to the year before the presidential election, any shifts in drug pricing rhetoric, Medicare negotiation rules or broader healthcare reform talk could inject volatility into a window that has historically been friendly to longs.[1][6] For traders, the key tell will be whether MRK can absorb those headlines while maintaining its typical seasonal climb, or whether a break in that behavior signals a different playbook for this cycle.
Sources
- Yahoo Finance (quote page) - Merck & Co., Inc. (MRK) Stock Price, News, Quote & History
- Yahoo Finance (Zacks article) - Investors Heavily Search Merck & Co., Inc. (MRK): Here is What You Need to Know
- Yahoo Finance (analysis) - Merck (MRK) Stock After 53% One-Year Gain Is DCF Signaling Further Upside Potential
- Yahoo Finance (article) - Merck (MRK) Stock Sinks As Market Gains: Here's Why
- Yahoo Finance (article) - Merck (MRK) Stock Falls Amid Market Uptick: What Investors Need to Know
- Yahoo Finance (news) - Why Merck (MRK) Stock Is Trading Up Today
- Yahoo Finance (Zacks article) - Merck Stock Hits New 52-Week High: What's Driving the Rally?
- MarketBeat - Merck & Co., Inc. $MRK Shares Sold by ANTIPODES PARTNERS Ltd
- MarketBeat (options chain) - Merck & Co., Inc. (MRK) Options Chain & Prices 2026
- MarketBeat (instant alert) - Stock Traders Buy High Volume of Merck & Co., Inc. Call Options (NYSE:MRK)
- MarketBeat (instant alert) - First National Bank of Omaha Acquires 8,026 Shares of Merck & Co., Inc. $MRK
- MarketBeat (instant alert) - Jupiter Wealth Management LLC Buys Shares of 13,800 Merck & Co., Inc. $MRK
- MarketBeat (instant alert) - OVERSEA CHINESE BANKING Corp Ltd Takes $969,000 Position in Merck & Co., Inc. $MRK
- MarketBeat (instant alert) - Great Lakes Advisors LLC Makes New Investment in Merck & Co., Inc. $MRK
About this seasonal analysis
Seasonal pattern data is sourced from TradeWave.ai, which analyzes historical price behavior across annual calendar windows going back up to 30 years. Read the full data methodology or the book The 100-Year Pattern by Afshin Moshrefi (2026 edition). Past performance of seasonal patterns does not guarantee future results. This article is for informational purposes only and does not constitute investment advice.