8-for-8 Midterm Run: Amphenol (APH) Enters a 202-Day Window With 100% Profitable Years
Amphenol is trading near record territory as it heads toward a historically strong midterm-year trading window that has never produced a loss in this dataset.
Price as of Aug 27, 2026: $161.38 (last close).

What is the seasonal pattern for Amphenol (APH)?
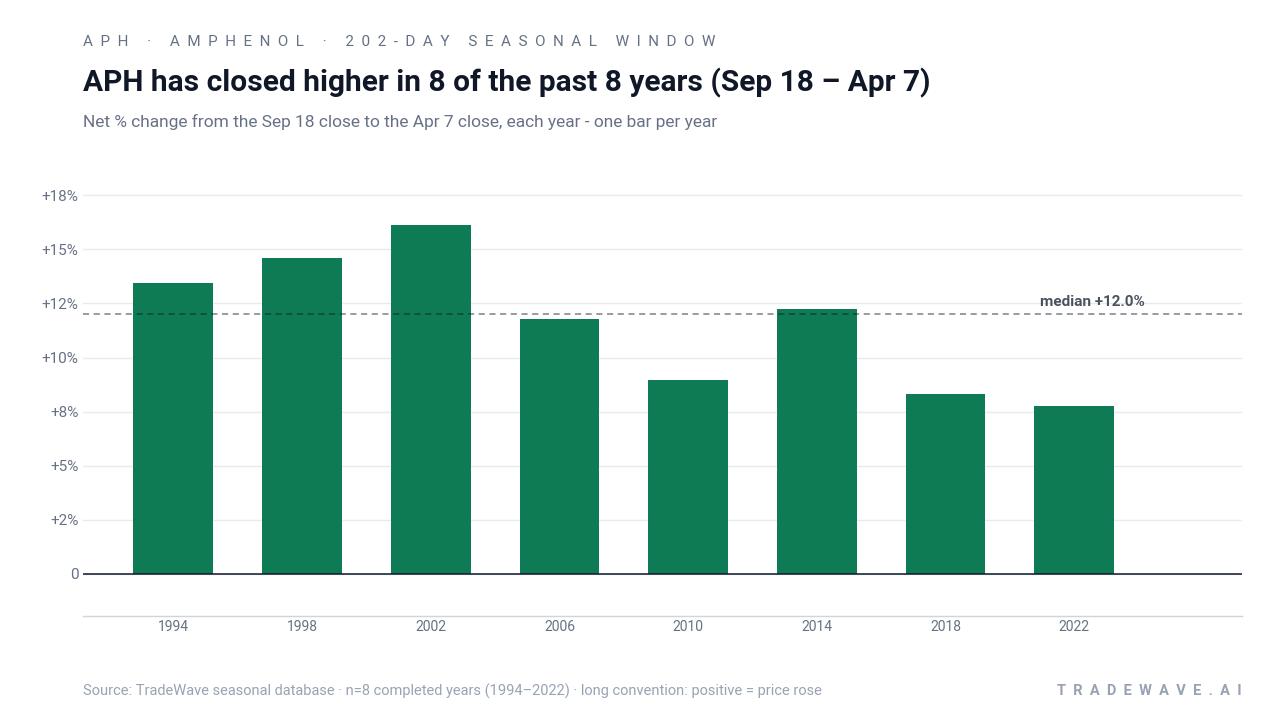
Amphenol has risen in 8 of 8 midterm-year Sep 18 to Apr 7 windows, with an average gain of 11.66% in winning years.
- 8 for 8 in this window, with Amphenol averaging 11.66% gains across all completed midterm-year cycles.
- Seasonal window runs from Sep 18 through Apr 7, spanning 202 days in the midterm election year.
- Percent Profitable is 100%, with 8 winners and 0 losers in the historical sample.
- Average winner gain of 11.66% stacks to a 140% cumulative return when the window is repeated across the eight cycles.
- Intraperiod swings have been meaningful, with individual years seeing double-digit drawdowns even as they finished higher.
- Pattern is aligned with a long trade direction, matching Amphenol’s role as a structural growth name in electronic components.
According to historical data from TradeWave.ai, Amphenol’s midterm-year behavior around late September has followed a remarkably consistent script across past cycles.
How has Amphenol (APH) traded in this midterm-year window?
Amphenol has posted gains in every single Sep 18 to Apr 7 midterm-year window across the last eight cycles, averaging an 11.66% advance with no losing years. Shares finished Thursday at 161.38, up 0.02% on the day and about 9.6% below their 52-week high of 178.52, after rallying 19.83% year to date.[1] That combination of a clean seasonal track record and a stock sitting just under its highs gives this upcoming 202-day trading window unusual weight for investors trying to time exposure to the AI and connectivity build-out.
Because this pattern is grouped by the presidential election cycle, it reflects how Amphenol has behaved specifically in the midterm election year as policy uncertainty peaks and investors start to look ahead to the pre-election year. That matters for a hardware supplier tied to capital spending and AI infrastructure, where budget timing and regulatory tone can shift meaningfully between midterm and pre-election phases.[2]
Across the eight midterm-year samples from 1994 through 2022, the window’s 100% win rate comes with an 11.62% annualized return and a 140% cumulative gain when the window is repeated back to back. The median outcome is a 12.01% gain, which lines up closely with the average, suggesting the pattern is not being skewed by a single outlier year. For a long trade direction, that kind of consistency is rare, especially in a cyclical technology supplier.
The per-year table shows that the strongest midterm-year window came in 2002, when Amphenol gained 16.11% between Sep 18 and Apr 7, after experiencing a best intraperiod run-up of 30.18% and a worst drawdown of 21.95%. At the other end of the spectrum, 2018 delivered the softest net gain at 8.33%, but even that year saw a 21.2% intraperiod drawdown before finishing higher. Add it up: every cycle has paid off for longs in this window, but none have been a straight line.
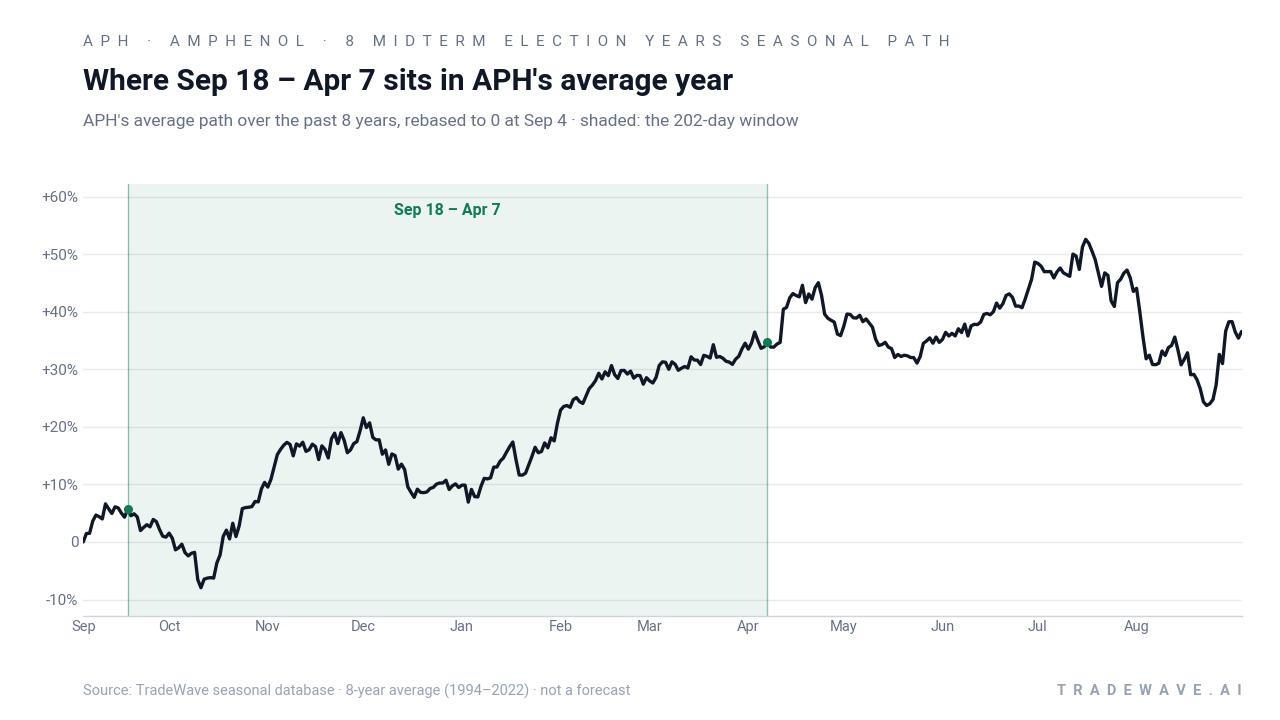
A second view of yearly ranges shows how much Amphenol has typically swung inside the window before settling at those positive closes.
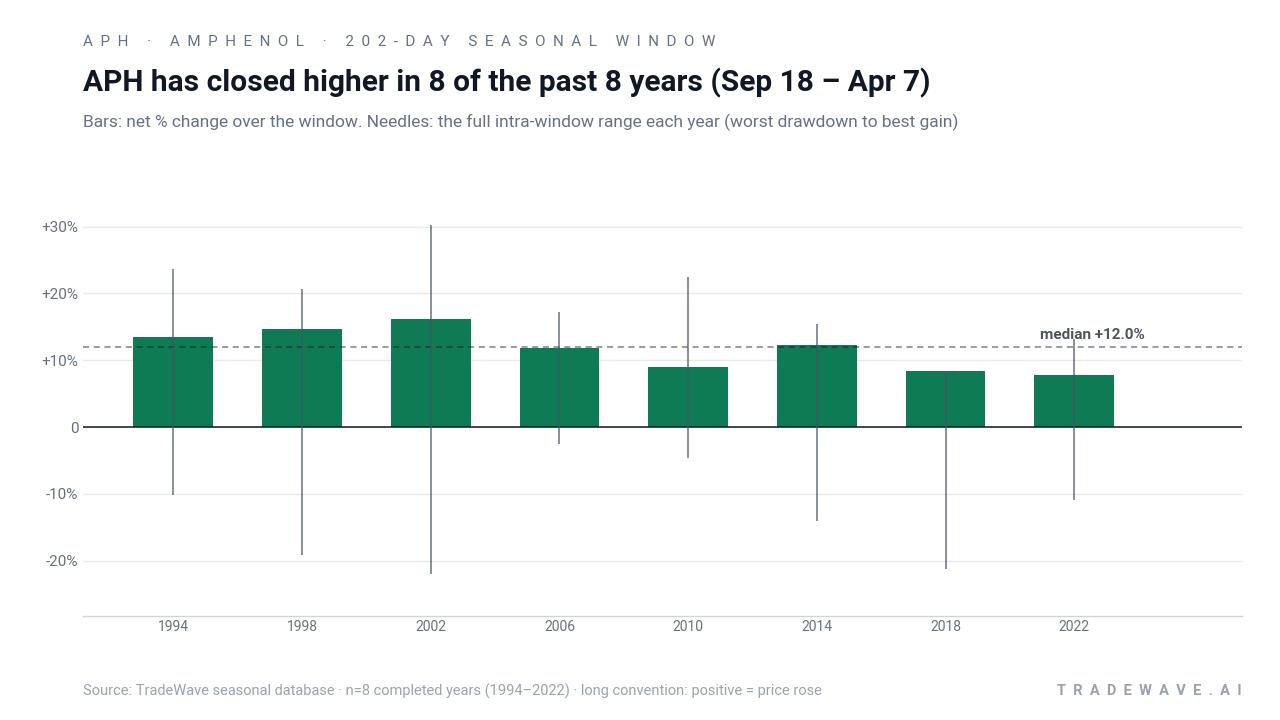
The stacked net, best-case and worst-case excursions show a clear pattern: Amphenol’s maximum favorable move inside the window has often run into the high teens or low 20s in percentage terms, while maximum adverse moves have at times pushed into the low 20s on the downside. That profile fits a long setup with meaningful upside potential but real air pockets along the way, not a low-volatility grind. The high TradeWave Ratio of 2.46 and Sharpe ratio of 3.08 capture that the typical travel in the trade direction has been substantial relative to the volatility of end-of-window outcomes.
History does not guarantee future results; adverse excursions can be large even in winning windows, and past midterm-year behavior may not repeat.
Why does Amphenol (APH) follow this seasonal pattern?
One likely driver is the way Amphenol’s customers set capital budgets and place orders around the fiscal year, with networking and electronics spending often ramping from late Q3 into early spring. Analysts have also pointed to the company’s exposure to AI-related infrastructure, where deployment cycles tend to accelerate as cloud and hyperscale customers lock in next-year capacity plans.[2] The midterm-to-pre-election transition can amplify that effect as policy uncertainty fades and risk appetite improves, helping a stock like Amphenol benefit from both sector rotation and stronger order visibility.
What is driving Amphenol (APH) today?
Amphenol closed Thursday at 161.38, essentially flat on the day, leaving the stock up 7.34% over the past month and 19.83% year to date as investors lean into its role as an electronic components supplier to AI and high-speed connectivity markets.[1][2] That level keeps APH about 9.6% below its 52-week high of 178.52, a zone where some investors have been willing to sell into strength, as shown by a string of insider sales and conversions in late 2025 at prices around the low-140s.[1][4] At the same time, options traders have expressed confidence in the downside floor, including a highlighted sale of 5,500 July 17, 2026 $105 puts at $1.40 that effectively bet the stock would stay well above those levels.[5]
Fundamentally, Amphenol is coming off a strong stretch. Q1 FY26 results showed record sales and adjusted diluted EPS that topped guidance, and management guided Q2 sales and earnings above Wall Street estimates, reinforcing the narrative that AI-related demand and connectivity upgrades are driving a durable growth runway.[1][2] Yahoo Finance’s aggregated analyst data pegs the stock at a Buy rating with a consensus 12‑month price target of 192.12, reflecting optimism that the company can keep compounding earnings as cloud, automotive and industrial customers upgrade their systems.[1][6] Short interest remains modest, with a short-interest ratio around 2.1 days to cover as of late August, suggesting limited pressure from bearish positioning even after the stock’s run.[3]
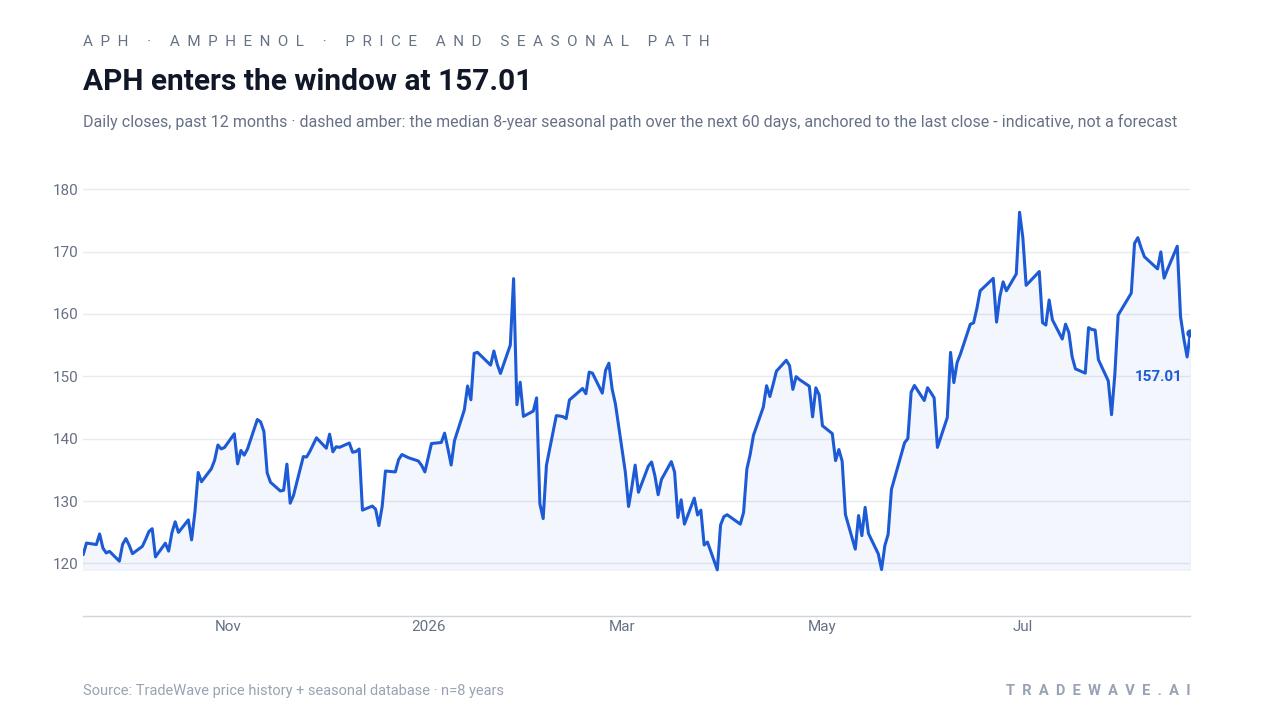
The chart below situates the latest move against the past year of trading and the median seasonal path over the next two months.
What should traders watch as this Amphenol window approaches?
First, the calendar: the 202-day seasonal window opens on Sep 18 and runs through Apr 7, overlapping Amphenol’s next earnings report on Oct 28 and the heart of the midterm election year policy debate.[1] How the stock trades around that earnings print, especially if AI-related orders and guidance stay firm, will be an early test of whether this cycle can keep the 8-for-8 streak alive.[2]
Second, levels: traders will be watching whether APH can retake the 178.52 high without first revisiting deeper support, given that past windows have tolerated intraperiod drawdowns of 10% to 20% before finishing higher.[1] A push to new highs with contained downside would rhyme with the stronger historical years like 2006, while a sharp shakeout followed by recovery would look more like 2002 or 2018.
Third, positioning and sentiment: options flow and short interest will be key tells. If large put sellers continue to step in around deep out-of-the-money strikes, as they did with the July 2026 $105 line, it would signal ongoing confidence in the long-term floor even if volatility picks up inside the window.[3][5] Conversely, a build in short interest or a shift toward protective call overwriting would suggest investors are less willing to lean on the historical seasonality.
Finally, the macro and policy backdrop: as the midterm election year moves toward its late phase, any change in fiscal stance, industrial policy or tech regulation that affects AI infrastructure spending could either reinforce or blunt the usual seasonal tailwind. For a stock that has never lost money in this specific midterm-year window across the last eight cycles, how APH behaves between Sep 18 and Apr 7 will be a clean read on whether that pattern still matters in an AI-driven market.
Sources
- Yahoo Finance - Amphenol Corporation (APH) Stock Price, News, Quote & History - Yahoo Finance
- Insider Monkey / Yahoo Finance syndication - Analyst Raises Amphenol (APH) Price Target Citing AI-Related Growth Opportunities
- MarketBeat - Amphenol (APH) Short Interest & Short Float | Updated Aug 2026
- Yahoo Finance - Amphenol Corporation (APH) Recent Insider Transactions - Yahoo Finance
- Yahoo Finance - Is Amphenol Corporation (APH) A Good Stock To Buy Now?
- Yahoo / Simply Wall St (via finance.yahoo.com) - Amphenol (APH) Stock Fair Value Edges Higher After Analyst Target Increases
About this seasonal analysis
Seasonal pattern data is sourced from TradeWave.ai, which analyzes historical price behavior across annual calendar windows going back up to 30 years. Read the full data methodology or the book The 100-Year Pattern by Afshin Moshrefi (2026 edition). Past performance of seasonal patterns does not guarantee future results. This article is for informational purposes only and does not constitute investment advice.