15-for-15: Merck & Co. (MRK) Has Rallied Every Midterm Sep-Apr Window, Averaging 22.33% Gains
Merck & Co. is stepping into a historically powerful Sep–Apr trading window just as shares hover near record territory and options activity picks up, raising the stakes for this election-cycle stretch.
Price as of Aug 31, 2026: $147.76 (last close).

What is the seasonal pattern for Merck & Co. (MRK)?
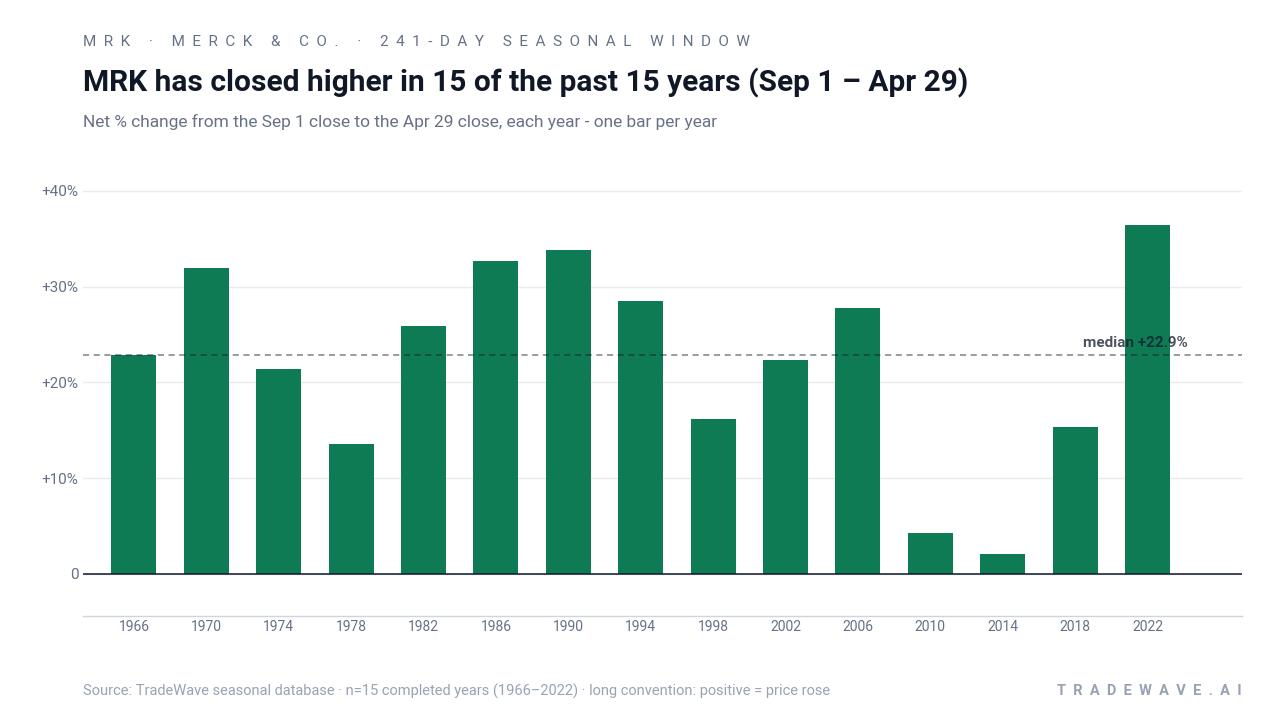
Merck & Co. has risen in 15 of 15 midterm-year Sep 1 to Apr 29 windows, with an average gain of 22.33% in winning years.
- 15 for 15 in this window, averaging 22.33% gains in winning years across the last 15 midterm election years.
- Percent Profitable is 100%, with 15 winners and 0 losers in this 241-day Sep 1 to Apr 29 trading window.
- Avg Profit of 22.33% reflects strong upside in each completed cycle, while the annualized return for the pattern is 21.91%.
- The TradeWave Ratio of 2.22 signals that price has typically traveled meaningfully in the long direction within the window, not just at the close.
- Intraperiod swings have included double-digit drawdowns in some years, even though every window finished positive.
- The pattern sits in the concluding midterm election year and runs into the pre-election year, a phase that has often favored large-cap healthcare stocks.
According to historical data from TradeWave.ai, this midterm-year Sep–Apr stretch has behaved very differently from an average calendar window for Merck & Co. in prior cycles. The next section walks through how that election-cycle pattern lines up with today’s setup.
How has Merck & Co. (MRK) traded in past Sep–Apr midterm-year windows?
Merck & Co. has posted gains in every single Sep 1 to Apr 29 window across the last 15 midterm election years, averaging a 22.33% rise per cycle. Shares enter this year’s window at 147.76, up 40.58% year to date and about 5.8% below the 52-week high of 156.92. Unusually heavy call buying, with 68,587 contracts traded or roughly 188% above typical daily options volume, has added a layer of speculative interest around the stock as this historically strong stretch begins.[10][11]
The presidential election cycle matters here because this pattern is built only from midterm election years, then runs deep into the following pre-election year. That grouping captures a policy mix that has often combined tighter fiscal debate in the midterm year with a more pro-growth tone as Washington pivots toward the next presidential race, a backdrop that has historically supported large-cap healthcare names like Merck & Co.[1][2]
Across those 15 midterm-year samples, the trade direction is long and the record is clean: 15 winners, 0 losers, and a 100% Percent Profitable reading. Average gains of 22.33% sit alongside a median profit of 22.85%, which tells you the typical outcome has been a strong double-digit advance rather than a few outliers skewing the math. The annualized return of 21.91% and a Sharpe ratio of 1.9 point to a historically favorable risk-adjusted profile for this specific Merck & Co. trading window.
Intraperiod behavior has still involved real swings. In 1986, for example, Merck & Co. gained 32.7% over the window, but the best point-to-peak move reached 50.77% while the worst drawdown from entry was a 12.51% slide before the stock recovered. In 2014, the net gain was only 2.12%, yet the stock still saw a 7.99% peak run-up and an 11.57% adverse move at the low, underscoring that even “winning” years have contained double-digit downside at some point.
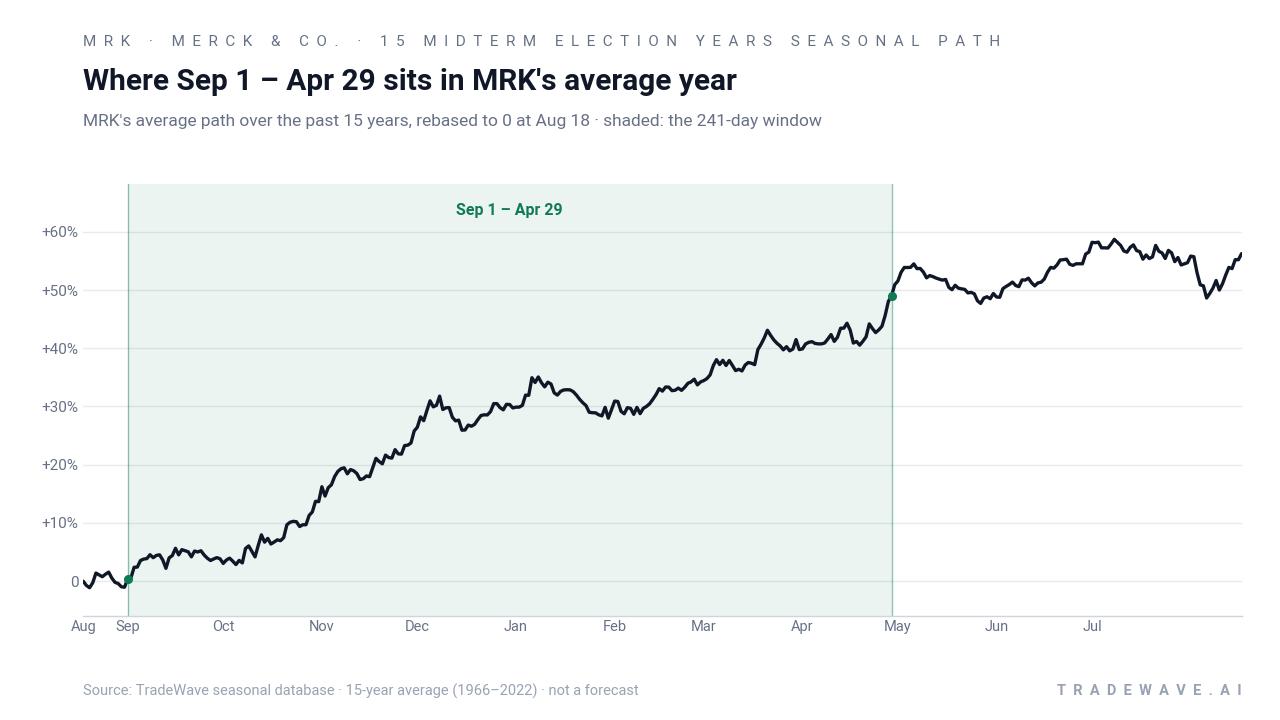
The historical seasonal trend chart shows this 241-day stretch sitting in what has typically been the strongest part of Merck & Co.’s average year. Returns have tended to build steadily from early autumn through late winter, with the bulk of the move often realized before the final weeks of the window. That pattern lines up with the broader tendency for the pre-election year to be one of the more supportive phases for equities, especially when policy uncertainty begins to clear.[1][2]
A second view combines yearly net results with the full intraperiod range, from worst drawdown to best rally.
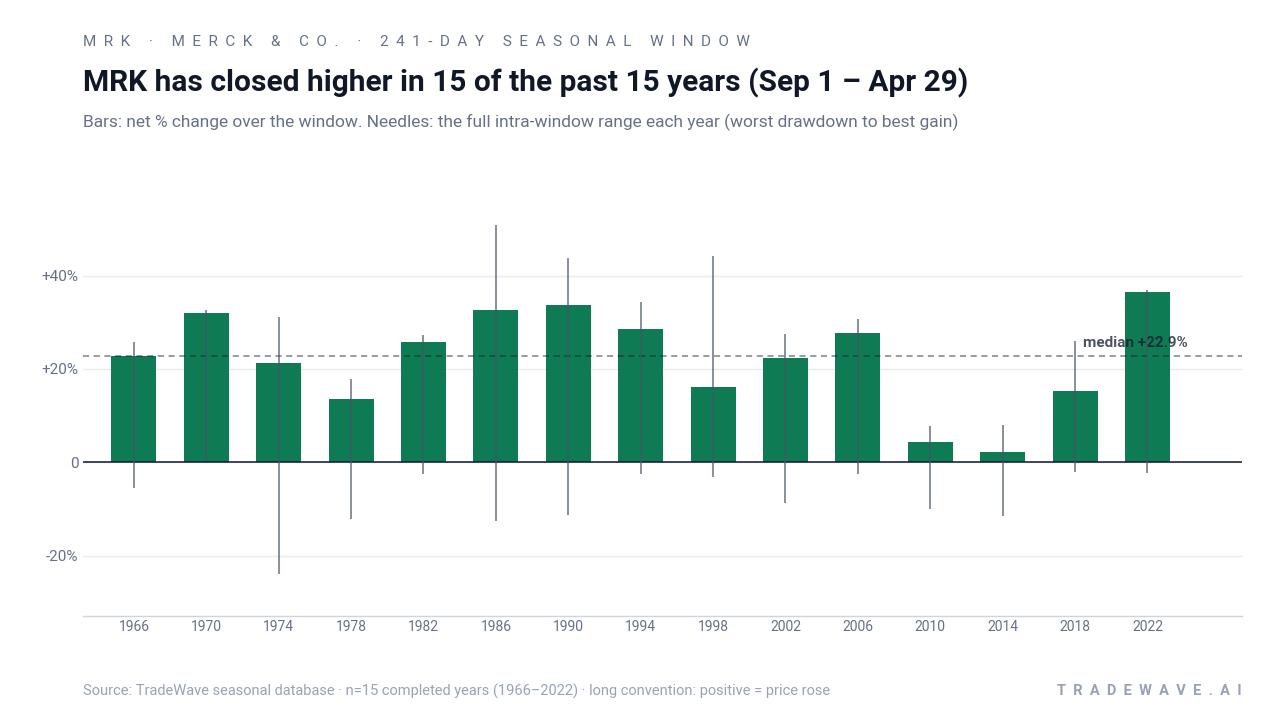
The combined net / maximum favorable move / maximum adverse move view shows a consistent pattern of upside persistence with meaningful volatility. Maximum favorable excursions have often pushed well beyond the final net gain, which is what you would expect from a TradeWave Ratio of 2.22 that tracks how far price typically travels in the trade direction within the window. At the same time, several years feature needles extending into double-digit adverse territory, a reminder that even a strong historical edge has come with uncomfortable drawdowns along the way.
History does not guarantee future results; adverse excursions can be large even in winning windows, and past seasonal strength does not ensure similar outcomes for Merck & Co. this cycle.
Why does Merck & Co. (MRK) follow this seasonal pattern?
One likely driver is the way Merck & Co.’s earnings calendar clusters inside this Sep–Apr stretch, with key third- and fourth-quarter reports often landing as investors reposition around the policy and spending outlook in the run-up to a presidential election year.[3][5] Institutional portfolio rebalancing and sector rotation into defensive growth areas like pharmaceuticals during late-year macro uncertainty may also support the pattern.[1][2] The combination of earnings visibility, healthcare’s defensive appeal and a historically supportive pre-election liquidity backdrop offers a plausible explanation for why this specific midterm-year window has been so consistently strong.
What is driving Merck & Co. (MRK) today?
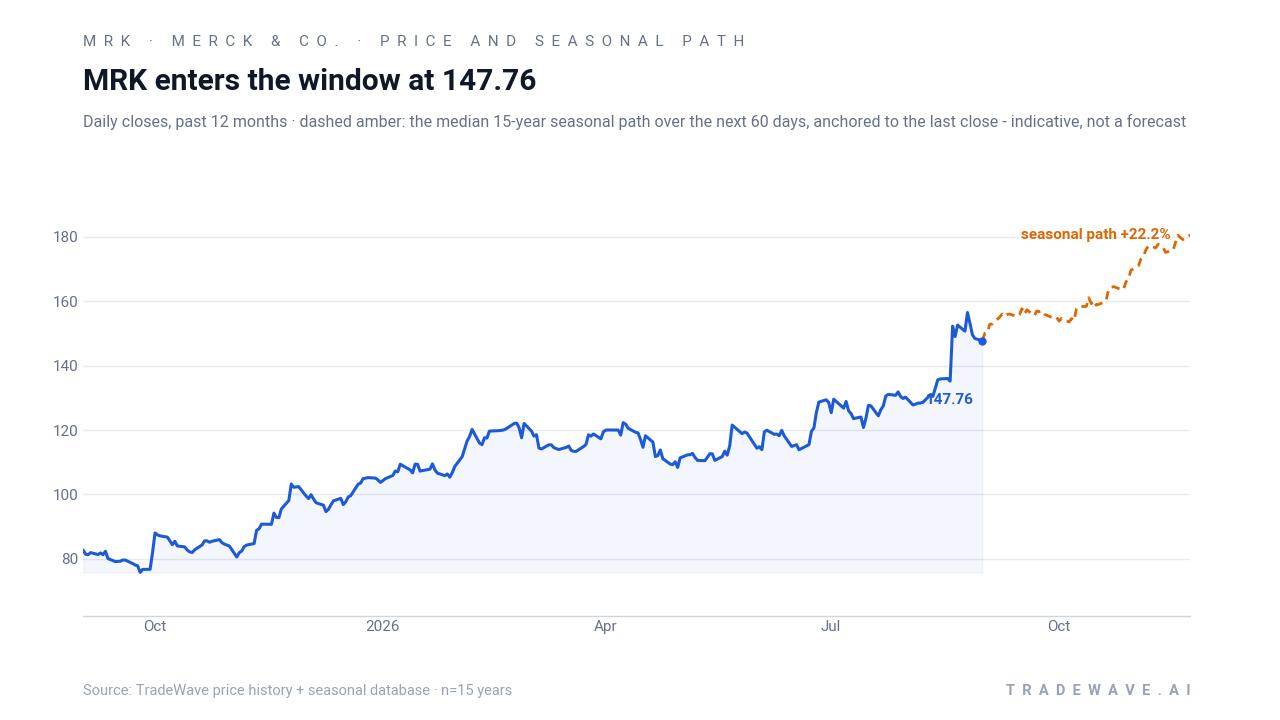
Merck & Co. closed at 147.76 on Sep 1, down 0.4% on the day, but the stock is still up 40.58% year to date and sits about 5.8% below its 52-week high of 156.92. That rally has pushed Merck & Co. into the upper end of its 12-month range, far above the 52-week low near 74.08, and comes as Wall Street maintains a “Moderate Buy” consensus rating with a blended price target around 148.69 from major analyst aggregators.[2][3][4]
Fresh research from Argus and others highlights Merck & Co.’s mix of established franchises and newer products, with Keytruda still a dominant profit engine even as investors look to pipeline assets and recent acquisitions to cushion eventual patent expiries.[1][7] Analyst services tracking estimate revisions note that consensus calls for third-quarter 2026 earnings of about $2.24 per share on $17.50 billion in revenue, with the next earnings report scheduled for Oct 29, 2026, a key checkpoint inside this seasonal window.[3][5]
On the positioning side, MarketBeat data shows short interest around 24.51 million shares with a recent decline of 13.35%, suggesting bears have been covering into strength rather than leaning harder against the move.[2][9] At the same time, institutional filings point to active reshuffling: Antipodes Partners has trimmed its stake, while BlackRock and Wellington Management have reported sizeable holdings or incremental purchases, reinforcing Merck & Co.’s status as a core healthcare allocation for large asset managers.[8][12][13]
Options flow has been particularly notable. MarketBeat flagged unusually heavy call activity tied to a Morgan Stanley upgrade to “Overweight,” with 68,587 calls trading, roughly 188% above typical daily volume, and options screens continue to show elevated open interest across popular strikes.[10][11] For a stock already near its highs, that kind of leveraged bullish positioning can amplify both upside follow-through and any pullback if sentiment cools.
The chart below situates the latest move in its recent multi-month context alongside the median 60-day seasonal path.
What should traders watch in this Merck & Co. seasonal window?
First, the calendar. The current pattern phase is the concluding midterm election year, and this 241-day window runs straight into the pre-election year, which has often been one of the stronger stretches for equities and for Merck & Co. specifically.[1][2] How the stock behaves around the Oct 29 earnings report and subsequent guidance will be a key test of whether this cycle can echo the historical 15-for-15 record.[3]
Second, levels. On the upside, traders will be watching whether Merck & Co. can retake and hold above the 52-week high near 156.92, which would keep the current uptrend intact. On the downside, any sustained break back toward the 50-day moving average around 132.13 would signal a deeper consolidation than the typical intraperiod drawdowns seen in prior winning windows.
Third, options and positioning. The recent burst of call buying and elevated options volume will matter most if it persists or accelerates as the window progresses.[10][11] Continued heavy call demand and stable or falling short interest would align with the historical bullish seasonal trend, while fading options activity or a rebuild in short positions could hint that this cycle may diverge from the clean 15-for-15 track record.[2][9]
Finally, macro and sector tone. Any shift in the policy debate around drug pricing, healthcare regulation or fiscal priorities as the pre-election year approaches could influence how investors treat large pharmaceutical names.[1][7] If Merck & Co. can navigate those headlines while holding its leadership role in the healthcare sector, history suggests this Sep–Apr trading window has been one of the more favorable times to own the stock, even if the path has rarely been smooth.
Sources
- Yahoo Finance (Argus report hosted on Yahoo) - Merck & Company, Inc. (MRK) Stock Forecasts - Argus Analyst Report
- Barron's (market data) - Merck & Co. Inc. Research & Ratings | MRK | Barron's
- ChartMill - MRK Forecast, Price Target & Analyst Ratings | ChartMill.com
- Barchart - MRK - Merck & Company Stock Price - Barchart.com
- Yahoo Finance (article) - Here is What to Know Beyond Why Merck & Co., Inc. (MRK) is a Trending Stock
- Yahoo Finance (news) - Merck (MRK) Stock Sinks As Market Gains: Here's Why
- MarketBeat - Merck & Co., Inc. (NYSE:MRK) Upgraded at Wall Street Zen
- MarketBeat - Merck & Co., Inc. $MRK Shares Sold by ANTIPODES PARTNERS Ltd
- MarketBeat - Merck & Co., Inc. (MRK) Short Interest & Short Float | Updated Aug 2026
- MarketBeat - Merck & Co., Inc. (NYSE:MRK) Raised to Overweight at Morgan Stanley
- MarketBeat - Merck & Co., Inc. (MRK) Options Chain & Prices 2026
- MarketBeat - Merck & Co., Inc. $MRK is Wellington Management Group LLP's 8th Largest Position
- MarketBeat - Merck & Co., Inc. $MRK Shares Acquired by BlackRock Inc.
About this seasonal analysis
Seasonal pattern data is sourced from TradeWave.ai, which analyzes historical price behavior across annual calendar windows going back up to 30 years. Read the full data methodology or the book The 100-Year Pattern by Afshin Moshrefi (2026 edition). Past performance of seasonal patterns does not guarantee future results. This article is for informational purposes only and does not constitute investment advice.