9-for-9: Microsoft (MSFT) Has Closed Higher in Every Sep 5-Dec 1 Midterm Window, Averaging 13.8% Gains
Microsoft is heading into a midterm-year fall stretch that has never produced a losing season in the past nine cycles, just as shares trade near record territory and options traders lean bullish.
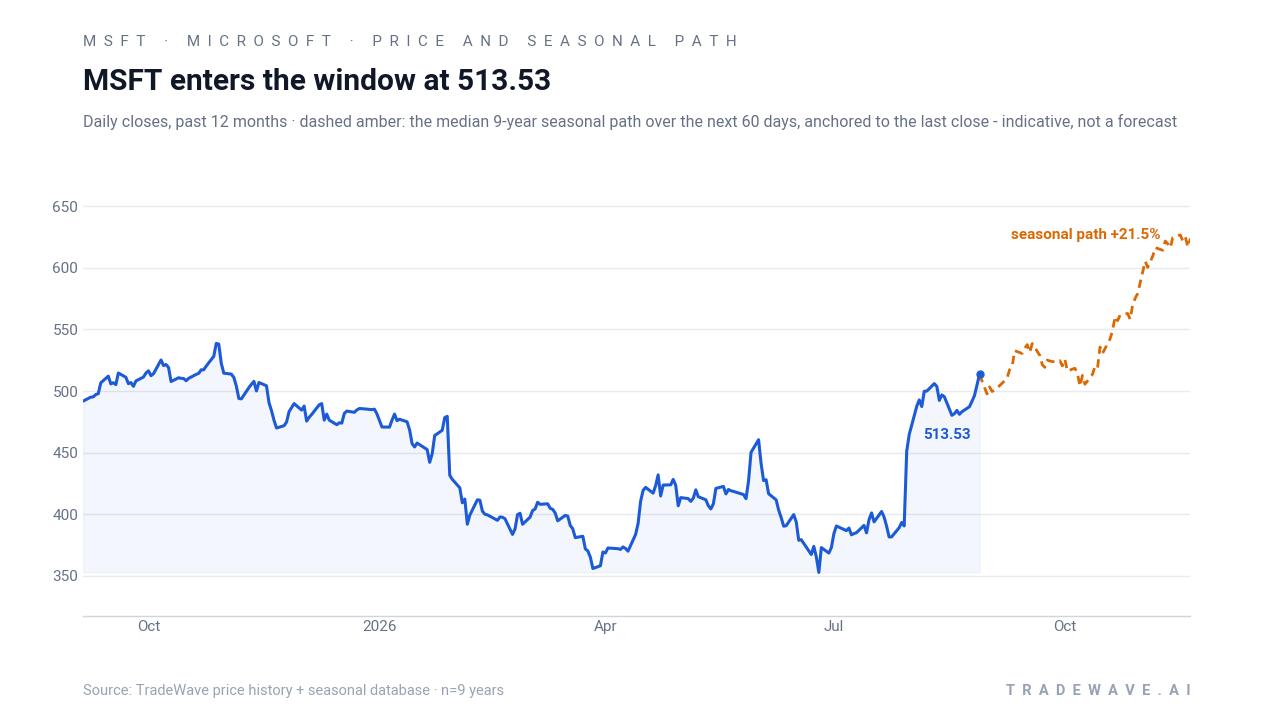
Price as of Aug 28, 2026: $513.53 (last close).

What is the seasonal pattern for Microsoft (MSFT)?
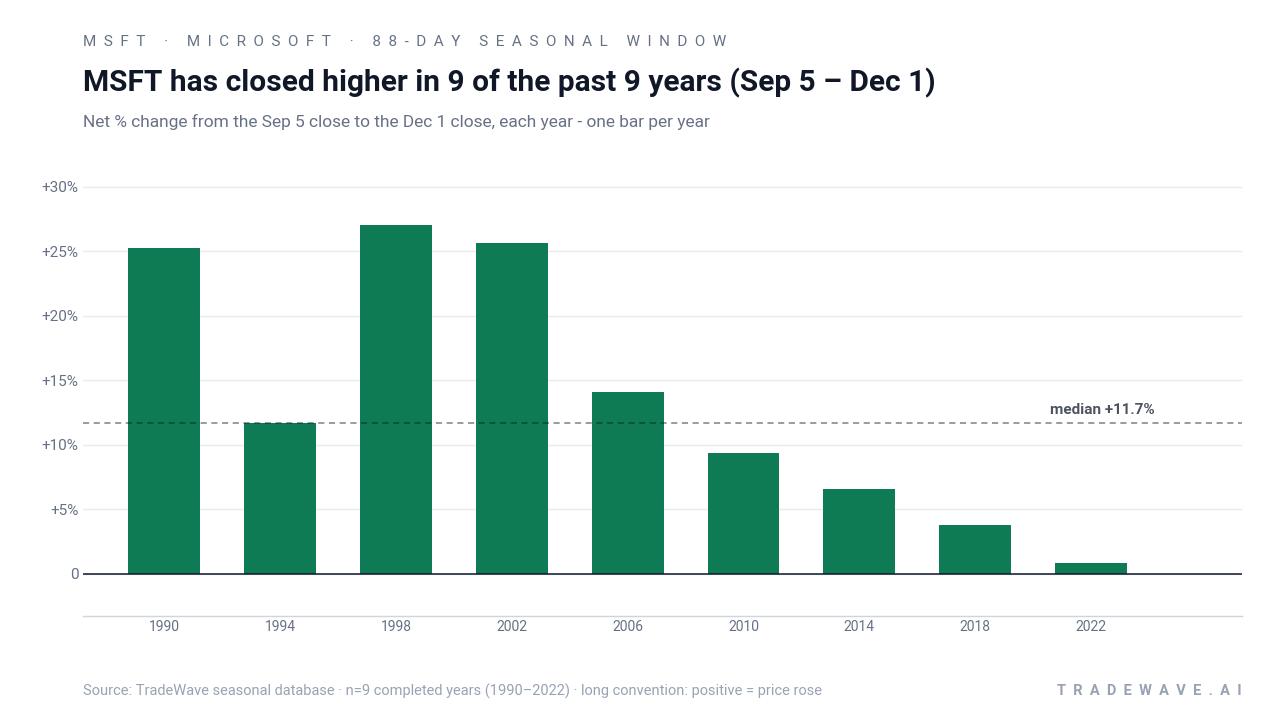
Microsoft has risen in 9 of 9 years during this Sep 5 to Dec 1 midterm-year window, with an average gain of 13.8% in winning years.
- 9 for 9 in this window, with Microsoft averaging 13.8% gains in winning years across the last nine midterm election cycles.
- Seasonal window runs from Sep 5 through Dec 1, spanning 88 days that have historically favored long exposure to MSFT.
- Percent Profitable is 100%, with 9 winners and 0 losers across the historical sample.
- TradeWave Ratio of 1.87 signals that price has typically traveled meaningfully in the trade direction within the window, not just at the close.
- A Sharpe ratio of 1.29 for this window points to strong risk-adjusted returns relative to typical MSFT moves.
- Intraperiod swings have included double-digit drawdowns in some years, so the path has not always been smooth even when the final result was positive.
According to historical data from TradeWave.ai, this upcoming stretch has behaved very differently from an average autumn for Microsoft. The next section walks through how that midterm-year pattern has played out in prior cycles and what it could mean for the months ahead.
How strong is Microsoft’s (MSFT) midterm-year fall seasonal window?
Microsoft has closed higher in every single Sep 5 to Dec 1 window across the last nine midterm election years, averaging a 13.8% gain. The stock finished Monday at 513.53, up 1.7% on the day and about 6.1% below its 52-week high of 546.77. That combination of a clean 9-for-9 seasonal record and a price still shy of recent peaks gives this year’s window unusual weight for a mega-cap that anchors the S&P 500 and Nasdaq.
Because this pattern is grouped by the presidential election cycle, it reflects how Microsoft has behaved specifically in the midterm election year, not just any random autumn. That matters in 2026 because markets are wrapping up the midterm phase and will soon transition into the year before the presidential election, a period that has often seen policy noise fade and risk appetite rebuild.
This seasonal window begins on Sep 5 and spans 88 days. Historically, during this period in midterm election years, Microsoft has shown a strong bullish tendency for long positions. Percent Profitable sits at 100%, with 9 winners and 0 losers, so every midterm-year run in this slice of the calendar has ended in the green.
The average gain across all years is 13.8%, while the median outcome is 11.72%, which tells you the wins have not been driven by a single outlier. The strongest year in the sample was 1998, when Microsoft rallied 27.0% between the Sep 5 and Dec 1 closes, while the weakest was 2022, which still finished up 0.85% despite a much rougher macro backdrop.
Intraperiod swings have been meaningful. In 1998 the best point-to-peak move, or maximum favorable excursion, reached 27.75% before settling back to a 27.0% net gain, while the worst drawdown from entry, or maximum adverse excursion, was 13.94% in 2022 even though that year ultimately closed higher. Several other cycles, including 1990 and 2014, saw adverse moves of roughly 8% to 9% inside the window before recovering.
The trend profile leans steadily higher rather than front-loaded. In most years, gains have tended to build through October and November rather than arriving in a single early burst, which fits with the way large-cap tech often trades around earnings, holiday demand and year-end positioning.
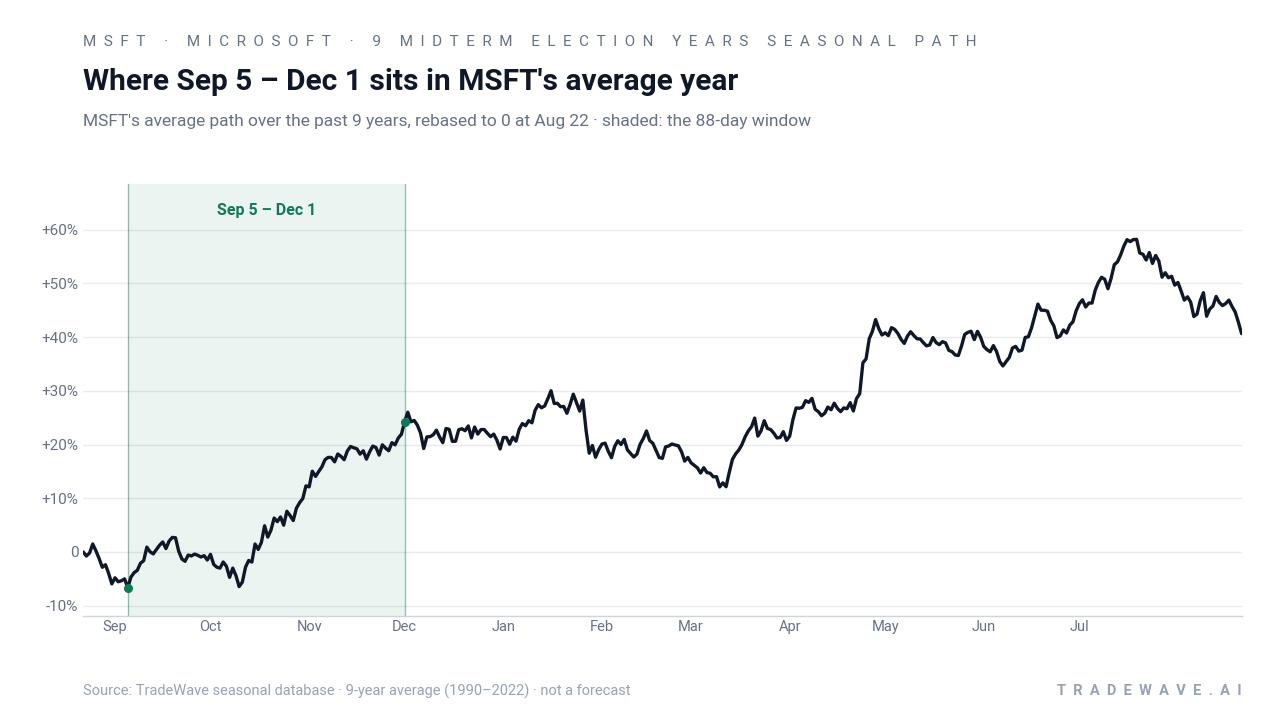
Yearly net and intraperiod ranges show how upside and downside have both been in play inside this bullish window.
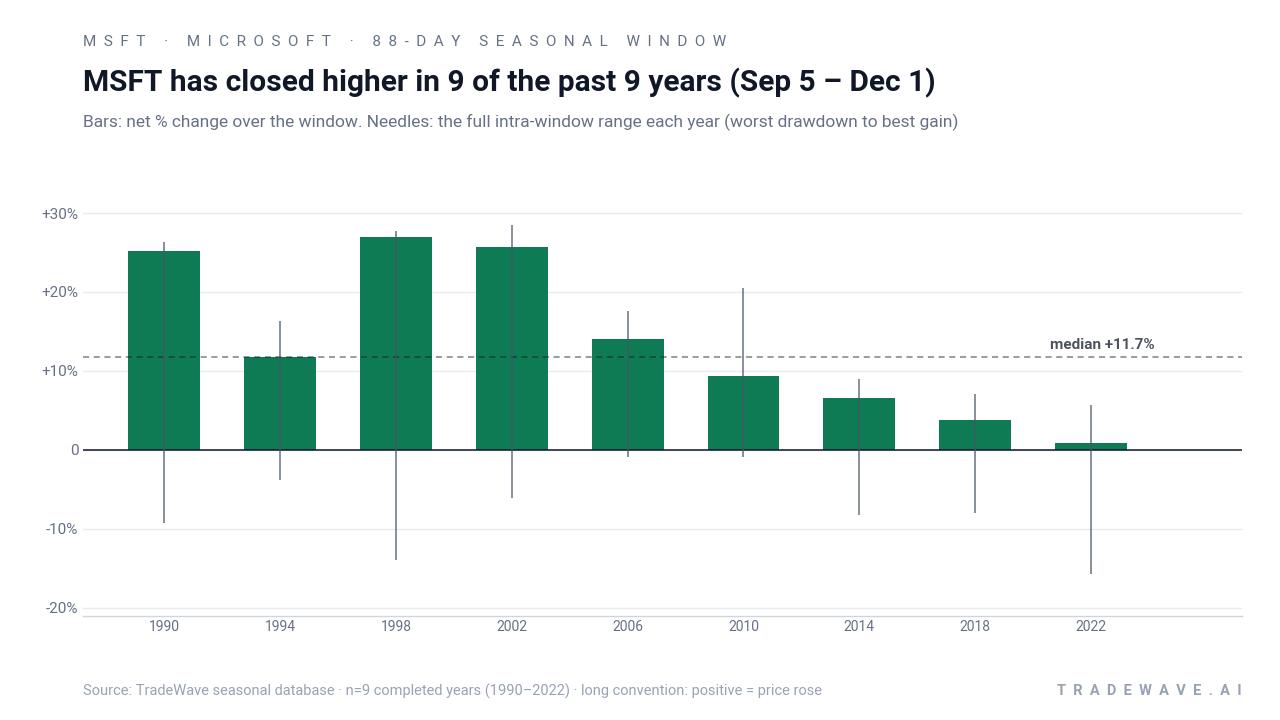
The stacked net, best-case and worst-case excursions underline the key message: this has been a powerful but not low-volatility window. In several years the maximum favorable move has pushed into the mid-teens or higher, while the worst drawdowns have often sat in the mid-single to low-double digits. Add it up and the cumulative return from repeatedly holding this 88-day window across the nine midterm cycles comes to roughly 210%.
History does not guarantee future results; adverse excursions can be large even in winning windows, and traders should treat this seasonal pattern as context rather than a forecast.
Why does Microsoft (MSFT) follow this seasonal pattern?
One likely driver is the way Microsoft’s fiscal calendar and product cycle line up with the broader U.S. election cycle. Midterm autumns often combine fiscal Q1 earnings, cloud and AI budget resets, and year-end enterprise spending decisions, which can favor a mega-cap software and cloud leader. Analysts have also pointed to institutional portfolio rebalancing and sector rotation into large-cap tech as the midterm year gives way to the typically more risk-on year before the presidential election, which may help explain why this specific Sep 5 to Dec 1 window has been so consistently positive.
What is driving Microsoft (MSFT) today?
Microsoft shares closed Monday at 513.53, up 1.7% on the session and sitting about 6.1% below their 52-week high, after a strong August that left the stock up 10.5% over the past month. Analyst coverage remains firmly positive, with MarketBeat and ChartMill data showing a consensus Buy rating and an average price target around 577.24 from large brokerages and research shops.[1][2][3] That target implies upside from current levels, even after a multi-quarter run driven by cloud and AI enthusiasm.
On the fundamental side, Microsoft is coming off a string of earnings beats. MarketWatch data show fiscal 2026 EPS of 4.13, 4.14, 4.27 and 4.74 across the first four quarters, each topping consensus by between $504.87 and $517.78 per share, underscoring the company’s ability to convert AI and cloud demand into profits.[3] Analysts ahead of the July 29 fiscal Q4 report flagged higher capital expenditure tied to AI infrastructure as a key theme, with some expecting near-term margin pressure as Microsoft builds capacity for Azure and related services.[4]
That capex story sits inside a broader macro and sector backdrop where AI and cloud spending remain the dominant narrative. A July analysis highlighting that more than 60 analysts rate Microsoft a Buy pointed to robust Azure backlog and elevated AI-related investment as central to the long-term bull case, even as higher spending raises questions about near-term free cash flow and returns on invested capital.[6] For traders watching the MSFT seasonal trend, this mix of strong demand and heavy reinvestment is the macro canvas on which the upcoming fall window will play out.
Positioning is also shifting under the surface. A late August options report from Barchart flagged Microsoft among the leaders in unusual options activity, citing large bullish call blocks, high volume relative to open interest on November calls, and concentrated long call spreads that point to aggressive upside bets by some traders.[7] That kind of options flow can amplify moves if the stock starts to trend, because dealers hedging those positions may need to buy more stock as MSFT rises.
The chart below situates the latest move in its recent multi-month context and overlays the median historical seasonal path for the next 60 days.
What should traders watch in this Microsoft (MSFT) seasonal window?
First, the calendar. The 88-day window kicks off on Sep 5 and runs through Dec 1, overlapping Microsoft’s next earnings report, which is scheduled for Oct 27.[2][3] How the stock trades into and out of that print will be a key test of whether this midterm-year seasonal pattern continues to hold.
Second, levels. Traders will be watching whether MSFT can retake and hold above the 52-week high near 546.77 during the window, or whether rallies stall below that zone. A sustained break to new highs with contained drawdowns would rhyme with the stronger historical years like 1990, 1994 and 2006, where adverse moves stayed relatively shallow.
Third, the options tape. The recent burst of bullish call activity and elevated options volume puts a spotlight on whether that flow persists or fades as the window opens.[7] Continued heavy call buying and rising open interest into November would reinforce the idea that institutional and tactical traders are leaning into the historical MSFT seasonal trend, while a sharp reversal in flow or a build in downside protection would suggest growing caution.
Finally, the policy and macro calendar. As the U.S. moves from the midterm election year toward the year before the presidential election, investors will parse any shifts in fiscal stance, regulation around AI and cloud, and broader risk appetite. If Microsoft behaves anything like it has in the last nine midterm cycles, strength during this Sep 5 to Dec 1 window would fit a pattern where large-cap tech helps lead the market out of midterm-year chop and into a more constructive pre-election phase.
Sources
- MarketBeat - Microsoft (MSFT) Stock Forecast and Price Target 2026
- ChartMill - MSFT Forecast, Price Target & Analyst Ratings
- MarketWatch - Microsoft Corp. Analyst Estimates - MSFT
- Yahoo Finance / Stocktwits - MSFT Sees Fresh Price Target Cuts Days Before Quarterly Report – Citi Sees Strong Q4 But Expects Higher Capex Spend In Q1
- Yahoo Finance - Is Microsoft (MSFT) One of the Best AI Stocks to Buy in June?
- Yahoo Finance / 24/7 Wall St. - Over 60 Analysts Say Buy Microsoft. Here’s Our Price Target
- Barchart - Unusual Options Activity: NFLX, HONA, and MSFT Lead the Way With These 3 Options Strategies
About this seasonal analysis
Seasonal pattern data is sourced from TradeWave.ai, which analyzes historical price behavior across annual calendar windows going back up to 30 years. Read the full data methodology or the book The 100-Year Pattern by Afshin Moshrefi (2026 edition). Past performance of seasonal patterns does not guarantee future results. This article is for informational purposes only and does not constitute investment advice.