MRVL Has Fallen in Every Midterm-Year October, Now Near $211
MRVL is trading around $211 as it heads toward an early-October trading window that has been consistently weak in past midterm election years, even as AI-fueled growth and heavy options and insider activity keep the stock in focus.
Price as of Aug 31, 2026: $211.66 (last close).

What is the seasonal pattern for MRVL (MRVL)?
MRVL has fallen in 6 of 6 midterm election years during the Oct 1–9 window, with an average 7.17% gain for short trades in winning years.
- 6 for 6 in this window, with short trades averaging 7.17% profit across the last six midterm election years.
- Seasonal bias is bearish for the stock price from Oct 1 through Oct 9, based on a short trade direction.
- Percent Profitable is 100%, with 6 winners and 0 losers across the historical sample.
- Annualized return for the pattern is 7.1%, with a Sharpe ratio of 1.65 on end-of-window outcomes.
- The TradeWave Ratio of 1.58 indicates price has typically traveled meaningfully in the short direction within the 9-day window.
- Individual years have seen sizable intraperiod swings, with both sharp favorable moves for shorts and notable drawdowns before the final close.
According to historical data from TradeWave.ai, this specific early-October stretch in midterm election years has behaved very differently from an average month for MRVL. The next section walks through how that pattern has played out in prior cycles and what it means as the 2026 window approaches.
How has MRVL (MRVL) traded in the early-October midterm-year window?
MRVL has closed lower in every single Oct 1–9 window across the last six midterm election years, with short trades posting an average profit of 7.17%. Shares finished Monday at $211.66 after a 2.3% drop, leaving the stock well below its 52-week high of $329.72 and far above its 52-week low of $61.18. Heavy options activity around earnings earlier in 2026, including large call and put flows, has already flagged MRVL as a favored vehicle for tactical positioning in this cycle.[1]
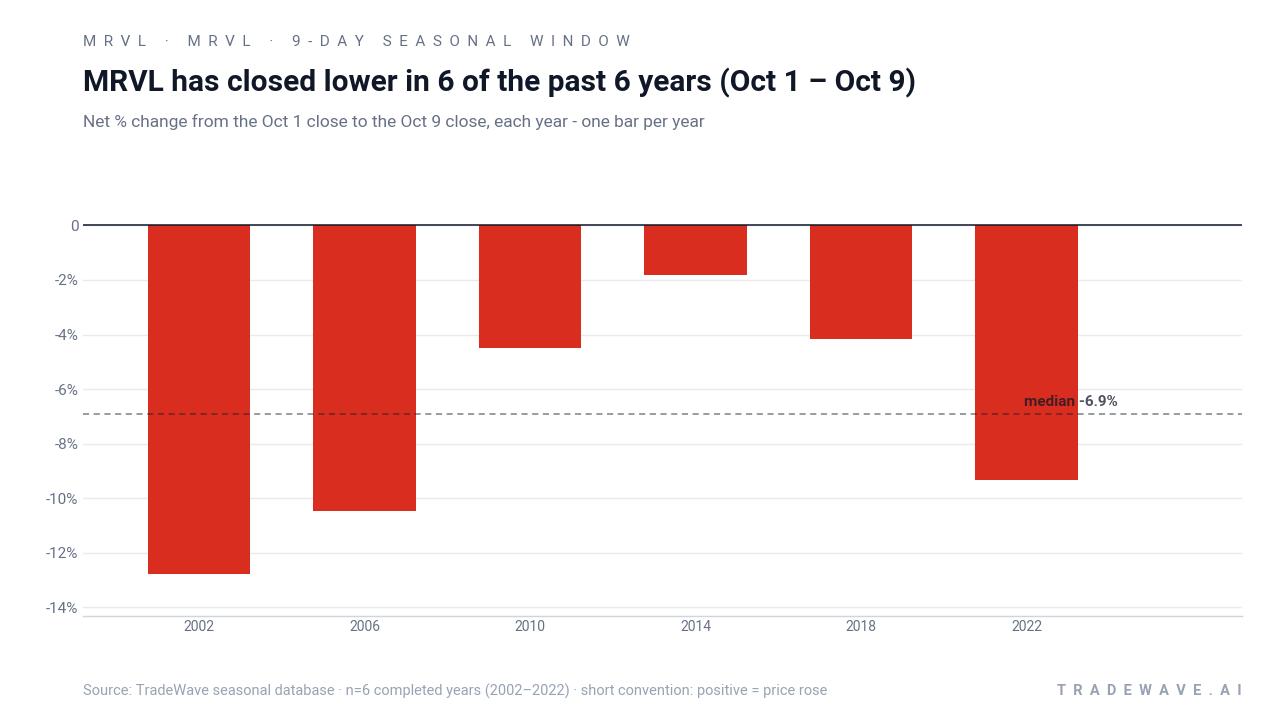
The pattern is grouped by the presidential election cycle, focusing on the last six midterm election years rather than consecutive calendar years. That matters because midterm years often feature shifting policy expectations, tighter financial conditions and more volatile risk appetite as Washington debates spending and regulation, which can hit high-beta semiconductor names like MRVL differently than in pre-election or election years.
Across those six midterm-year samples, the short trade has been profitable every time, with net returns ranging from about 1.8% to 12.77% in favor of the short side. The strongest year for shorts was 2002, when MRVL fell roughly 12.77% between the Oct 1 entry and the Oct 9 exit, while the softest win came in 2014 with a 1.8% decline over the same dates. Even the more modest years still finished lower, which is why the Percent Profitable metric sits at 100% with 6 winners and 0 losers.
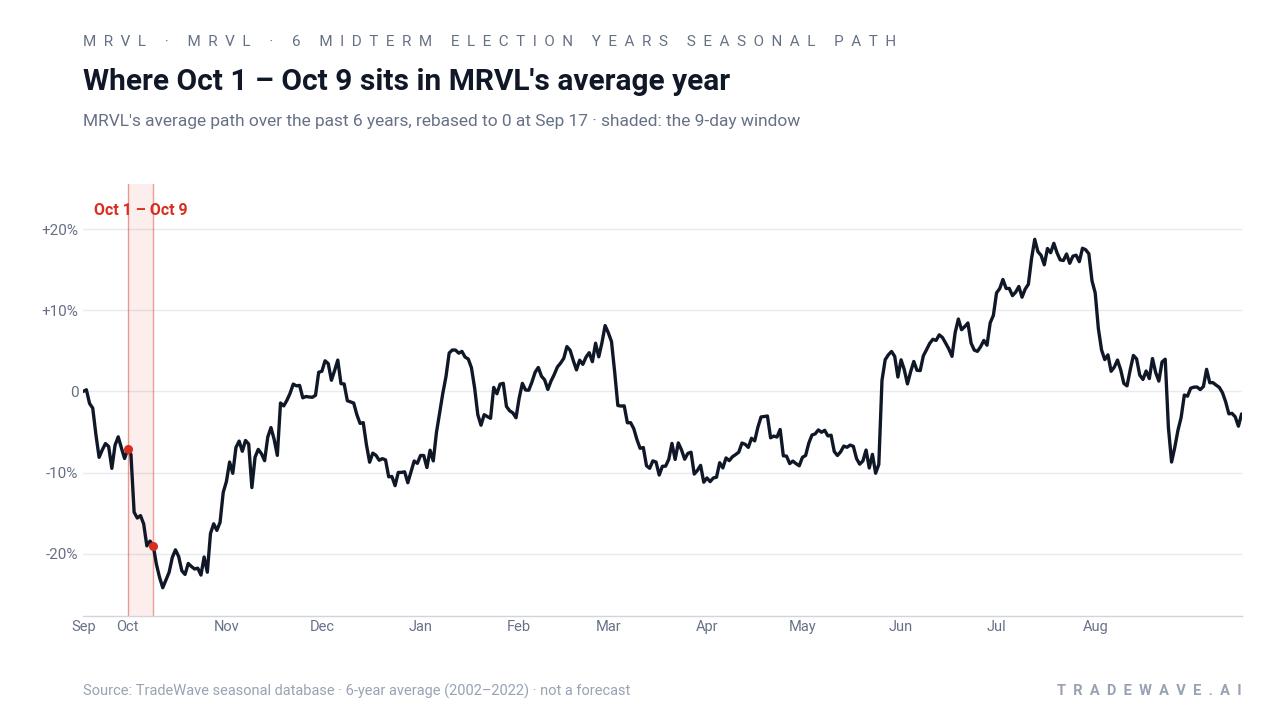
The historical seasonal average shows MRVL often firming or drifting ahead of late September, then rolling over into the Oct 1–9 stretch. That profile fits a pattern where positioning and optimism build into the back half of the quarter, only to meet profit-taking or macro jitters as the midterm-year calendar turns to October.
Year-by-year ranges show how far MRVL has typically swung inside the window before settling at the final close.
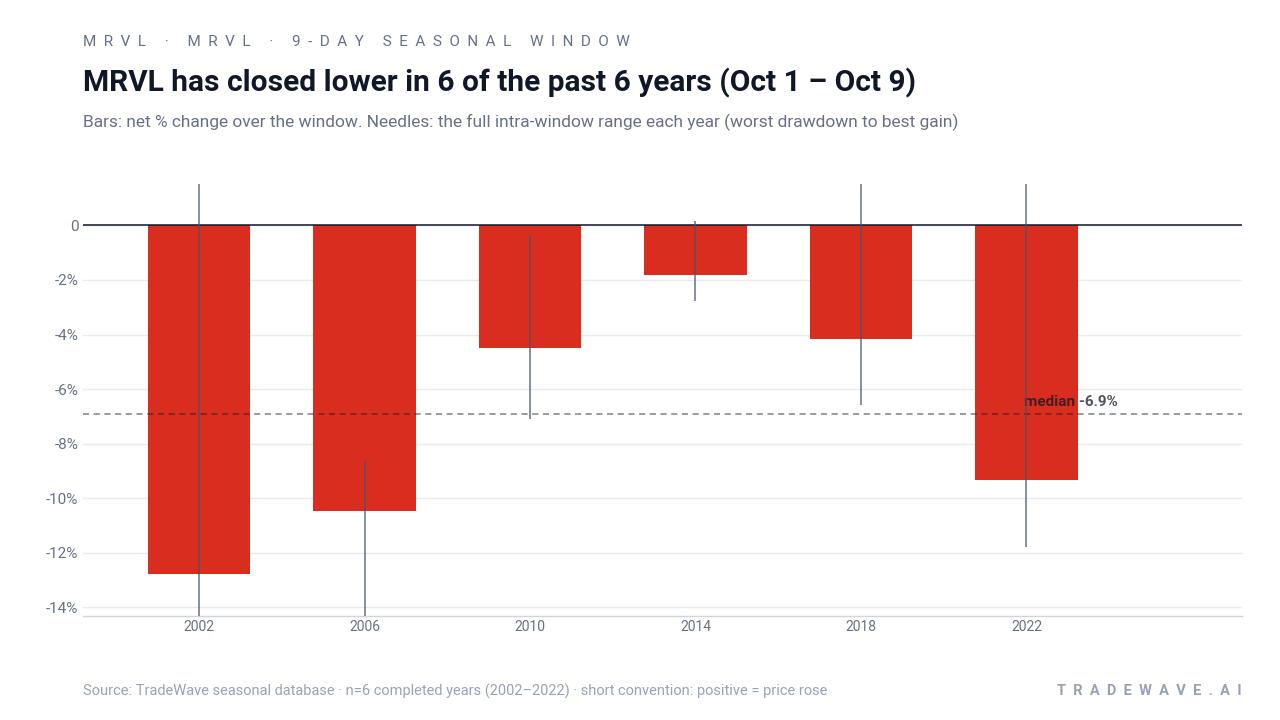
The combined net / maximum favorable move / maximum adverse move view shows that in some years, like 2022, MRVL first rallied as much as 10.92% against the short before ultimately finishing about 9.33% lower, while in others, such as 2006, the stock mostly moved in the short direction with a smaller countertrend bounce. That mix of large favorable moves for shorts and meaningful adverse swings explains the 1.58 TradeWave Ratio and underlines that this has been a high-variance but consistently profitable window for the short side.
History does not guarantee future results; even in windows where every past year was profitable for shorts, adverse excursions within the period have been large enough to challenge timing and risk management.
Why does MRVL (MRVL) follow this seasonal pattern?
One likely driver is the clustering of earnings and guidance resets around this part of the fiscal calendar, which can trigger sharp repricing in high-growth semiconductor names. Analysts have also pointed to institutional portfolio rebalancing and sector rotation in late midterm years, as investors adjust AI and data-center exposure ahead of the historically stronger pre-election year.[1] For a stock like MRVL that sits at the intersection of AI demand and cyclical semis, those flows can translate into a repeatable early-October air pocket in midterm cycles.
What is driving MRVL (MRVL) today?
MRVL closed Monday at $211.66, down 2.3% on the day, as traders digested a powerful post-earnings run and a stock that has more than tripled off its 52-week low of $61.18 while still sitting well below its $329.72 high. On Aug 27, the company reported fiscal second-quarter revenue of $2.74 billion, up about 36.5% year over year, with adjusted EPS of $0.94 topping the $0.93 consensus and management citing strong AI-related bookings and a higher long-term revenue outlook.[1] The following day, multiple Wall Street firms including Oppenheimer, Rosenblatt, Susquehanna, Wells Fargo and Needham raised price targets and reiterated bullish ratings, helping push the consensus view to a Strong Buy with a roughly $279 target from Barchart’s analyst summary.[1][4]
Behind the headline numbers, MRVL is increasingly seen as a key supplier of custom AI accelerators and networking silicon, a niche that has drawn favorable comparisons to other AI infrastructure plays and helped justify aggressive growth assumptions.[1][2] That enthusiasm has come with heavy derivatives activity: multiple reports through 2026 have flagged unusually large options volumes, including chunky $300 calls ahead of earnings and outsized put flows earlier in the year, suggesting active speculative and hedging interest around catalysts.[1] At the same time, GuruFocus data show insiders have sold roughly $45.9 million of stock versus $2.1 million bought over the past 12 months, including a sale of nearly 18,000 shares by insider David Casper, a pattern some investors read as a sign of rich valuations after a big run.[6]
Short interest remains modest, with ChartMill citing a short float of 3.74% and days to cover at 0.71, which limits the potential for a classic squeeze but also means there is room for fresh bearish positioning if sentiment cools.[2] Put together, MRVL sits at the center of the AI demand story, with strong fundamentals and bullish analyst coverage on one side and heavy options activity plus notable insider selling on the other, all as the market wraps up the midterm election year and looks ahead to a historically more supportive pre-election backdrop for risk assets.
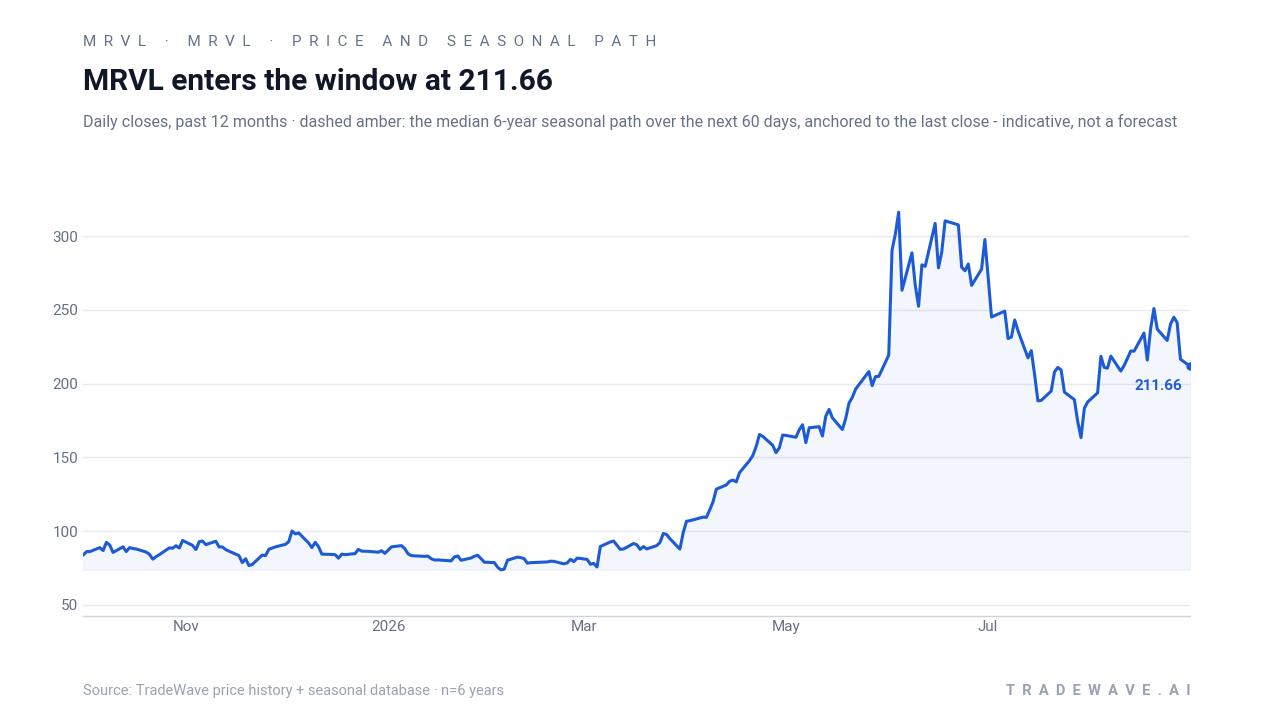
The chart below shows MRVL’s past year of trading alongside a 60-day seasonal projection path for context.
What should traders watch as the Oct 1–9 window approaches?
First, the calendar: the 9-day window begins on Oct 1, just as the market transitions from the concluding midterm election year into the historically stronger pre-election year regime. If MRVL follows its past midterm-year pattern, weakness would tend to cluster inside that early-October slice rather than bleed across the entire quarter.
Second, price levels matter. With the stock sitting far below its 52-week high but still dramatically above its 52-week low, traders will be watching whether MRVL consolidates between roughly $200 and $230 into late September or whether it attempts another leg higher that could set up more room for a pullback during the seasonal window. A clean break below recent support into the window would look more like prior midterm-year episodes where the short side dominated quickly, while a grind higher into Oct 1 would echo years like 2022, when shorts had to sit through a double-digit rally before the pattern ultimately paid off.
Third, options and insider behavior will be key tells. If the heavy call and put flows seen around the latest earnings report continue to build into late September, that would signal that sophisticated traders are again using MRVL as a levered way to express views on AI demand and macro risk, which could amplify any seasonal volatility.[1] A fresh wave of insider selling on strength would add to the sense that management sees the risk-reward as less compelling at elevated levels, while a pause in sales or any notable insider buying would cut against the historical pattern and might blunt the typical October softness.[6]
Finally, the macro and policy calendar will frame how this midterm-year pattern interacts with the broader tape. Any shifts in rate expectations, fiscal headlines out of Washington or changes in AI capex commentary from mega-cap cloud customers could either reinforce the historical early-October wobble in MRVL or override it. For traders who care about seasonality, the signal is clear: six for six is a rare record, and how MRVL behaves into and through the Oct 1–9 window will show whether this midterm-year pattern still has teeth in an AI-driven market.
Sources
- MarketBeat - Marvell Technology (NASDAQ:MRVL) Stock Price Expected to Rise, Oppenheimer Analyst Says
- ChartMill - MRVL Fundamental Analysis Report
- MarketBeat - Marvell Technology (NASDAQ:MRVL) Stock Price Up 2% Following Analyst Upgrade
- MarketBeat - Marvell Technology (NASDAQ:MRVL) Price Target Raised to $245.00
- Wall Street Journal Market Data - Marvell Technology Inc. (MRVL) Stock Price Today
- GuruFocus - MRVL Looks 110.0% Overvalued on GF Value™
About this seasonal analysis
Seasonal pattern data is sourced from TradeWave.ai, which analyzes historical price behavior across annual calendar windows going back up to 30 years. Read the full data methodology or the book The 100-Year Pattern by Afshin Moshrefi (2026 edition). Past performance of seasonal patterns does not guarantee future results. This article is for informational purposes only and does not constitute investment advice.